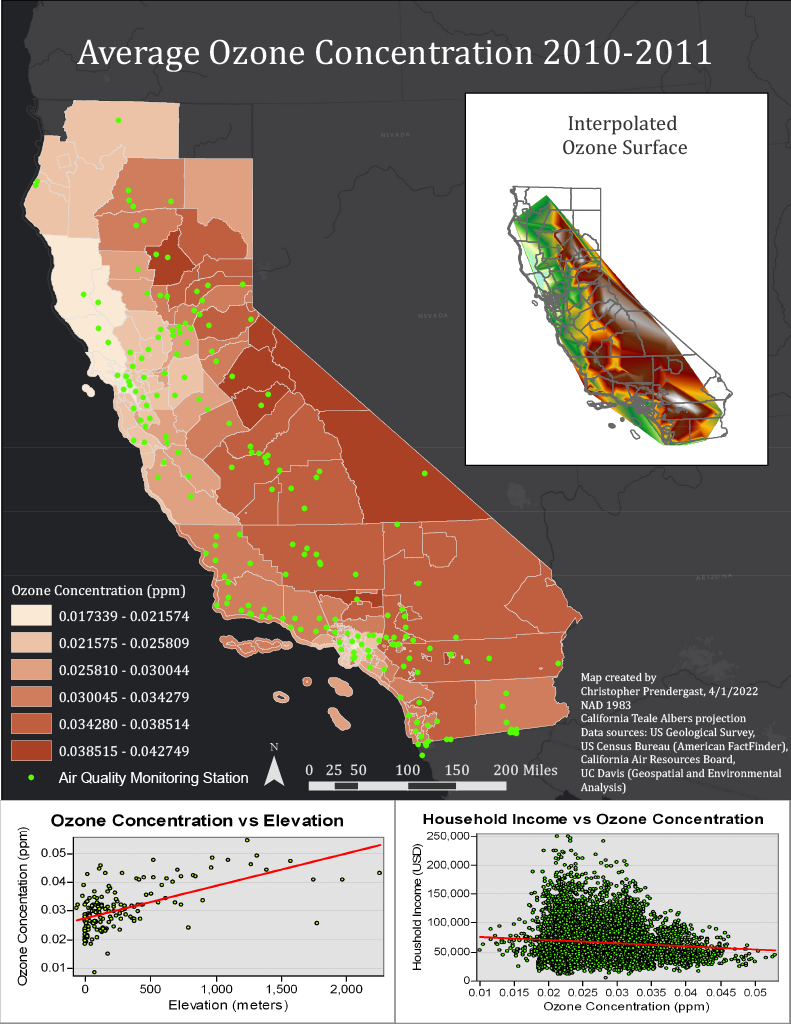
Map of Average Ozone Concentration
Map of average ozone concentration for 2010-2011 by county in California. The inset includes an interpolated concentration surface which is derived from the monitoring station data. Additional charts show the relationship between ozone concentration, elevation, and household income.