Overview
| Article Title | Map(s) |
|---|---|
| Analysis of Suitable Elephant Habitat, Narok and Kajiado Districts, Kenya | Protected Areas, Problem Elephants, Rainfall, Breakout from Mara River, Human Elephant Conflicts, Problem Elephants with Land Cover, Suitable Elephant Habitat, Protected Areas and Elephant Habitat, Recommended Study Areas, ModelBuilder Elephant Habitat |
| Analysis of a Proposed Development using ArcGIS CityEngine | Bookmark View, Grayscale View, Textured View, Demolished View, Proposed Design, Dashboard View, Visibility Analysis, ArcGIS Scene Viewer |
| Analysis of the Urban Heat Island Effect, Santa Clara County | Urban Heat Map |
| Bird Observations, Narok and Kajiado Districts, Kenya | Bird Observation Map |
| California Ozone | California Average Ozone Concentration |
| California Population Growth 2000 to 2010 | California Population Change (2000–2010) |
| Geodatabase Design, Calero County Park, Santa Clara County, California | Digitized Map |
| Housing Availability in San Jose | Housing Availability |
| Location Analysis for New Carbonate Mine, San Bernardino National Forest | Accessibility Model, Accessibility Map, Plant Habitat Sensitivity Model, Plant Habitat Sensitivity Map, Watershed Sensitivity Model, Watershed Sensitivity Map |
| Lyell Glacier, Yosemite National Park | Lyell Glacier |
| Map Hurricane Storm Surge, New York City | Base Elevation Map, 3-Meter Storm Surge Map, Hurricane Sandy Inundation Map (2012), 9-Meter Storm Surge Map, Overlay of 3-meter and 9-meter Storm Surge Maps |
| Marin Smoke Detectors | Marin Forested Areas, Smoke Detector Adoption |
| Massachusetts Parks | Massachusetts Parks |
| Midpeninsula Regional Open Space District -- 50 Years of Land Acquisition and Preservation | MROSD Land Acquisition and Preservation |
| Midpeninsula Regional Open Space District Map Series | Imagery Basemap, Elevation Basemap, Vector Basemap, Proportional Symbol Map, Choropleth Map, Thematic Map, Multivariate Map, Isopleth Map and Chart |
| Mountain Lion Corridors, Los Angeles, CA | Study Area, Core Mountain Lion Habitat, Elevation, Ruggedness, Ruggedness Cost Surface, Land Cover, Land Cover Cost Surface, Protected Status, Protected Status Cost Surface, Roads, Distance to Roads, Distance to Roads Cost Surface, Combined Cost Surface, Mountain Lion Paths, Mountain Lion Paths including Neighbors, Proposed Wildlife Corridors, Highways, Potential Wildlife Crossing, ModelBuilder Workflow |
| Places to See in Washington D.C. Web Experience | Places to See in Washington D.C. |
| Portland 2D and 3D Experience | Portland 2D and 3d Views |
| Portland Economic Vulnerability | Portland Economic Vulnerability Map |
| Portland Schools | Portland Schools Map |
| Public Works Department Assets, City of Santa Cruz | Street Signs, Street Sign Poles, and Street Lights |
| Puget Sound Traffic Violations | Puget Sound Traffic Violations Hotspots |
| River Otter Sightings | River Otter Sightings |
| Sacramento 911 Fire Calls Dashboard | Sacramento 911 Calls |
| San Jose from Space | San Jose from Space |
| Sanitation Drawing Index Map, Santa Cruz County | Sanitation Drawing Index |
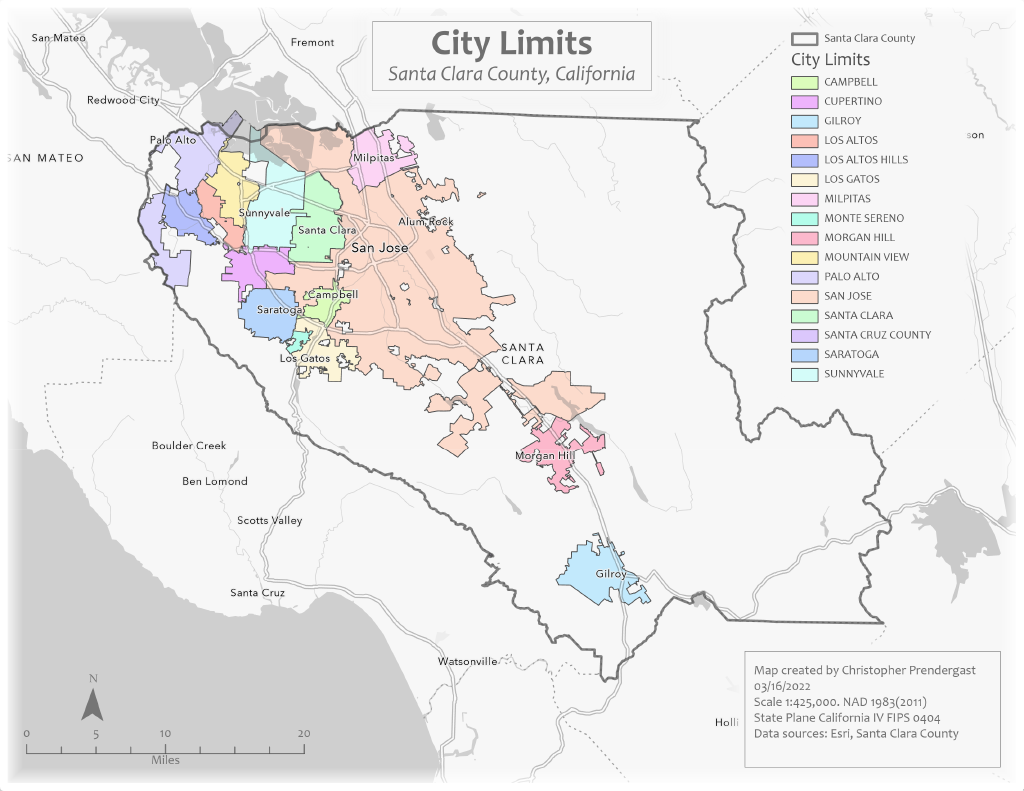
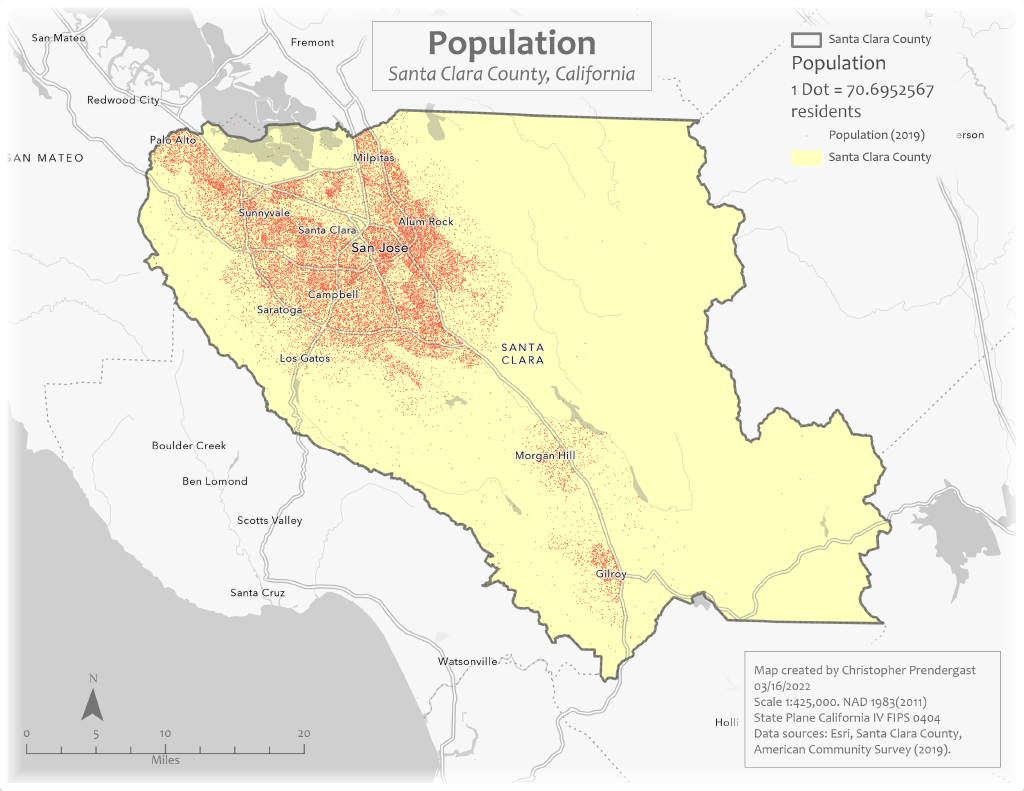
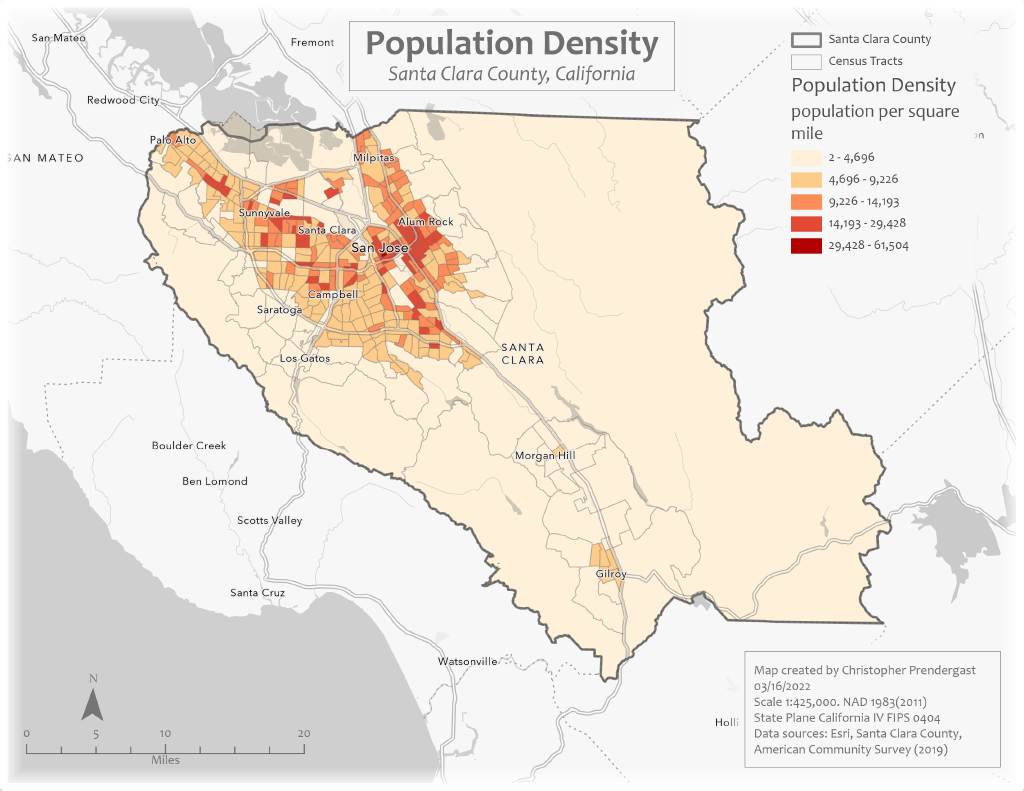
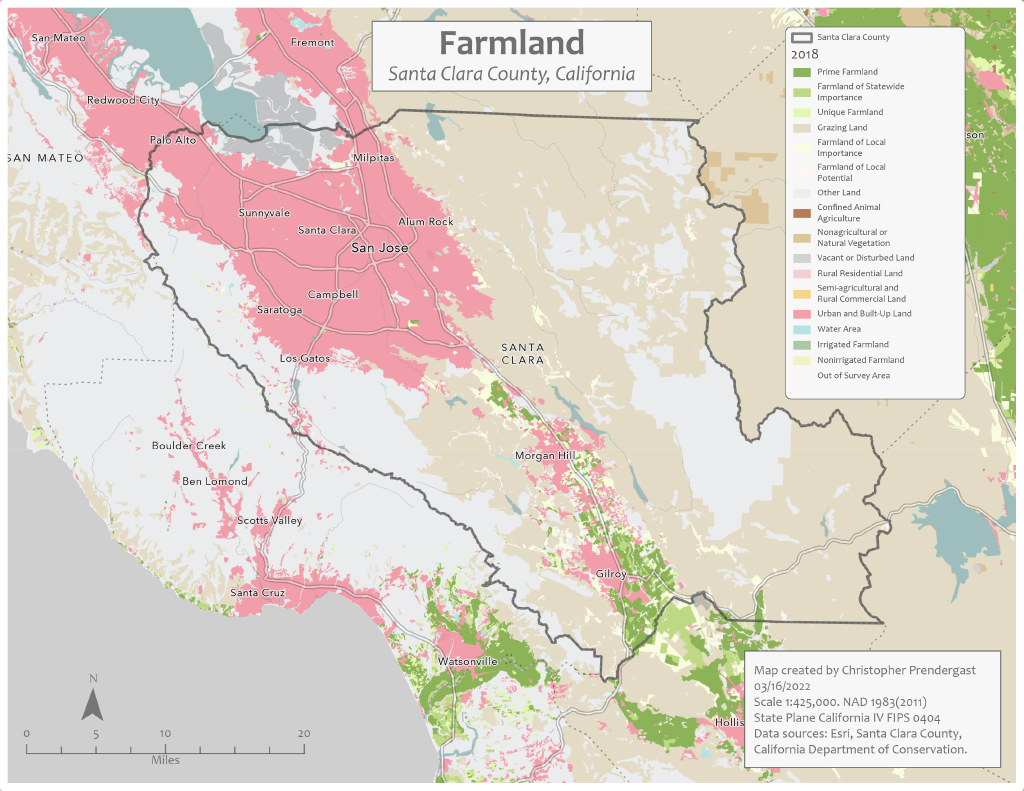
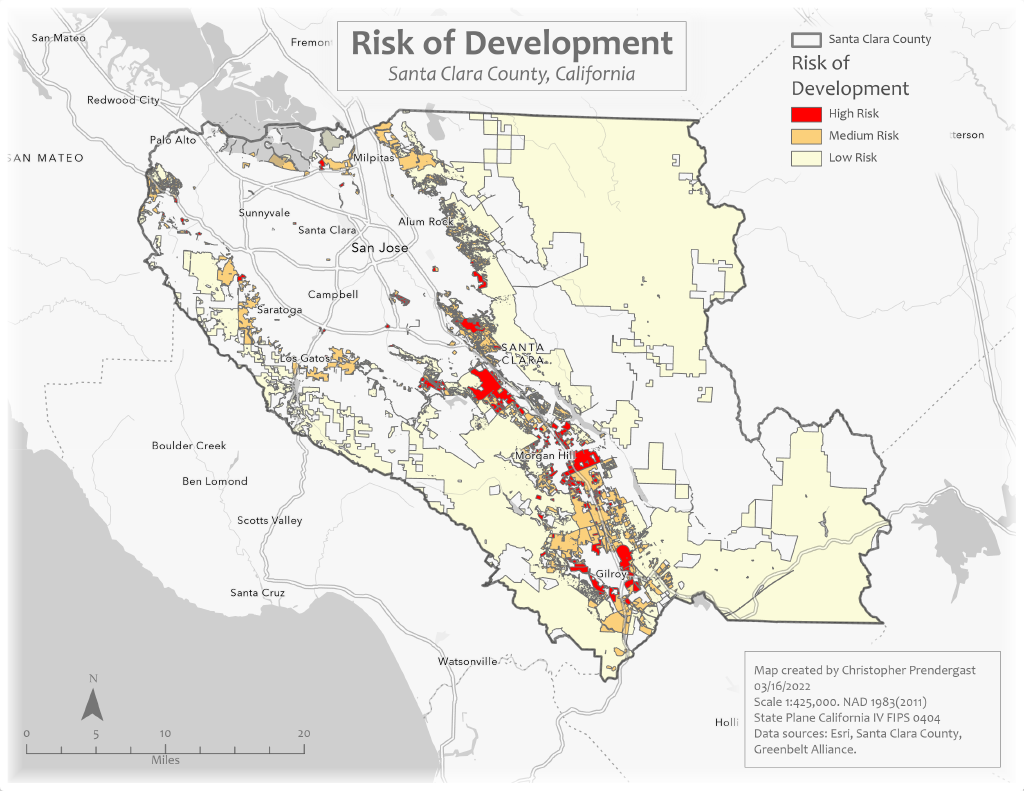
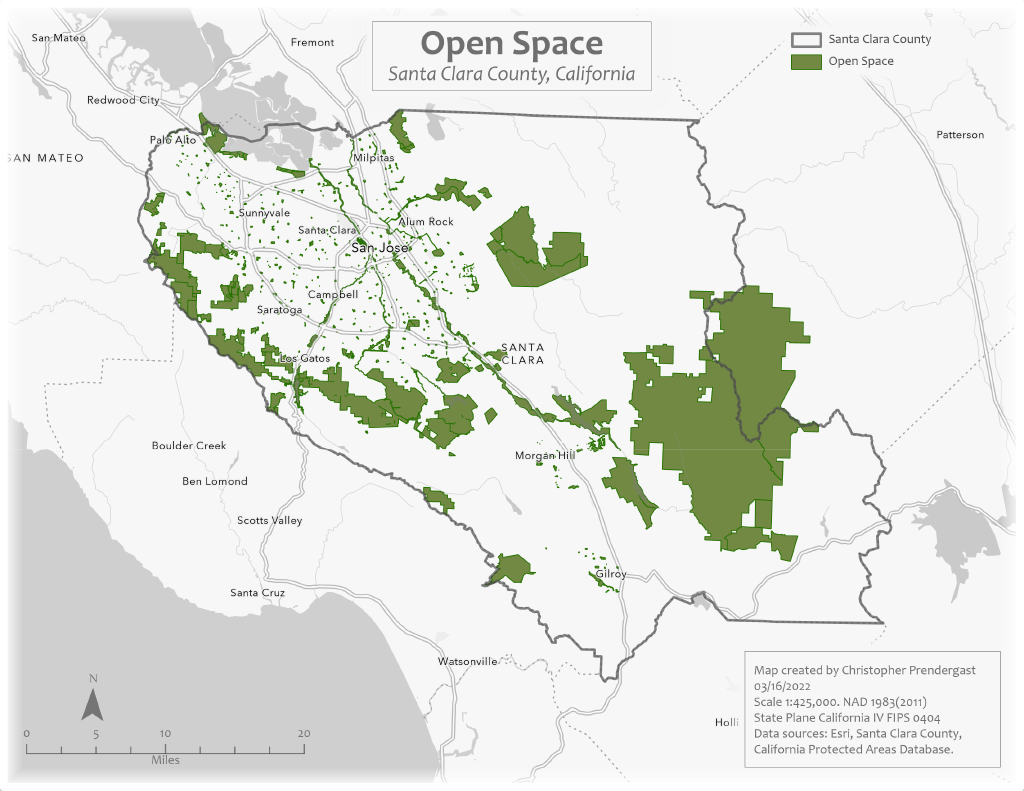
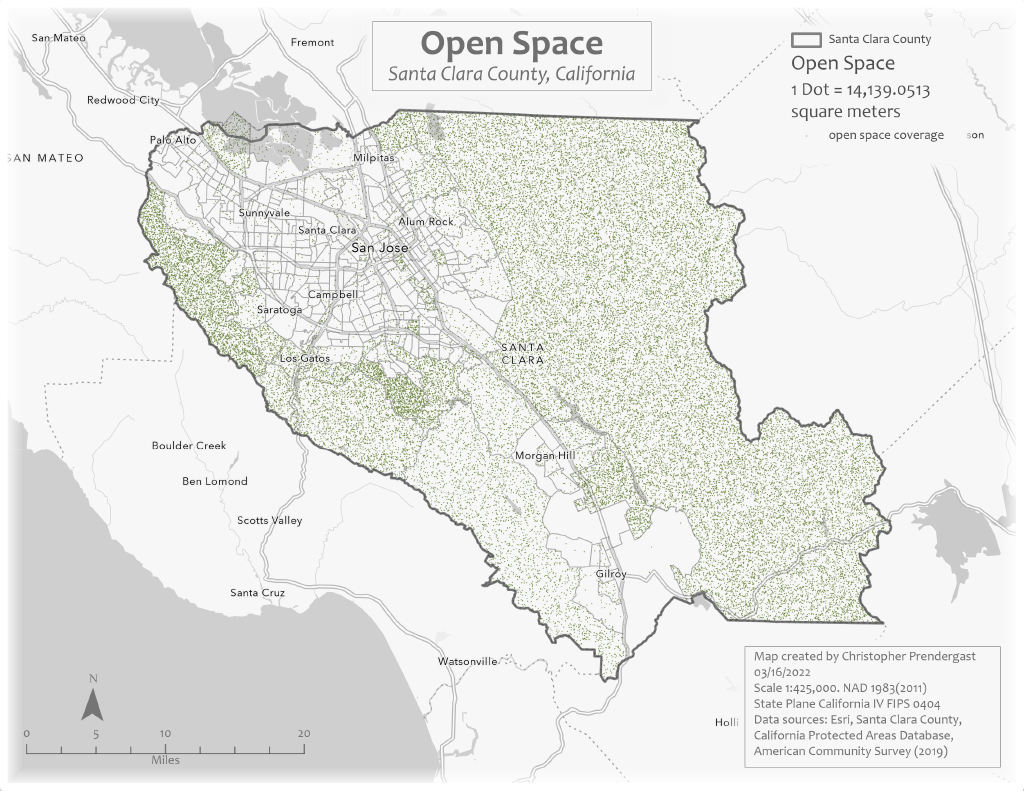
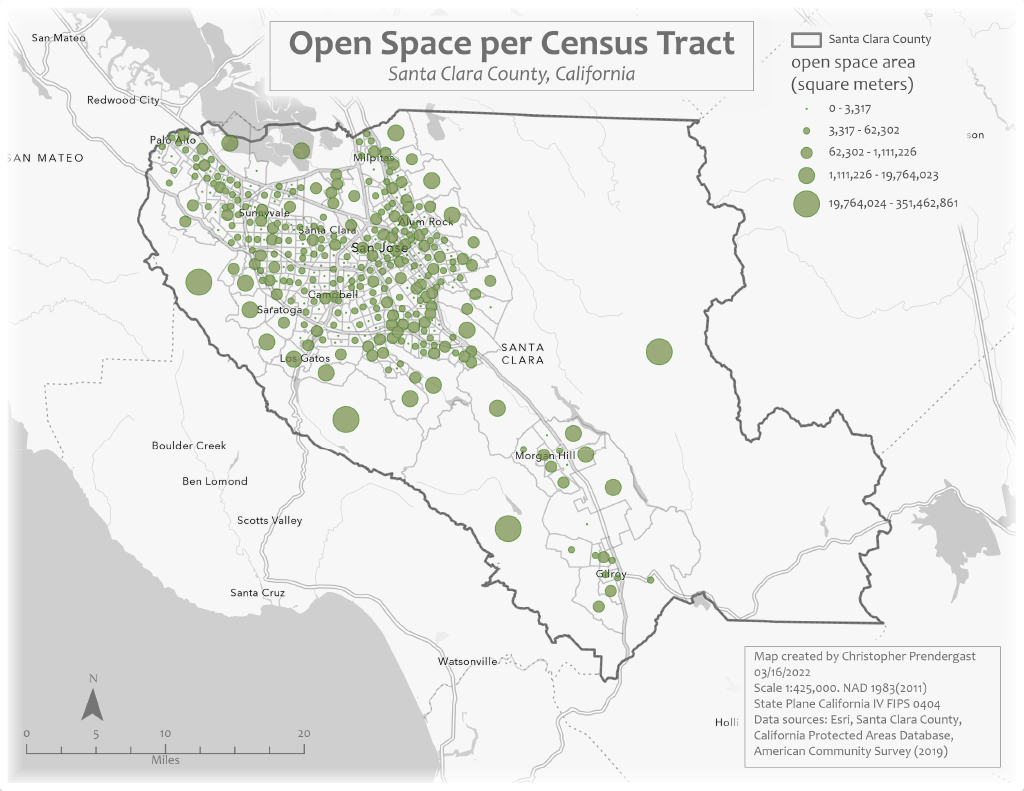
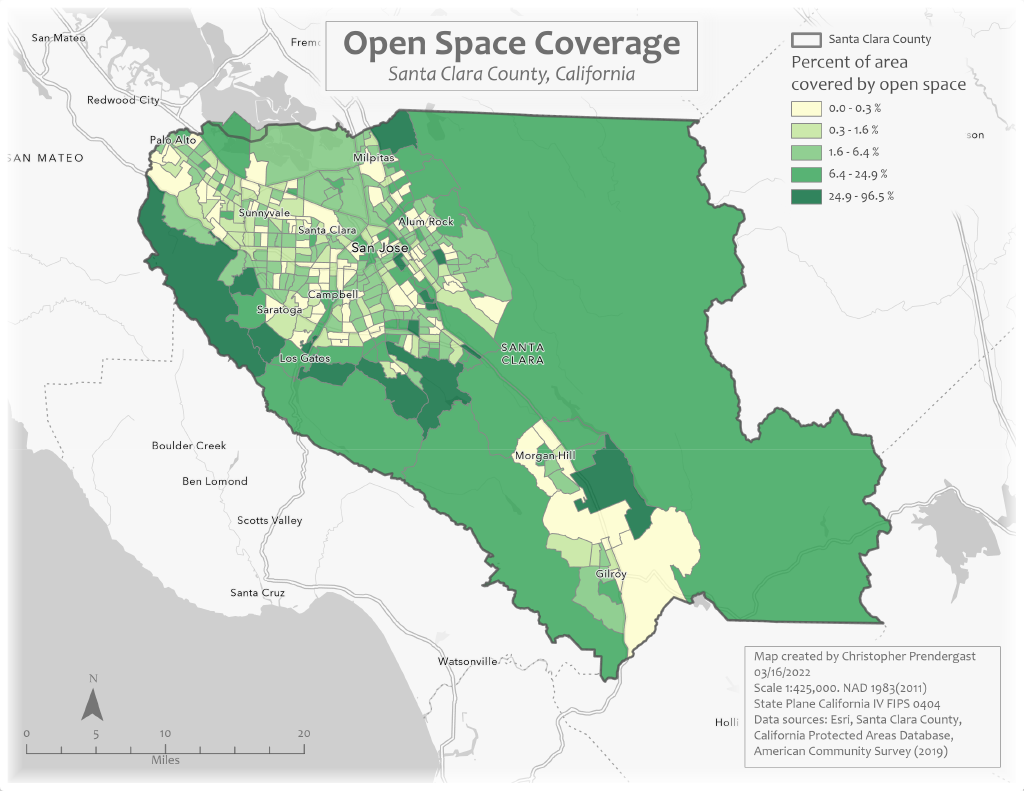
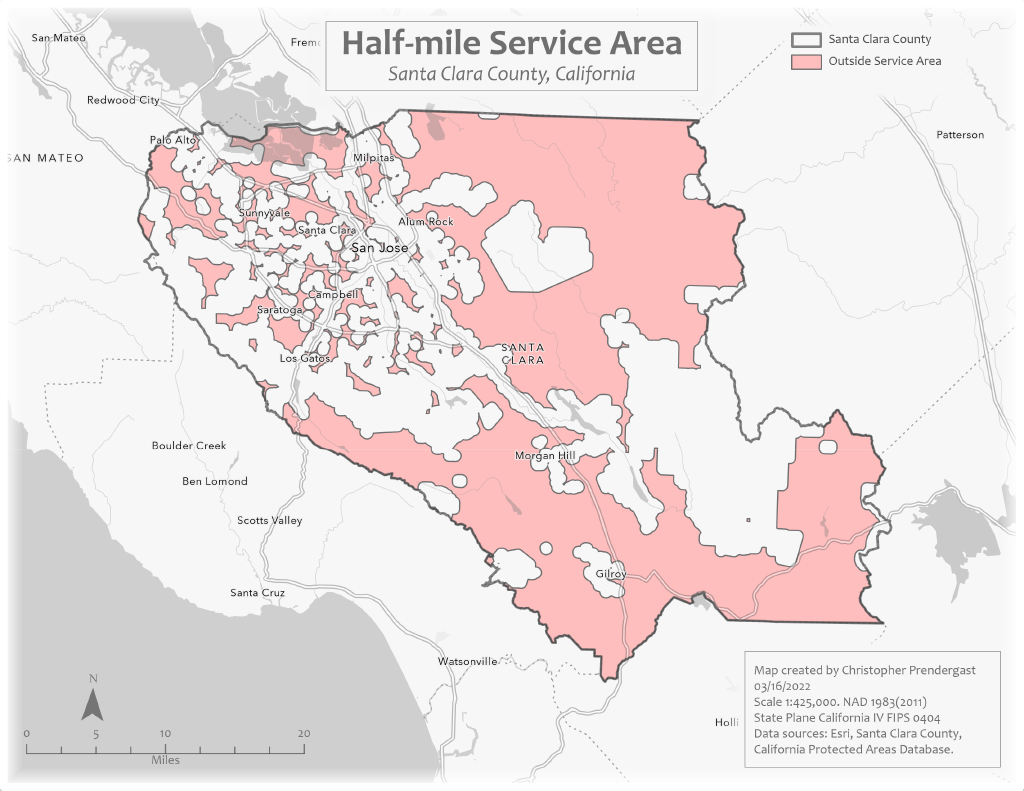
| Santa Clara Valley Open Space Story Maps | Urban Areas, City Limits, Population Density, Population, Farmland, Land at Risk of Development, Open Space Areas, Open Space Density, Open Space per Census Tract, Open Space Coverage, Open Space Area per Person, Distance to Closest Open Space, Average Distance to Open Space, Half-mile Service Areas |
| Spilhaus World Oceans Map | Spilhaus World Oceans Map |
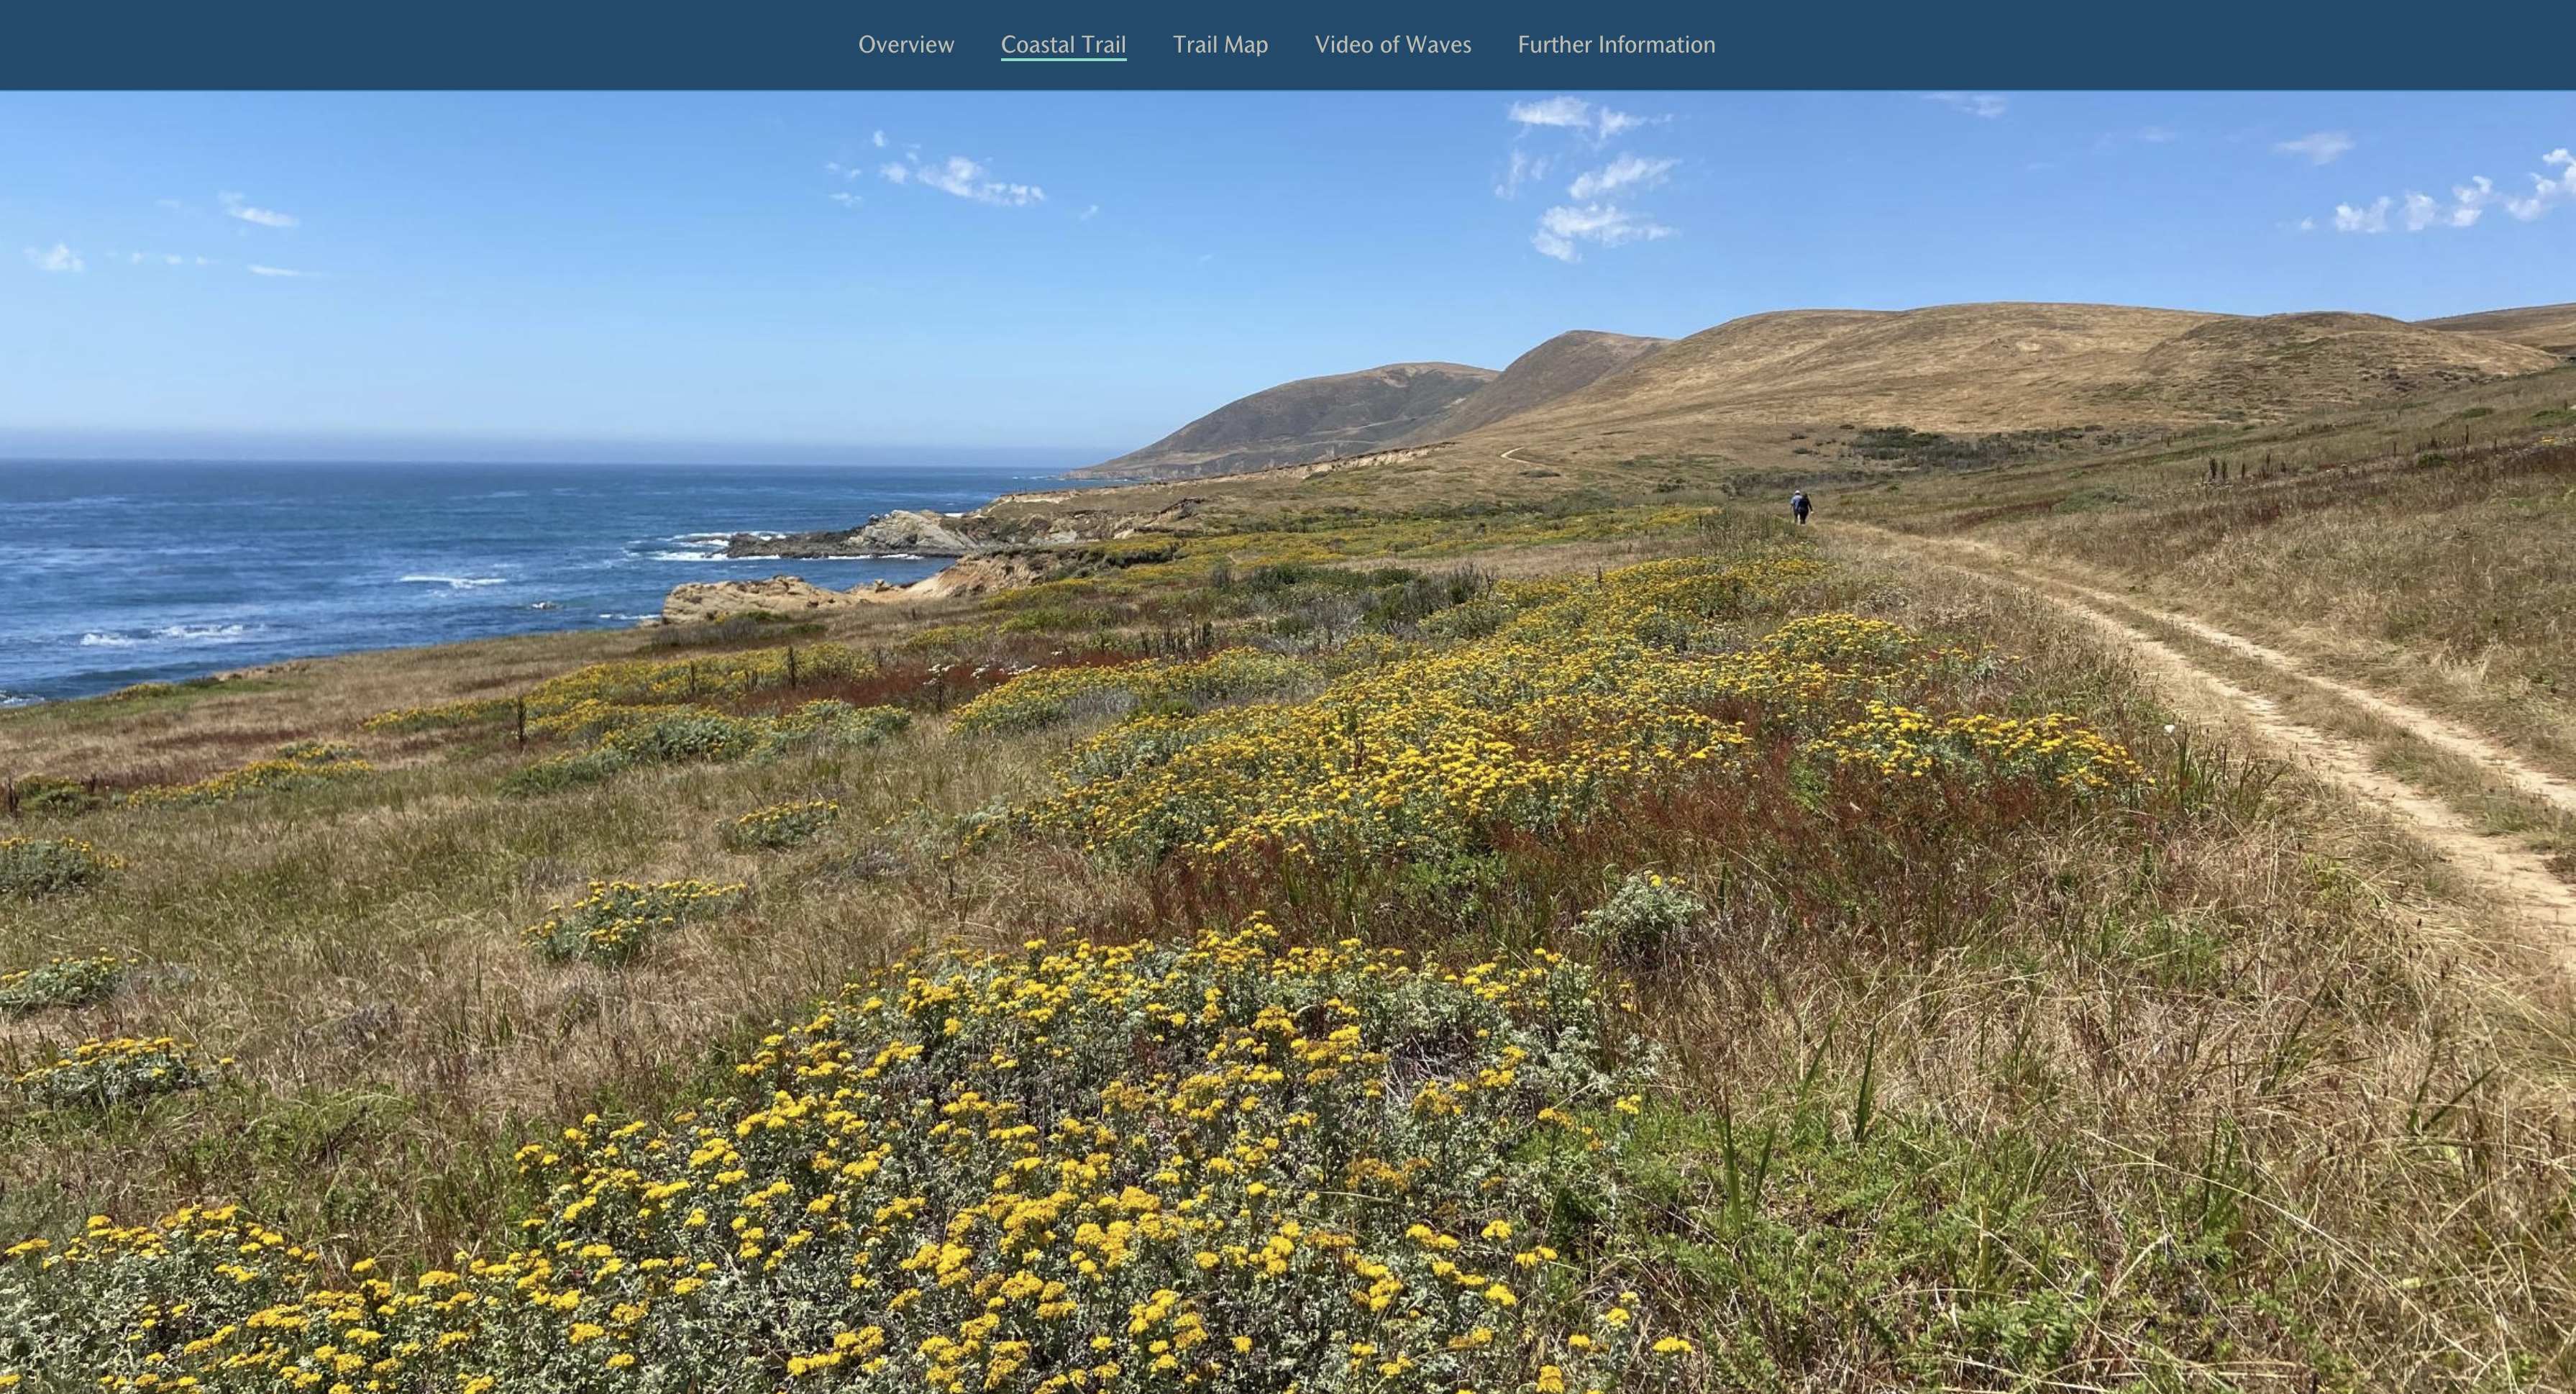
| StoryMap: Harmony Headlands | Harmony Headlands |
| Support for California Proposition 37 | California Proposition 37 |
| The impact of the housing shortage on oil workers | Introduction, Count of Homeless Population, Percentage Experiencing Homelessness, Percent Change in Unhoused Population, 2012–2013 |
| Voting Precincts, Santa Cruz County | Regular Precincts, Voting Precincts, Voting Precincts |
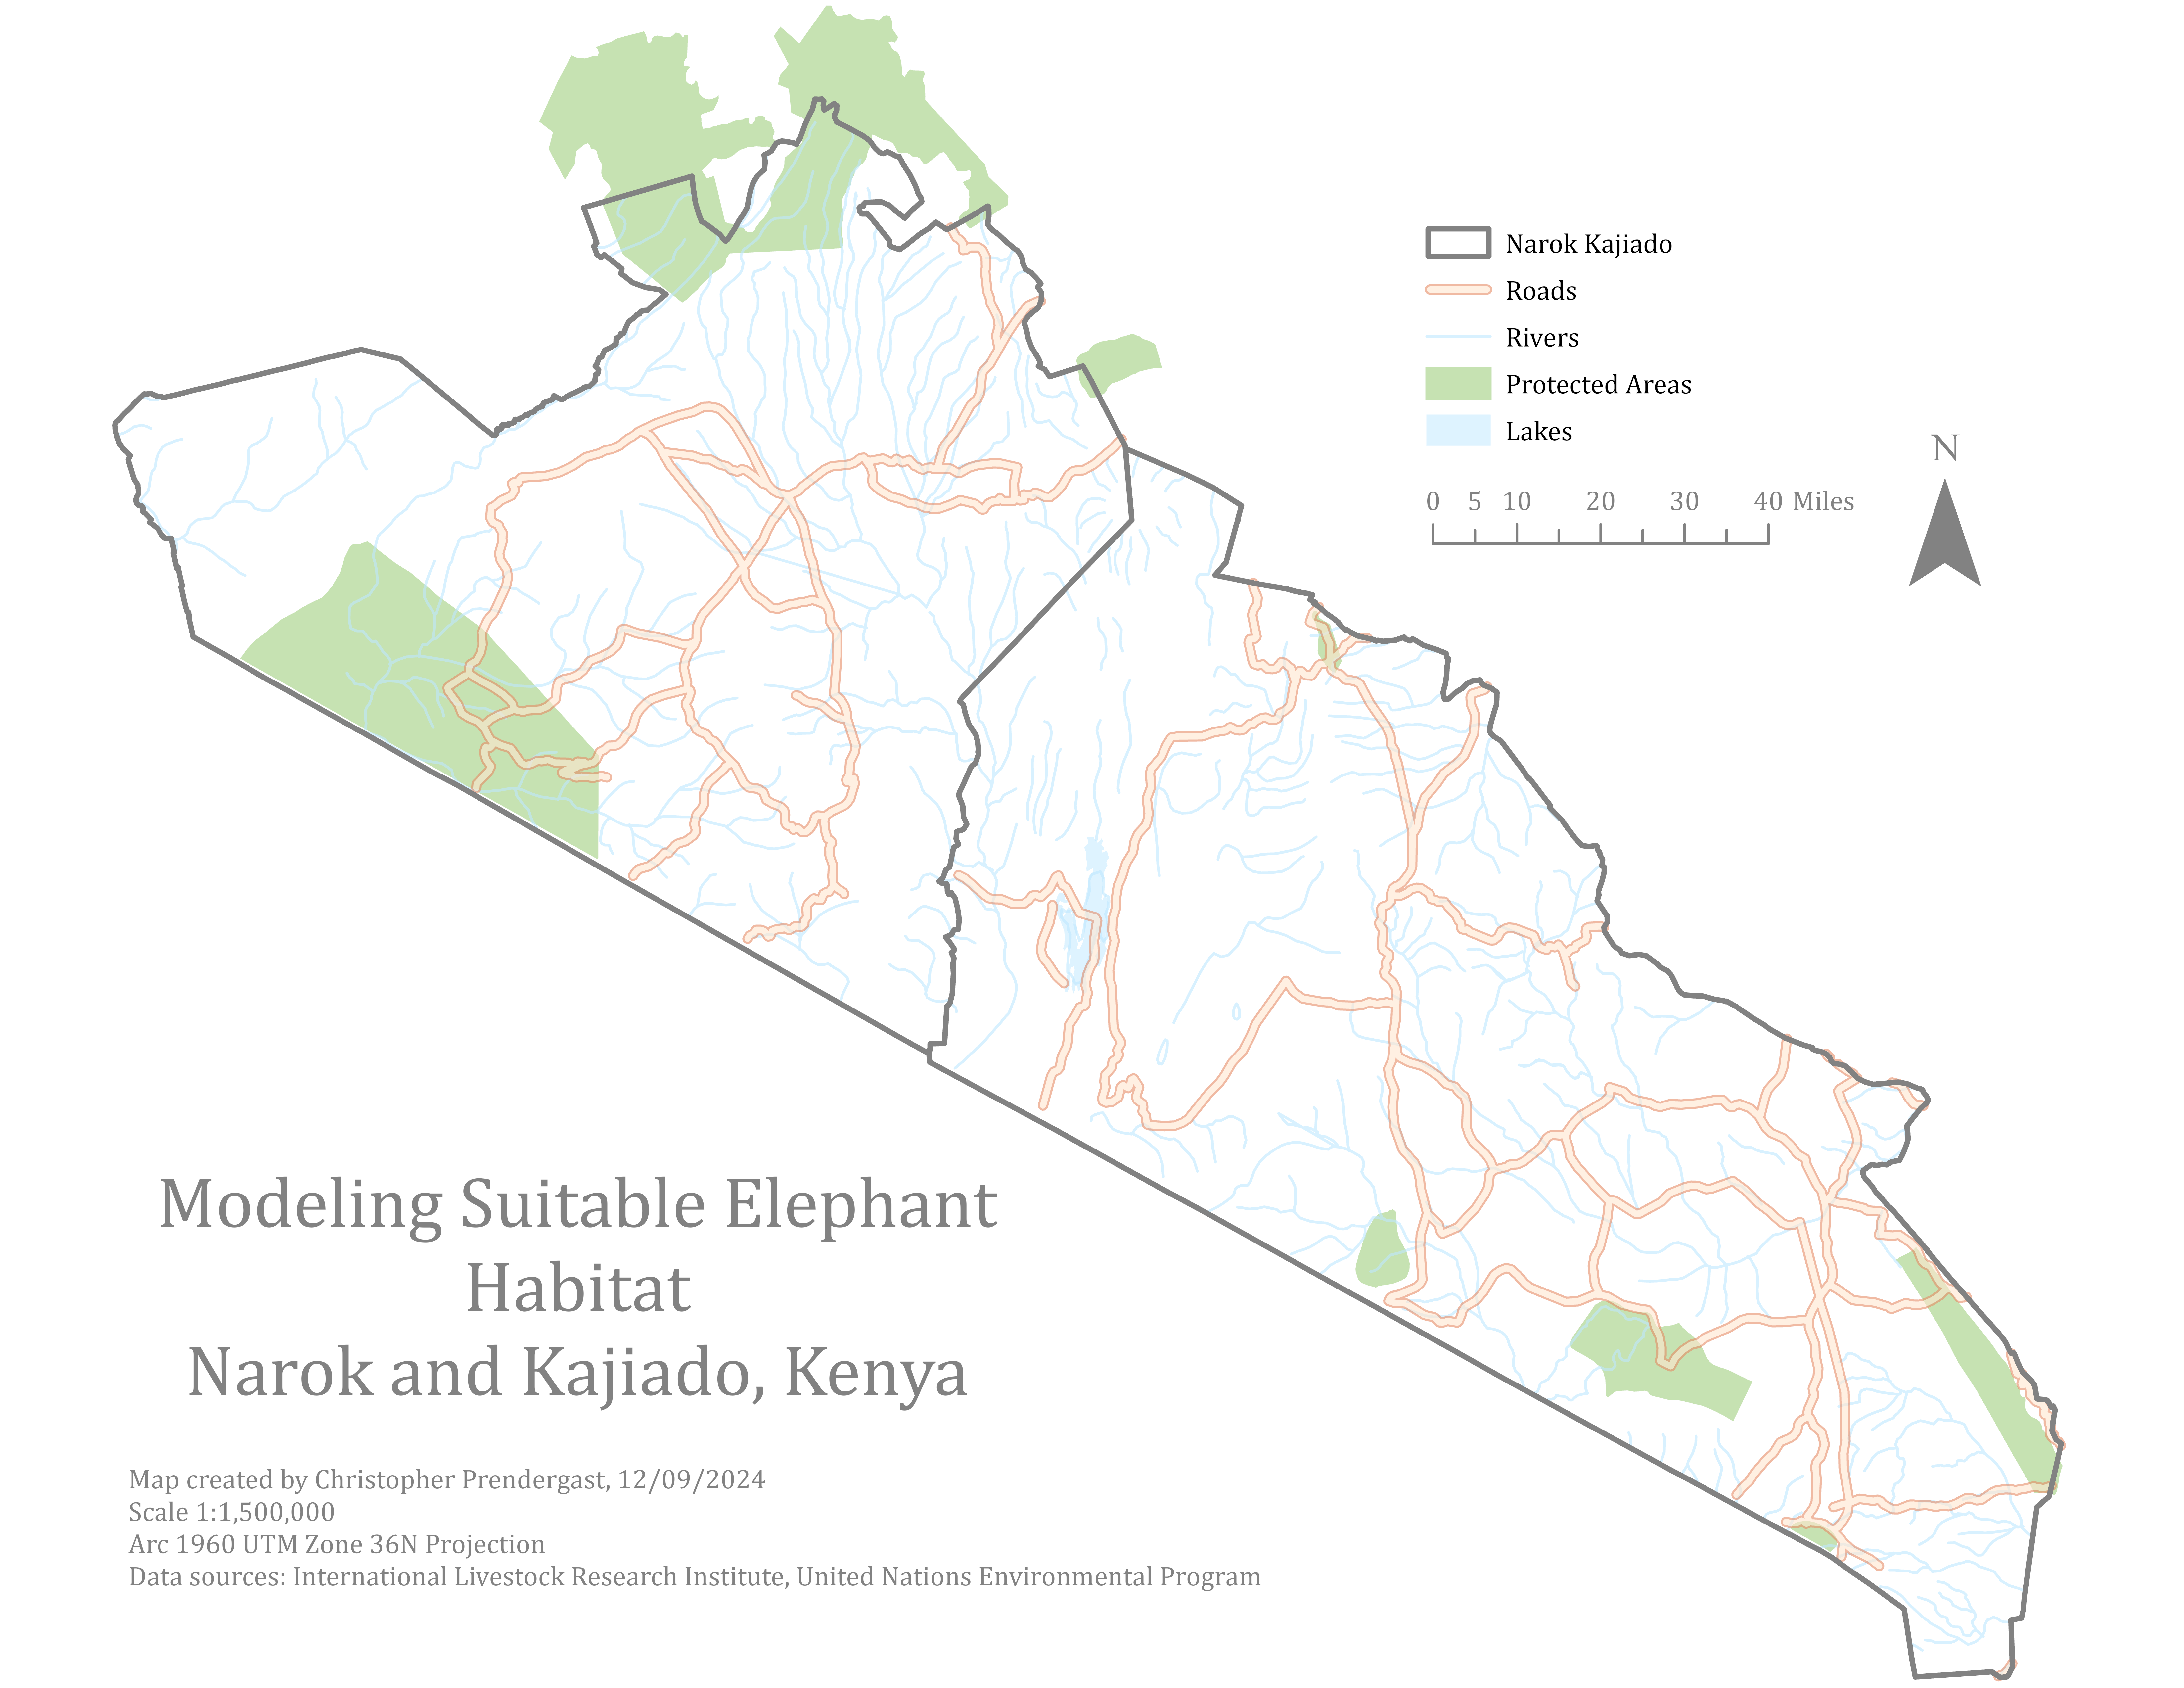
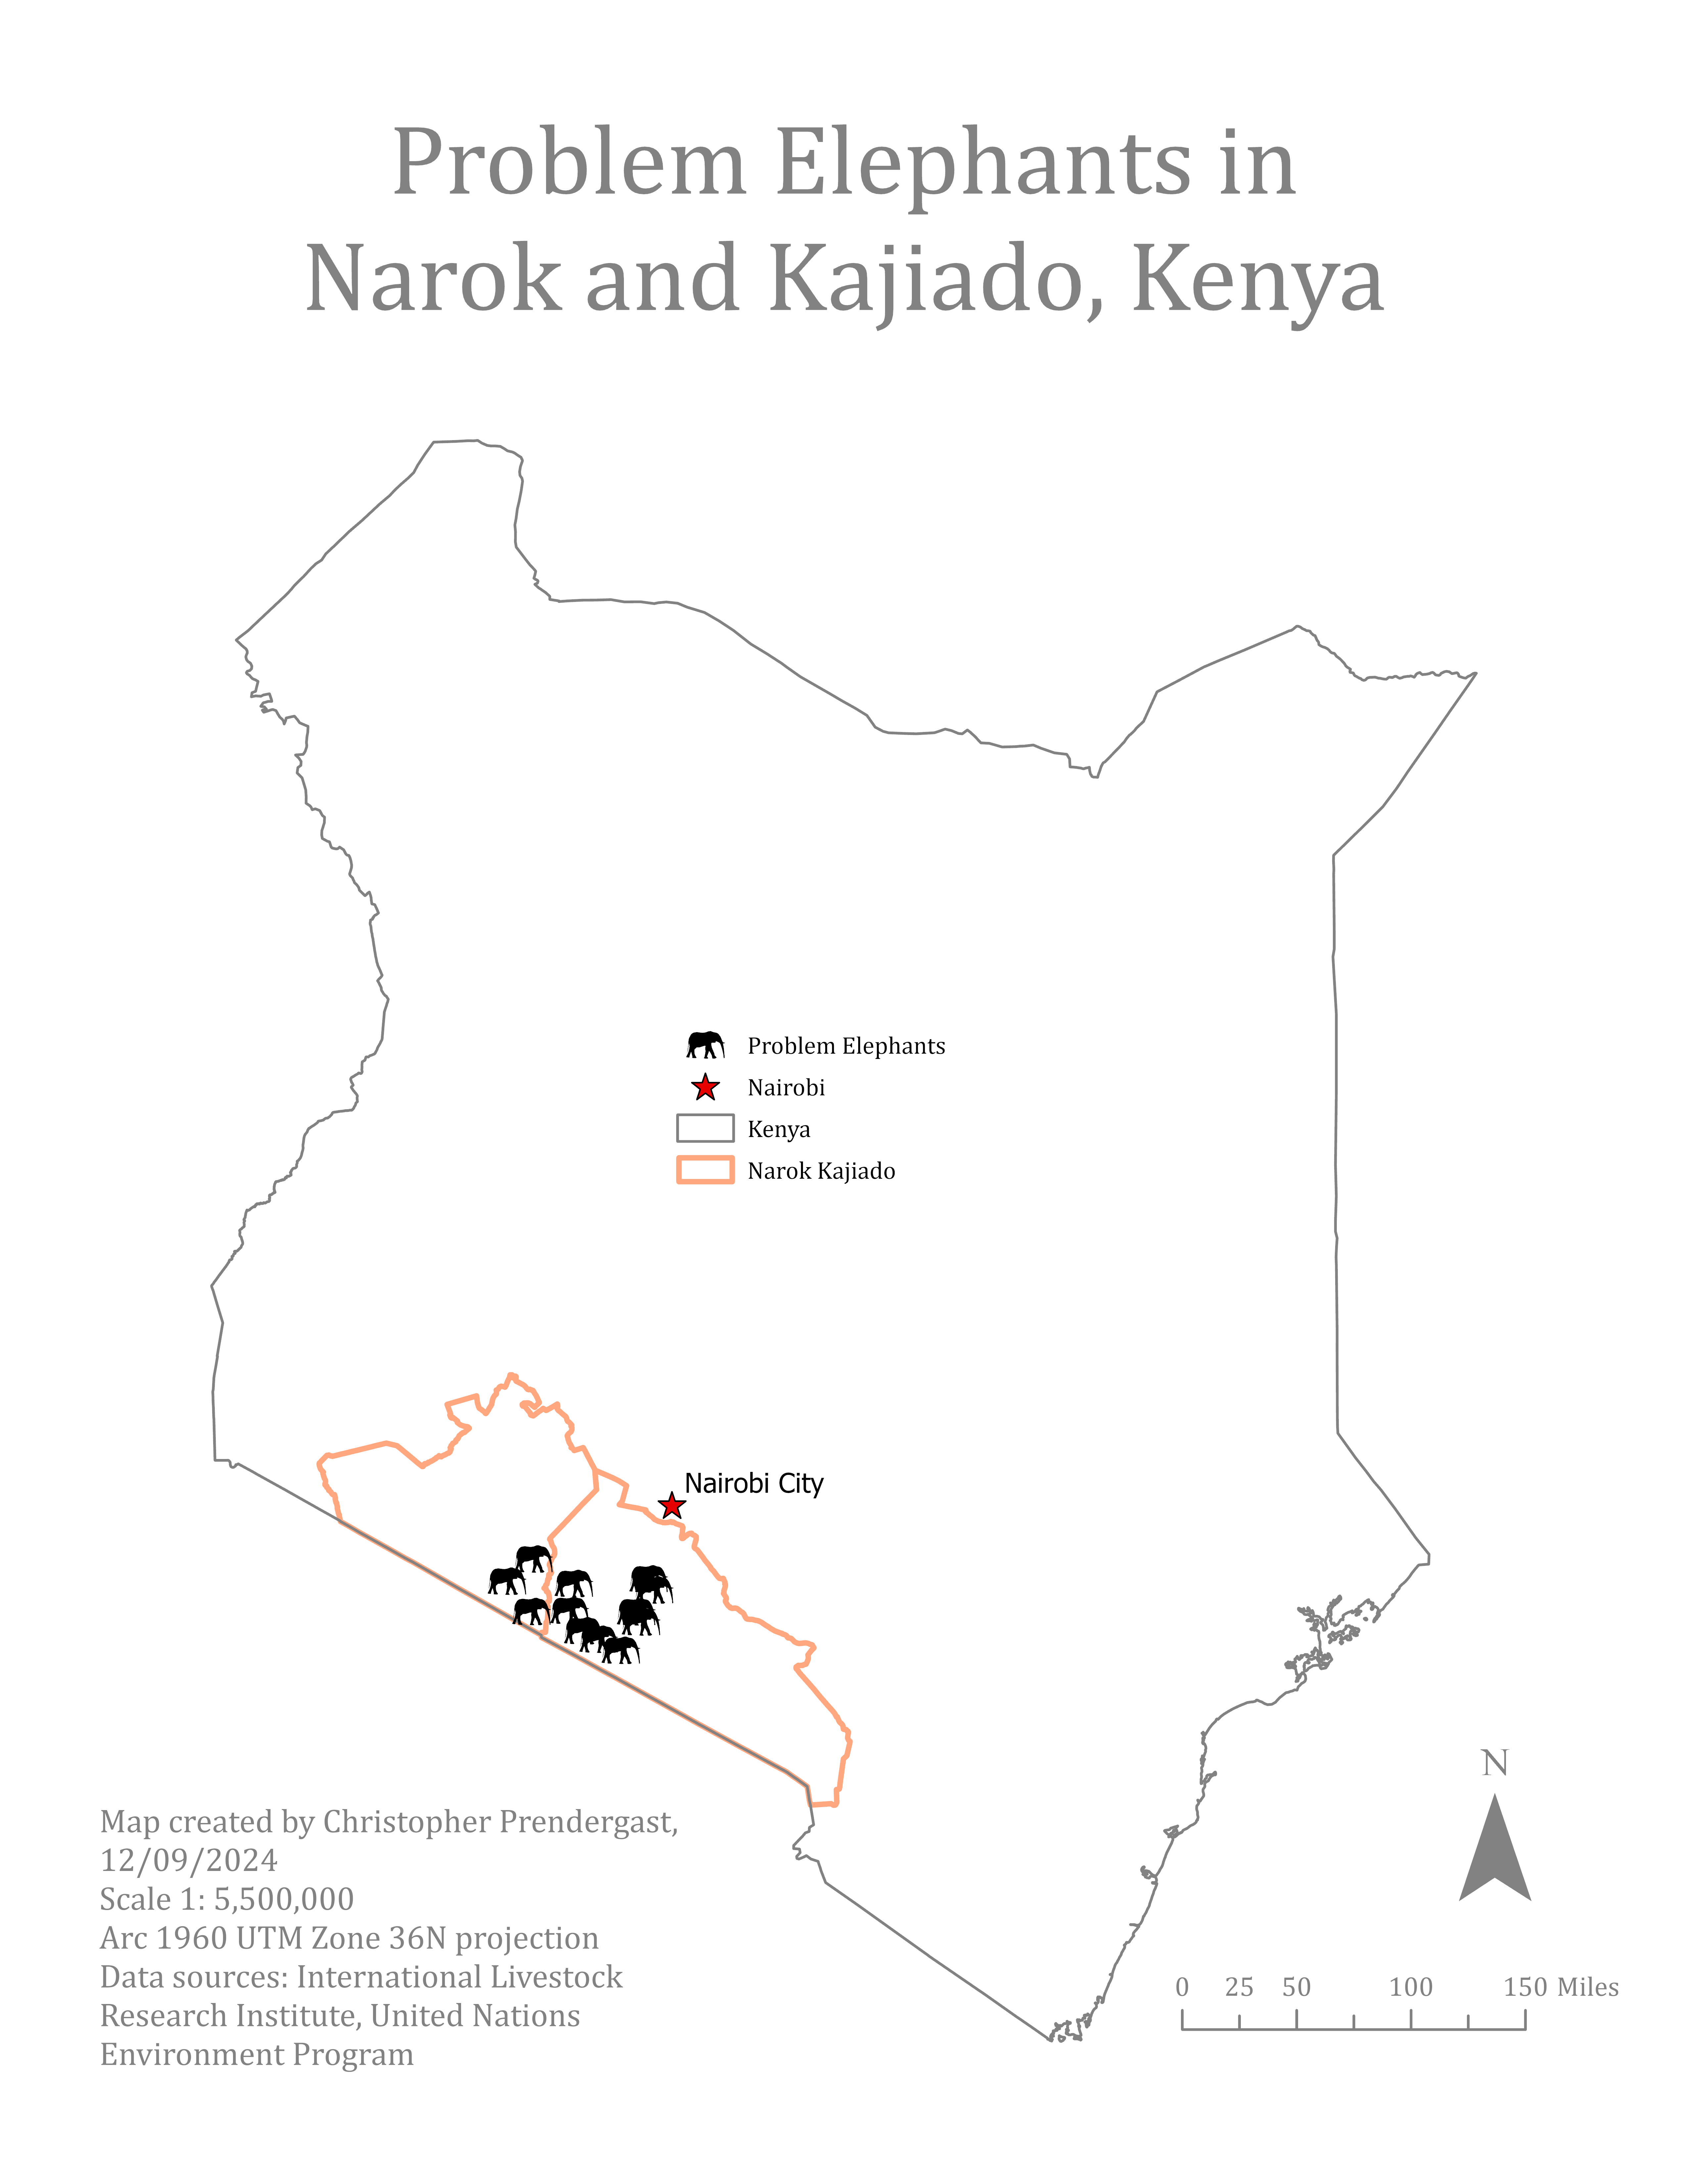
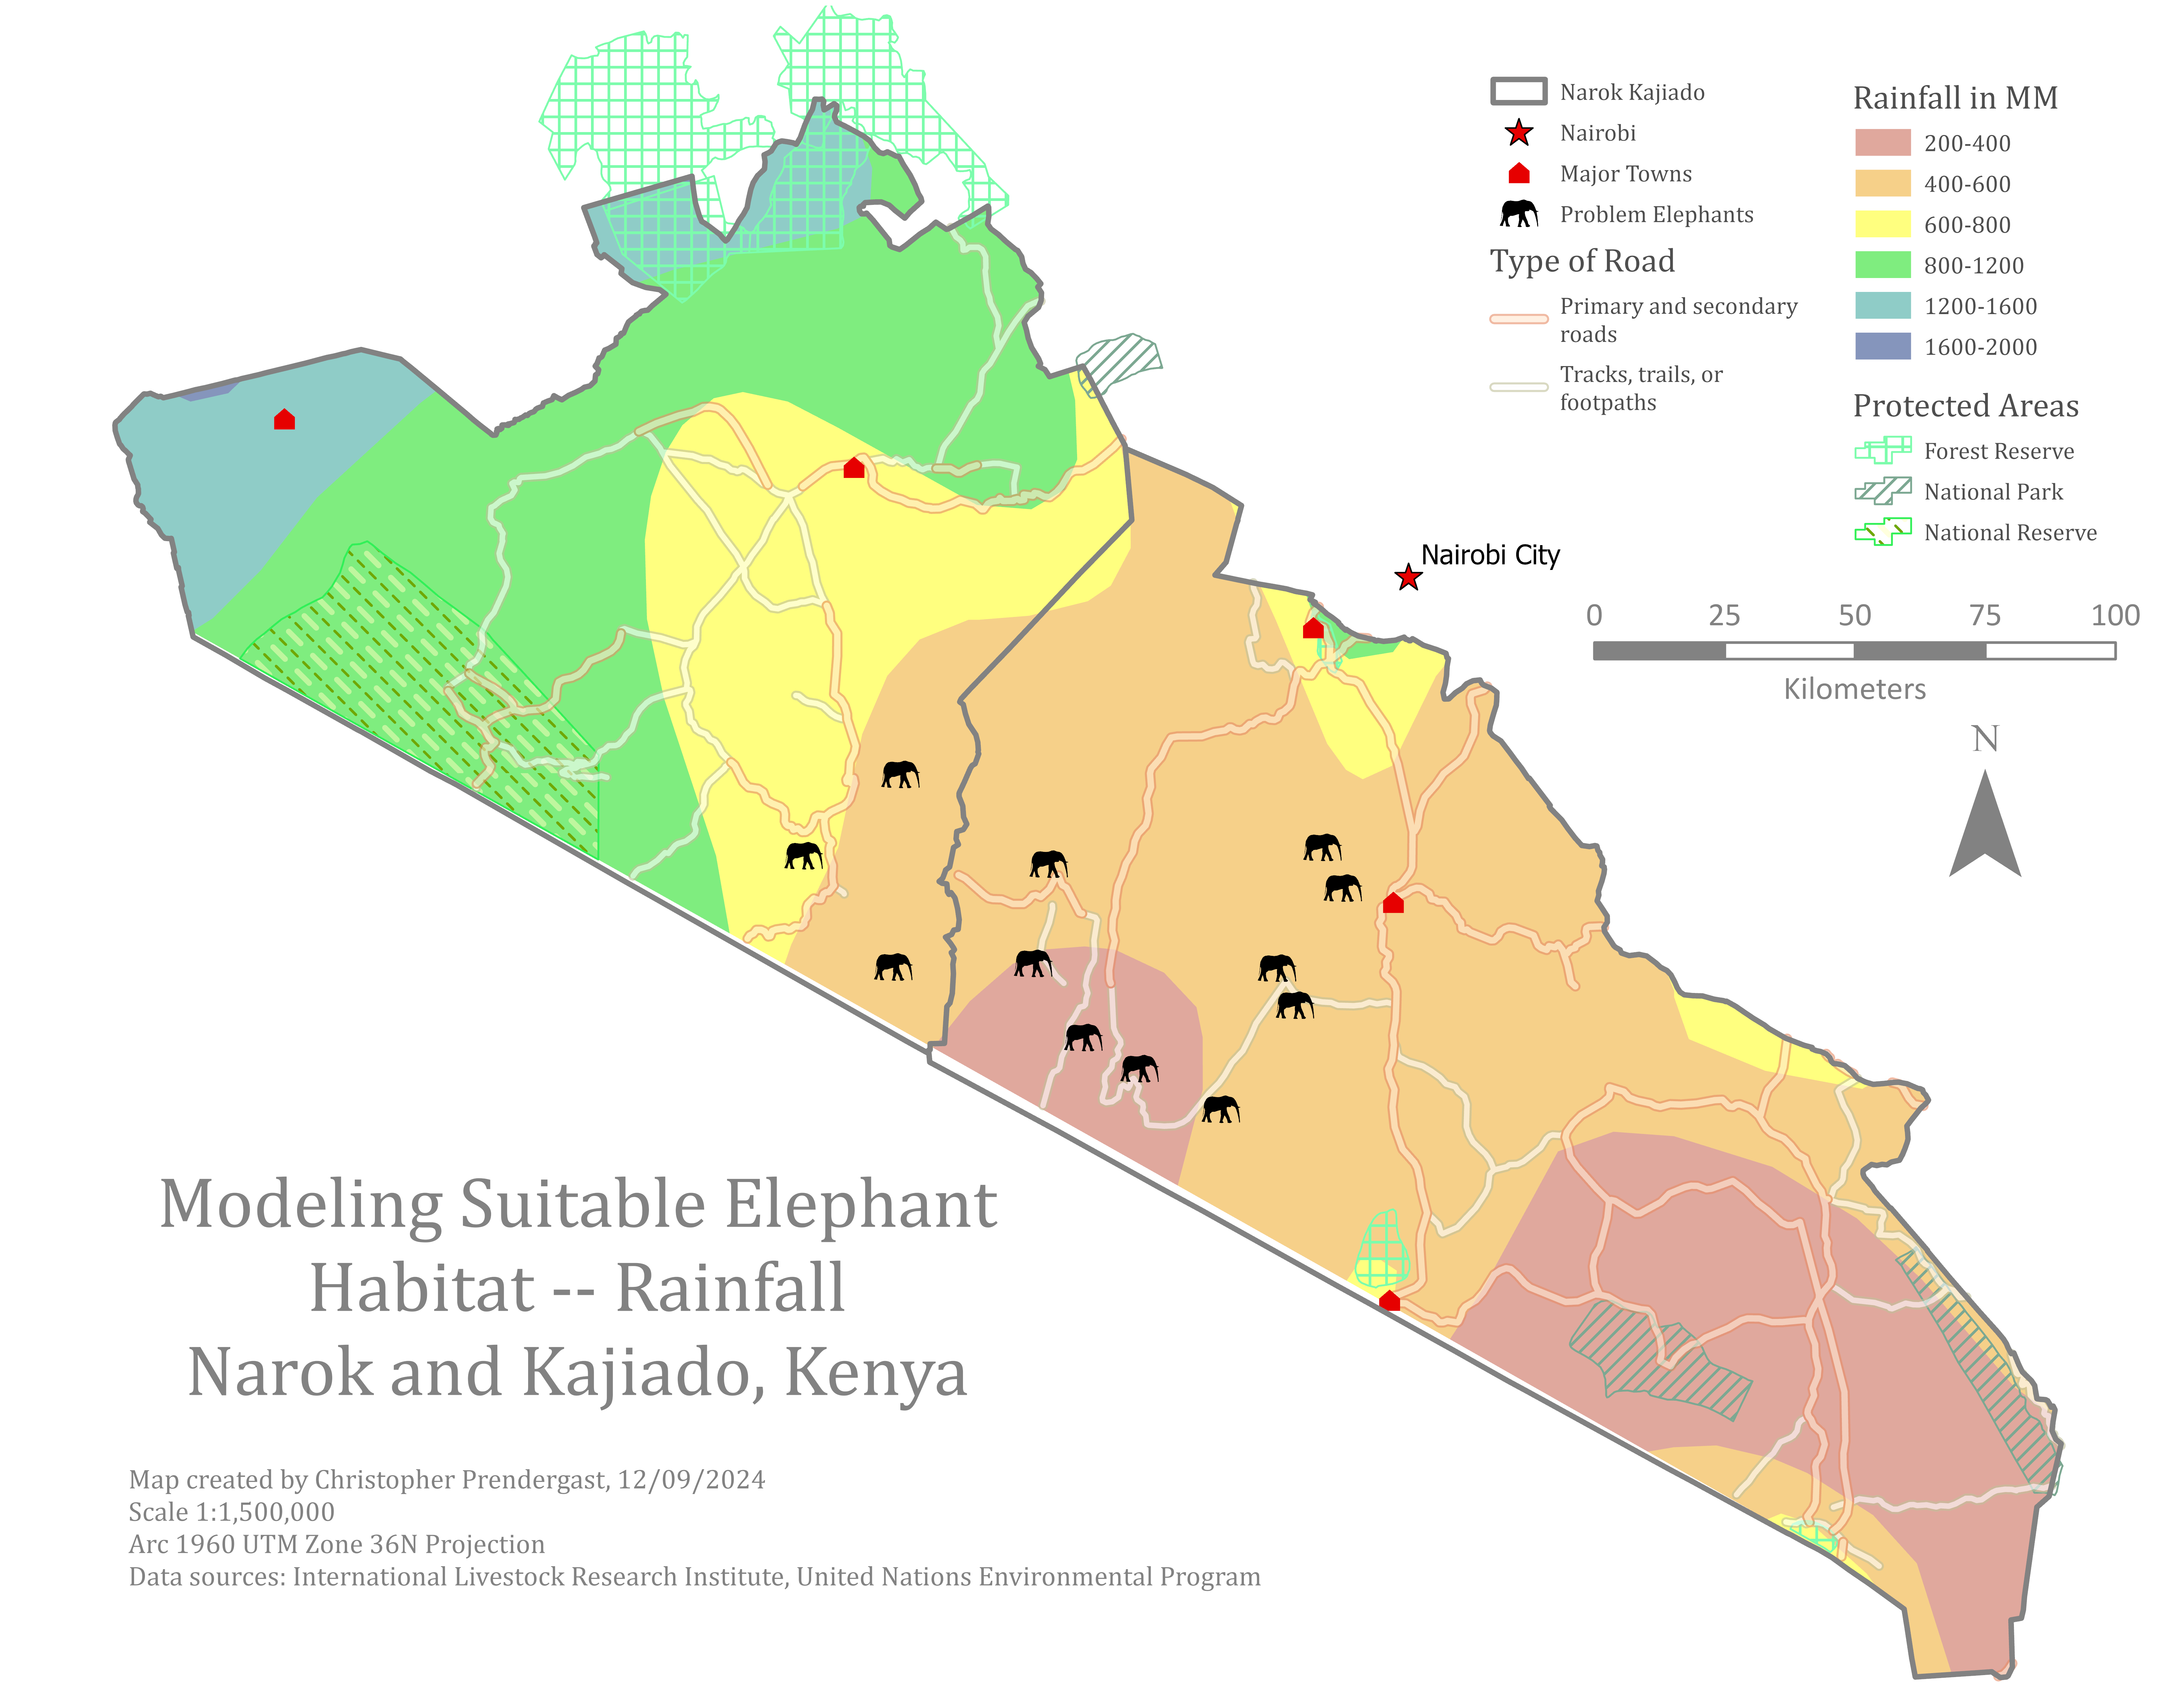
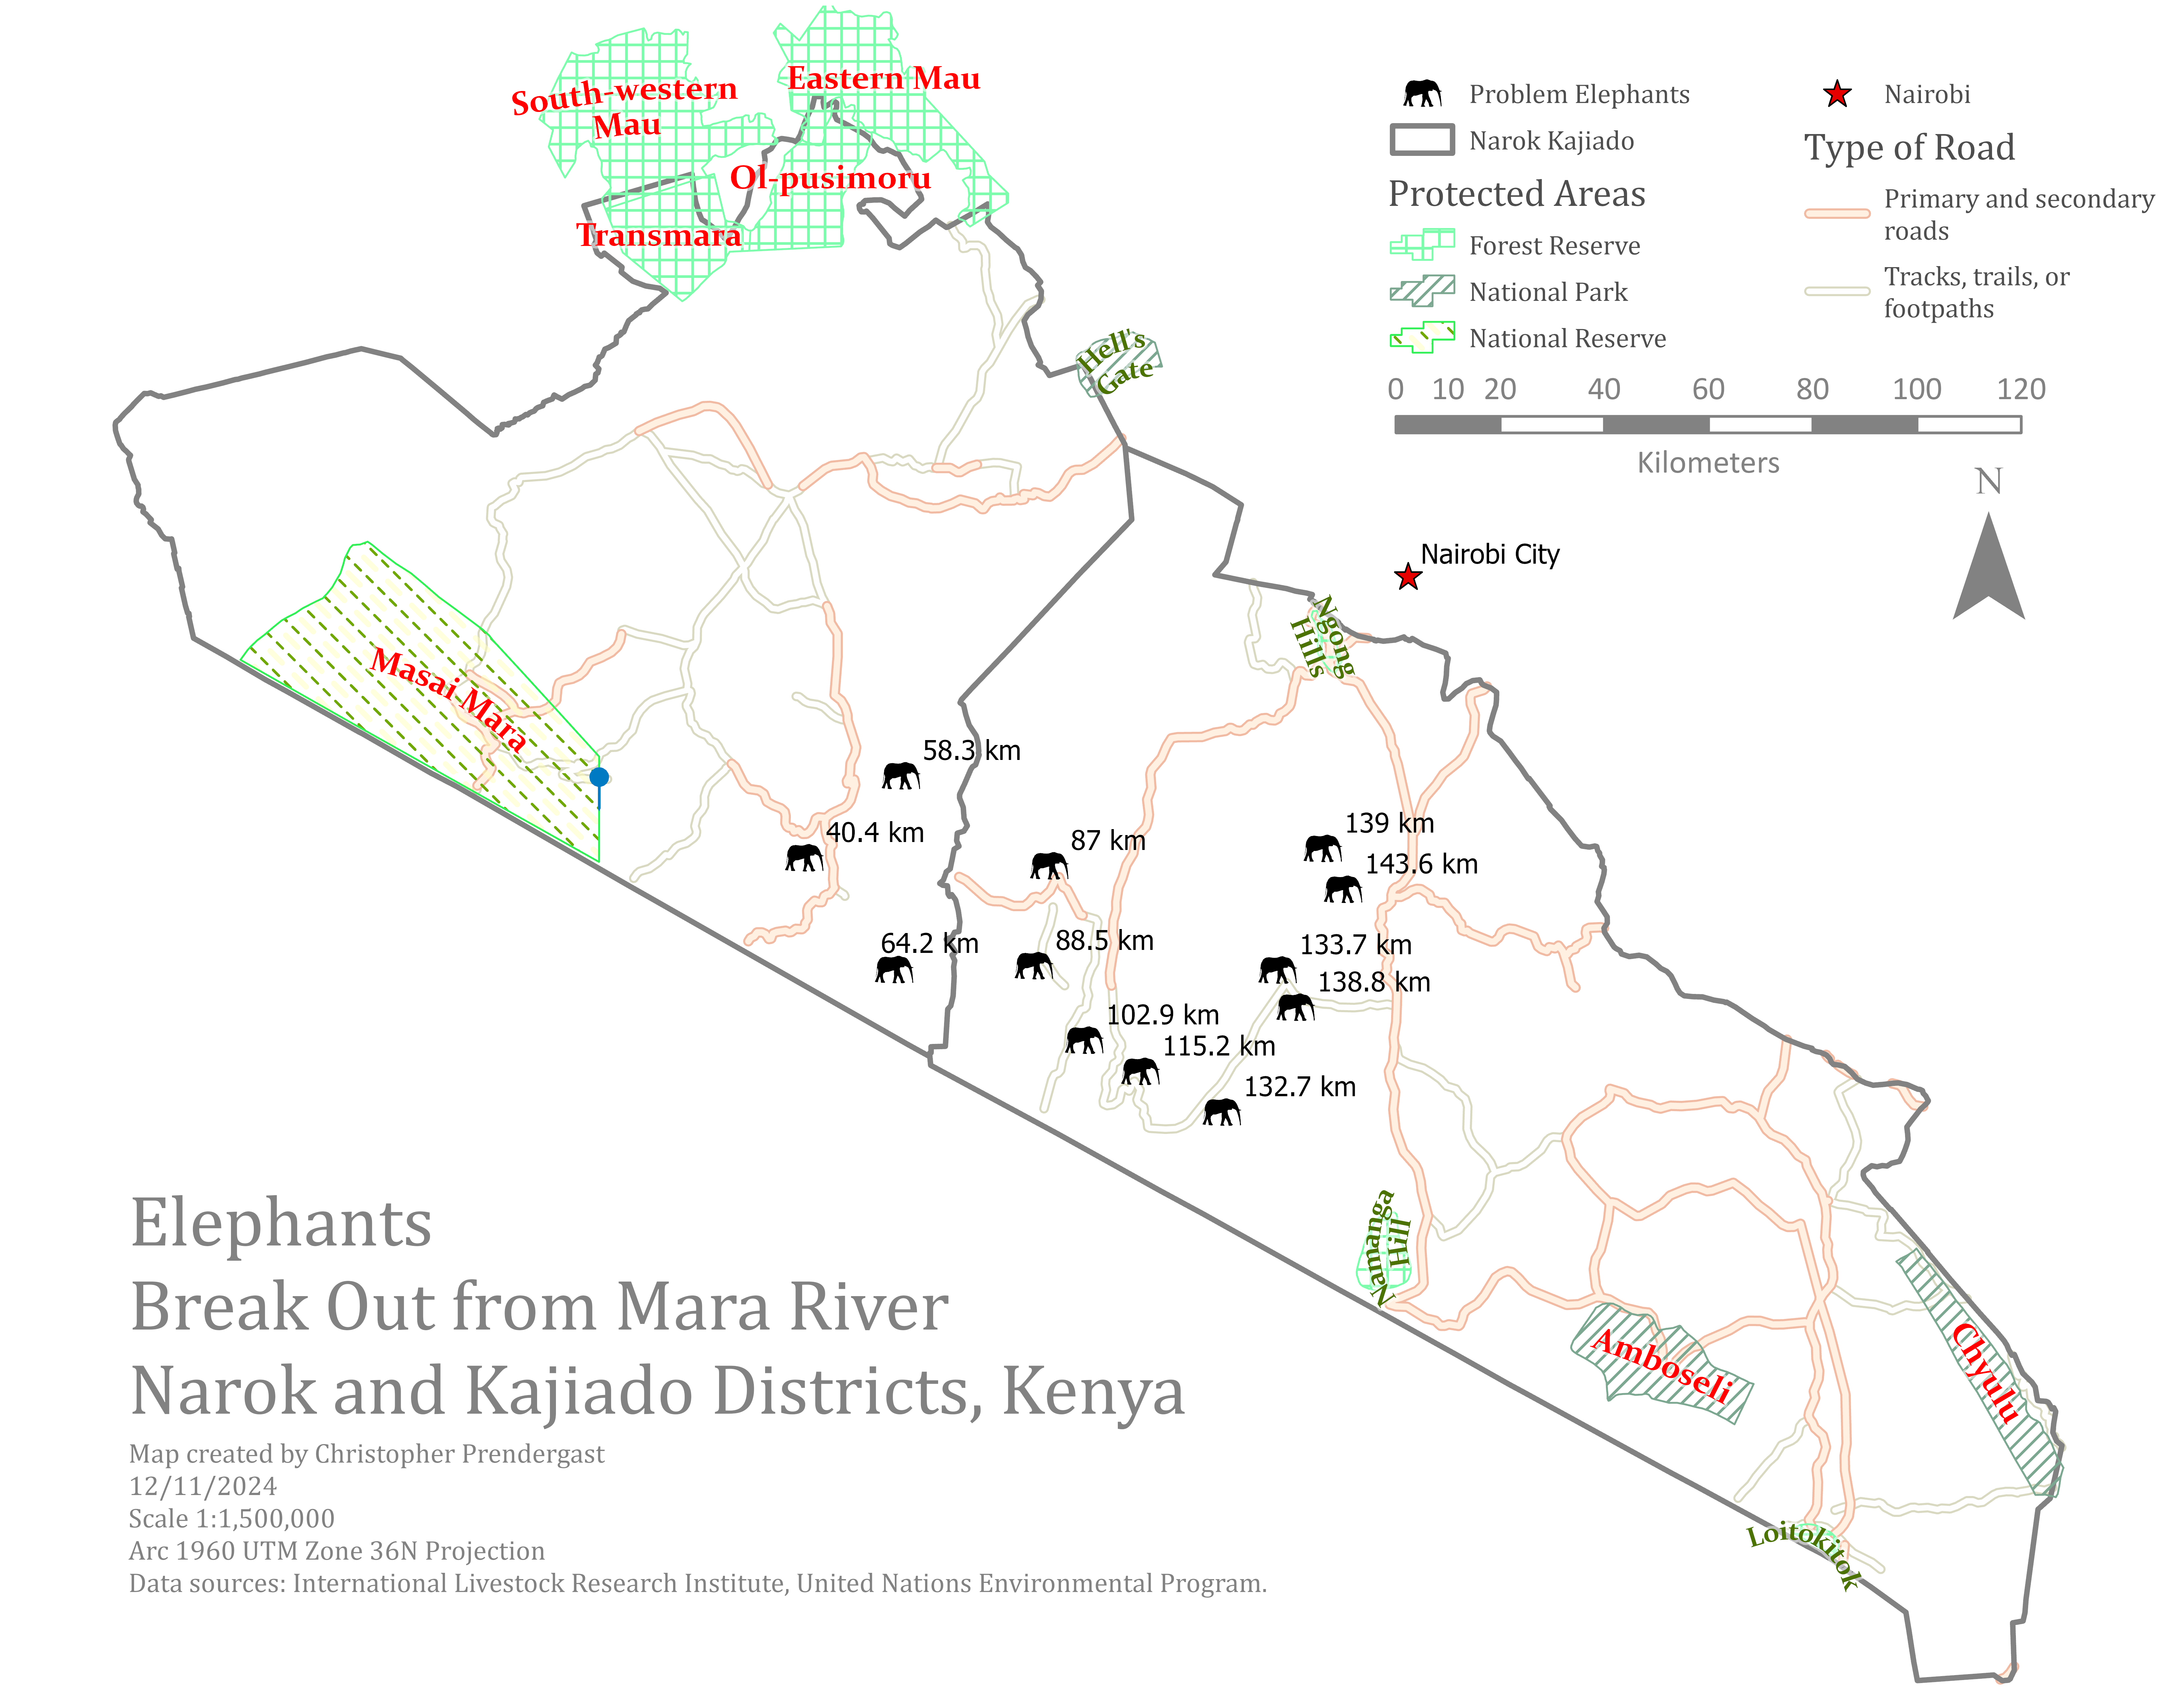
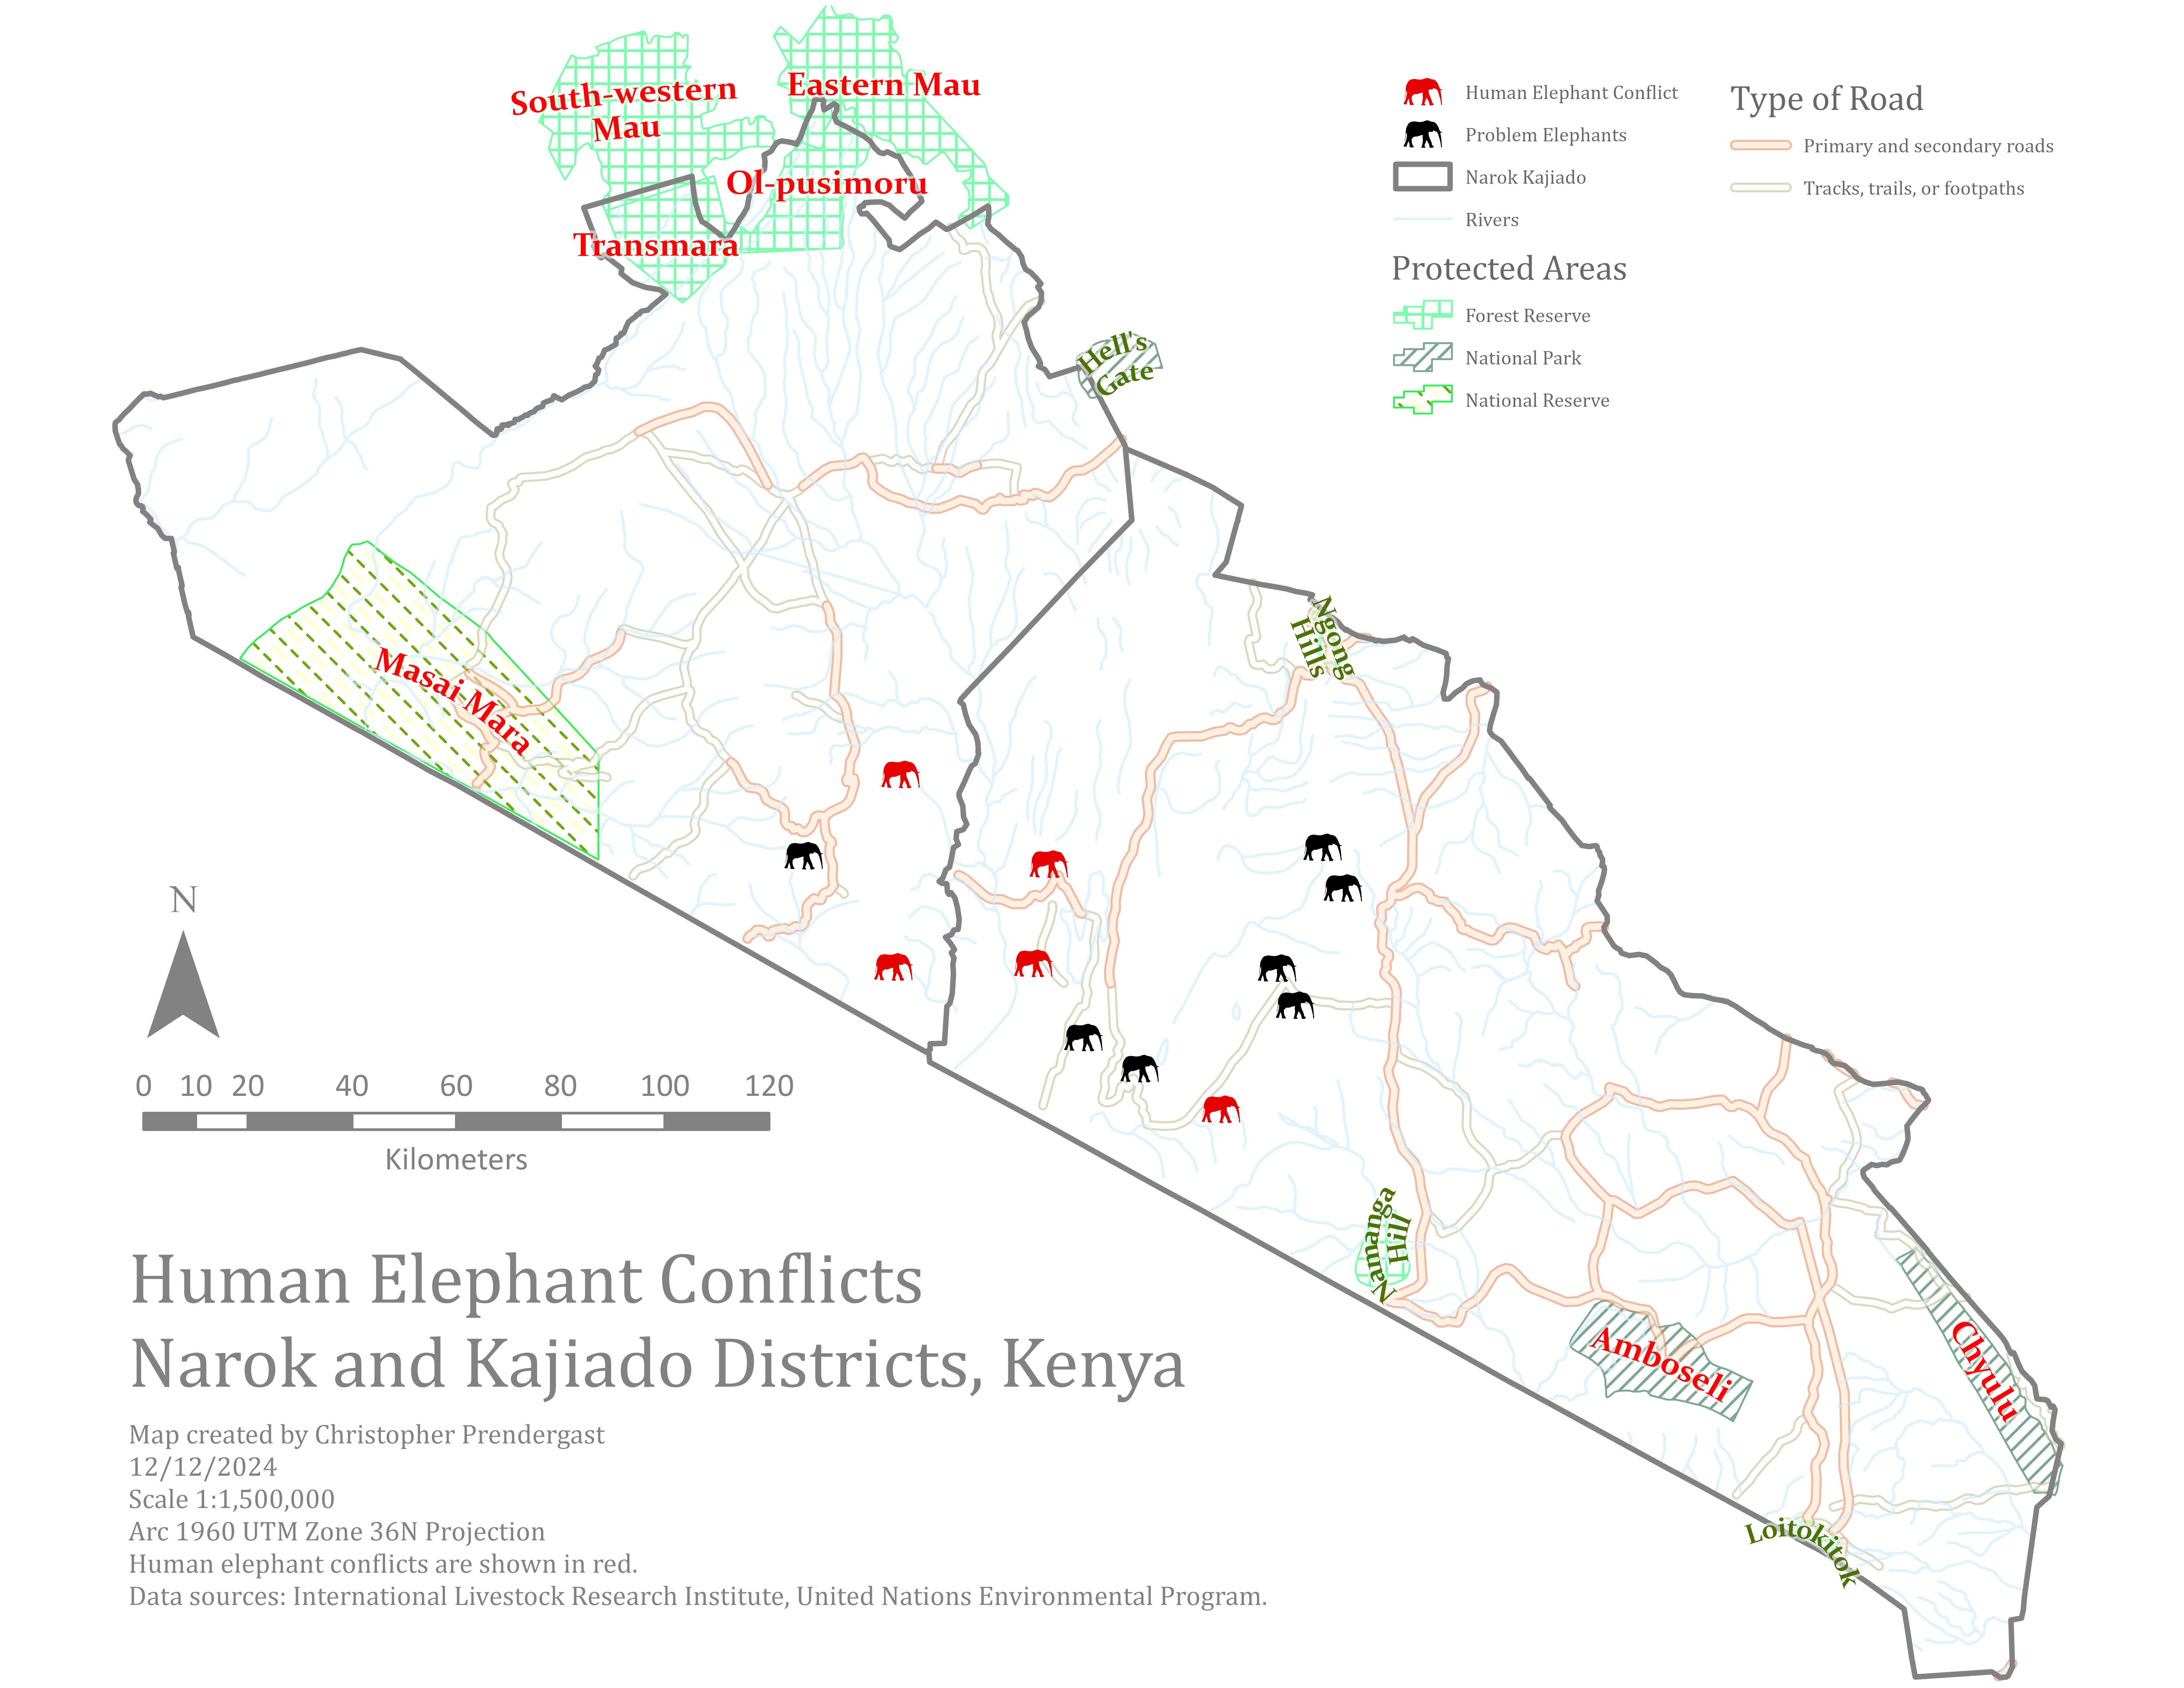
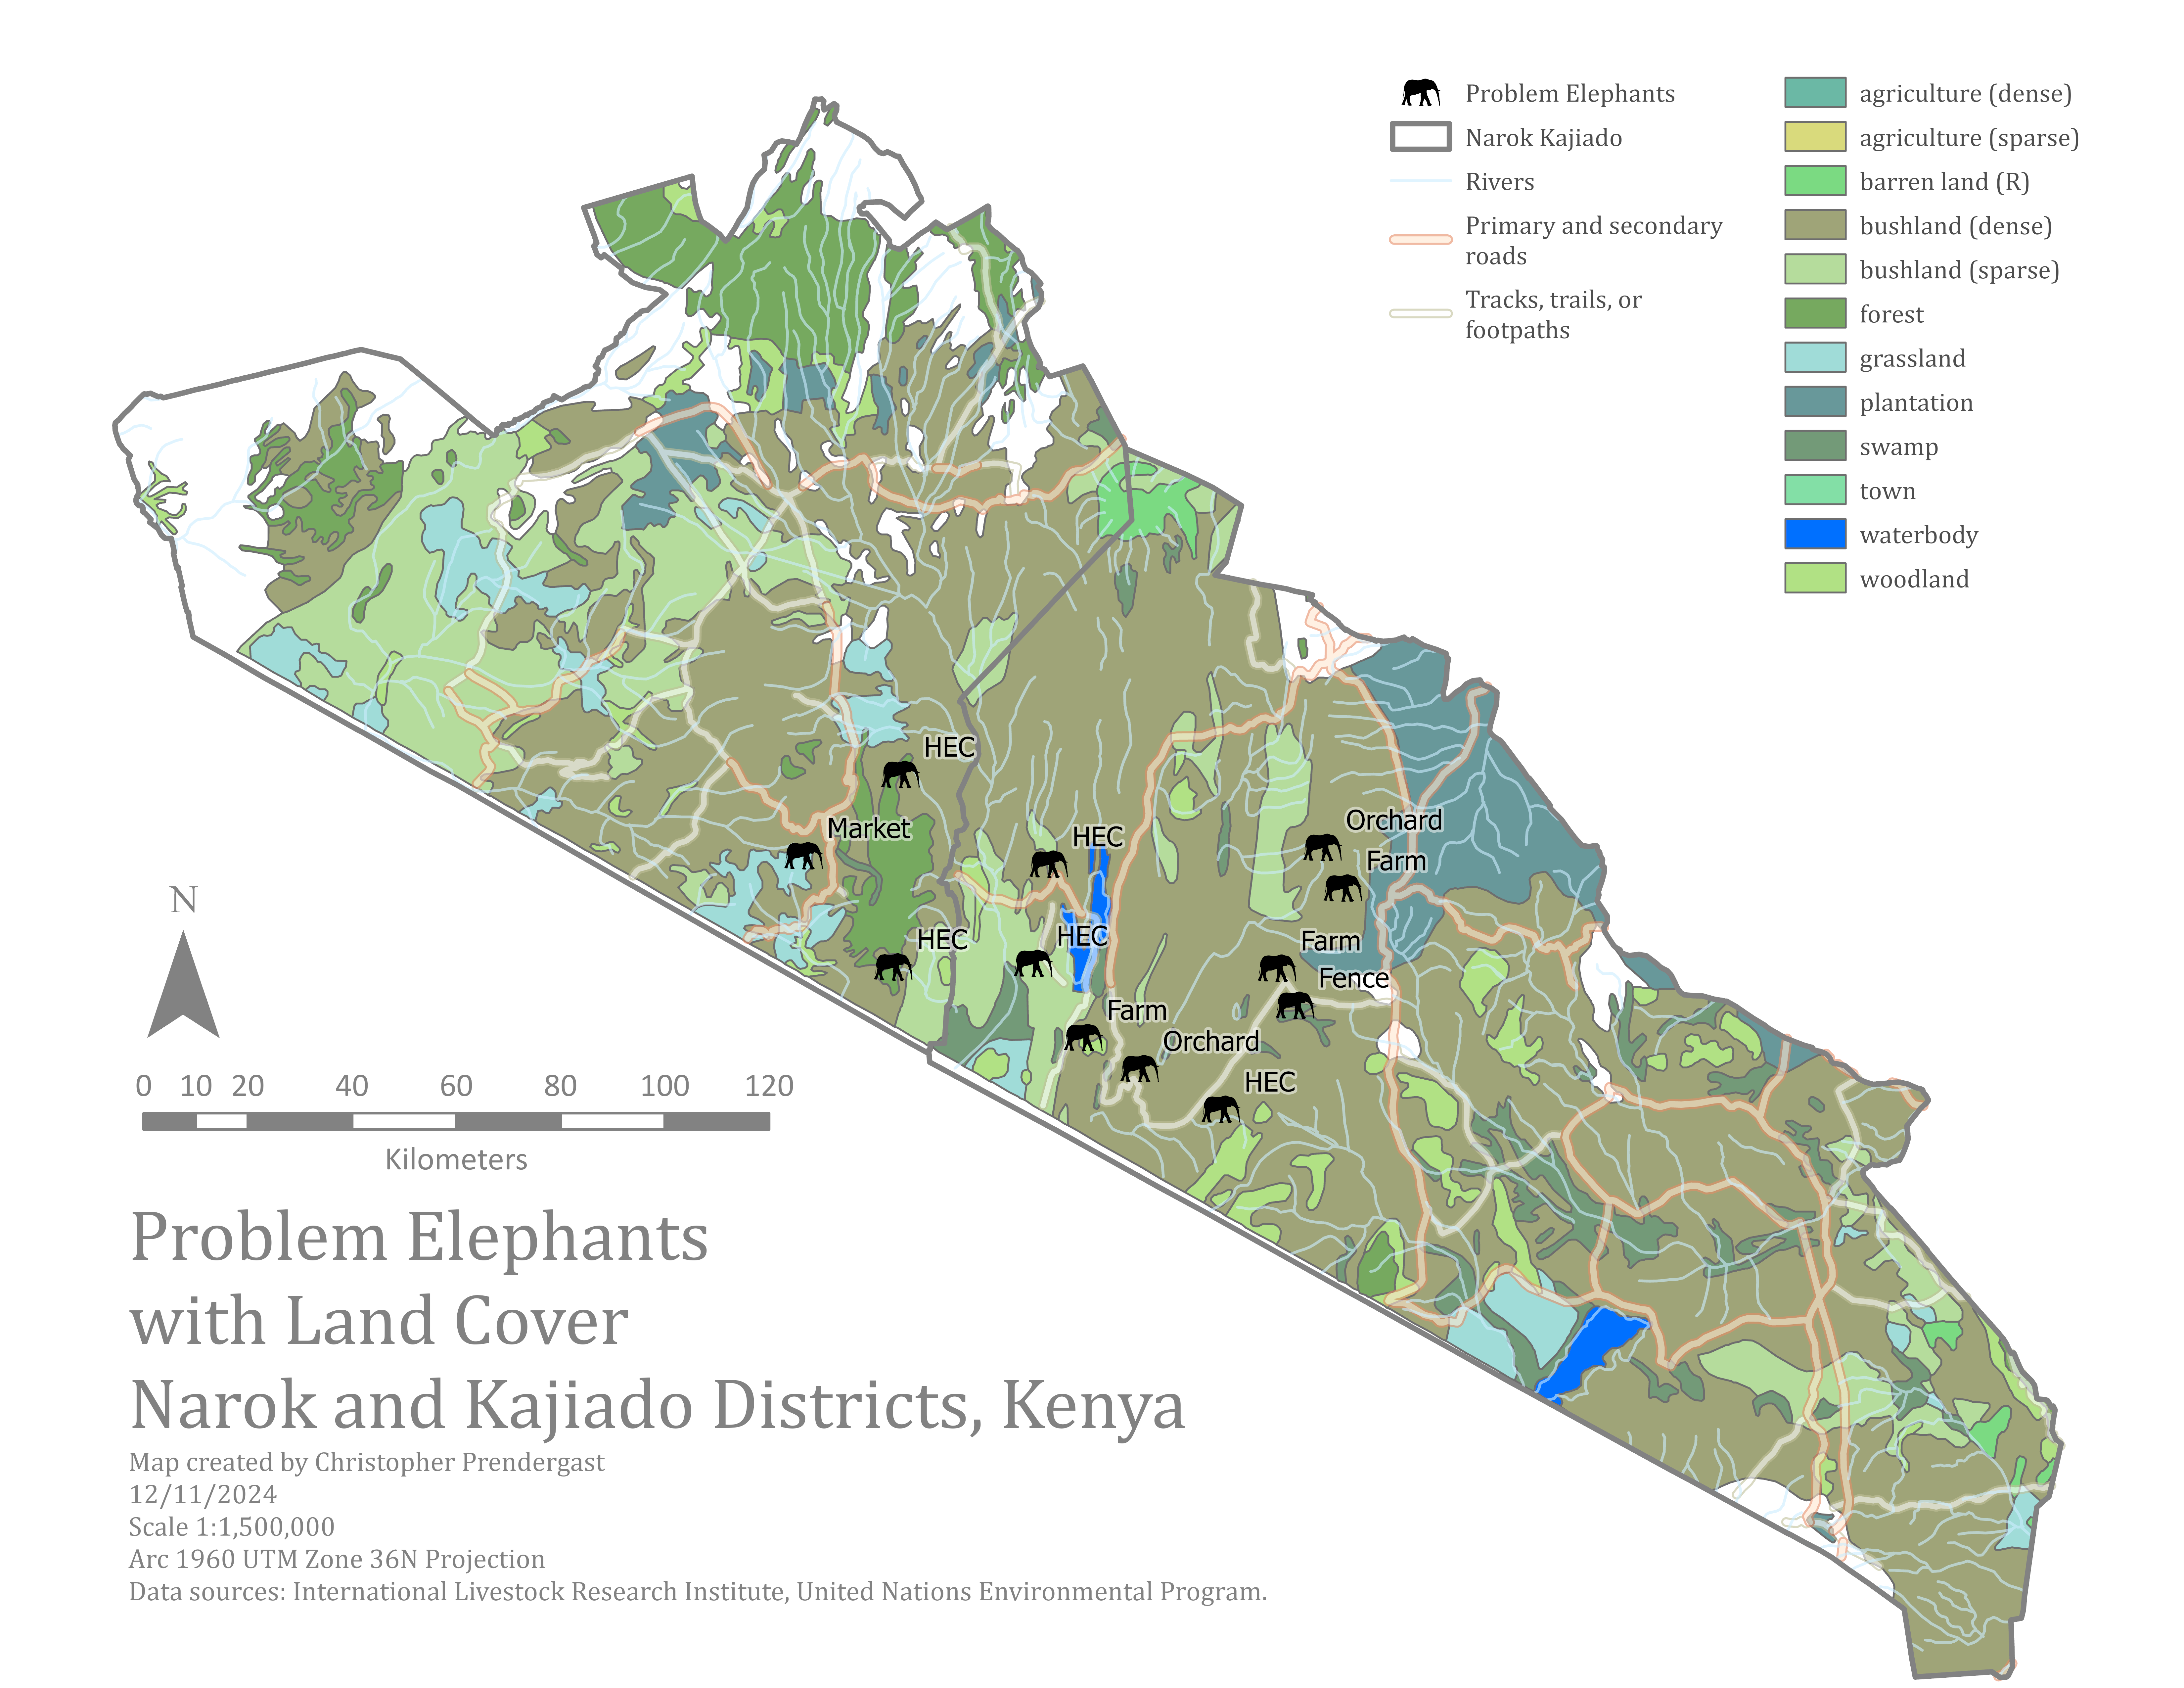
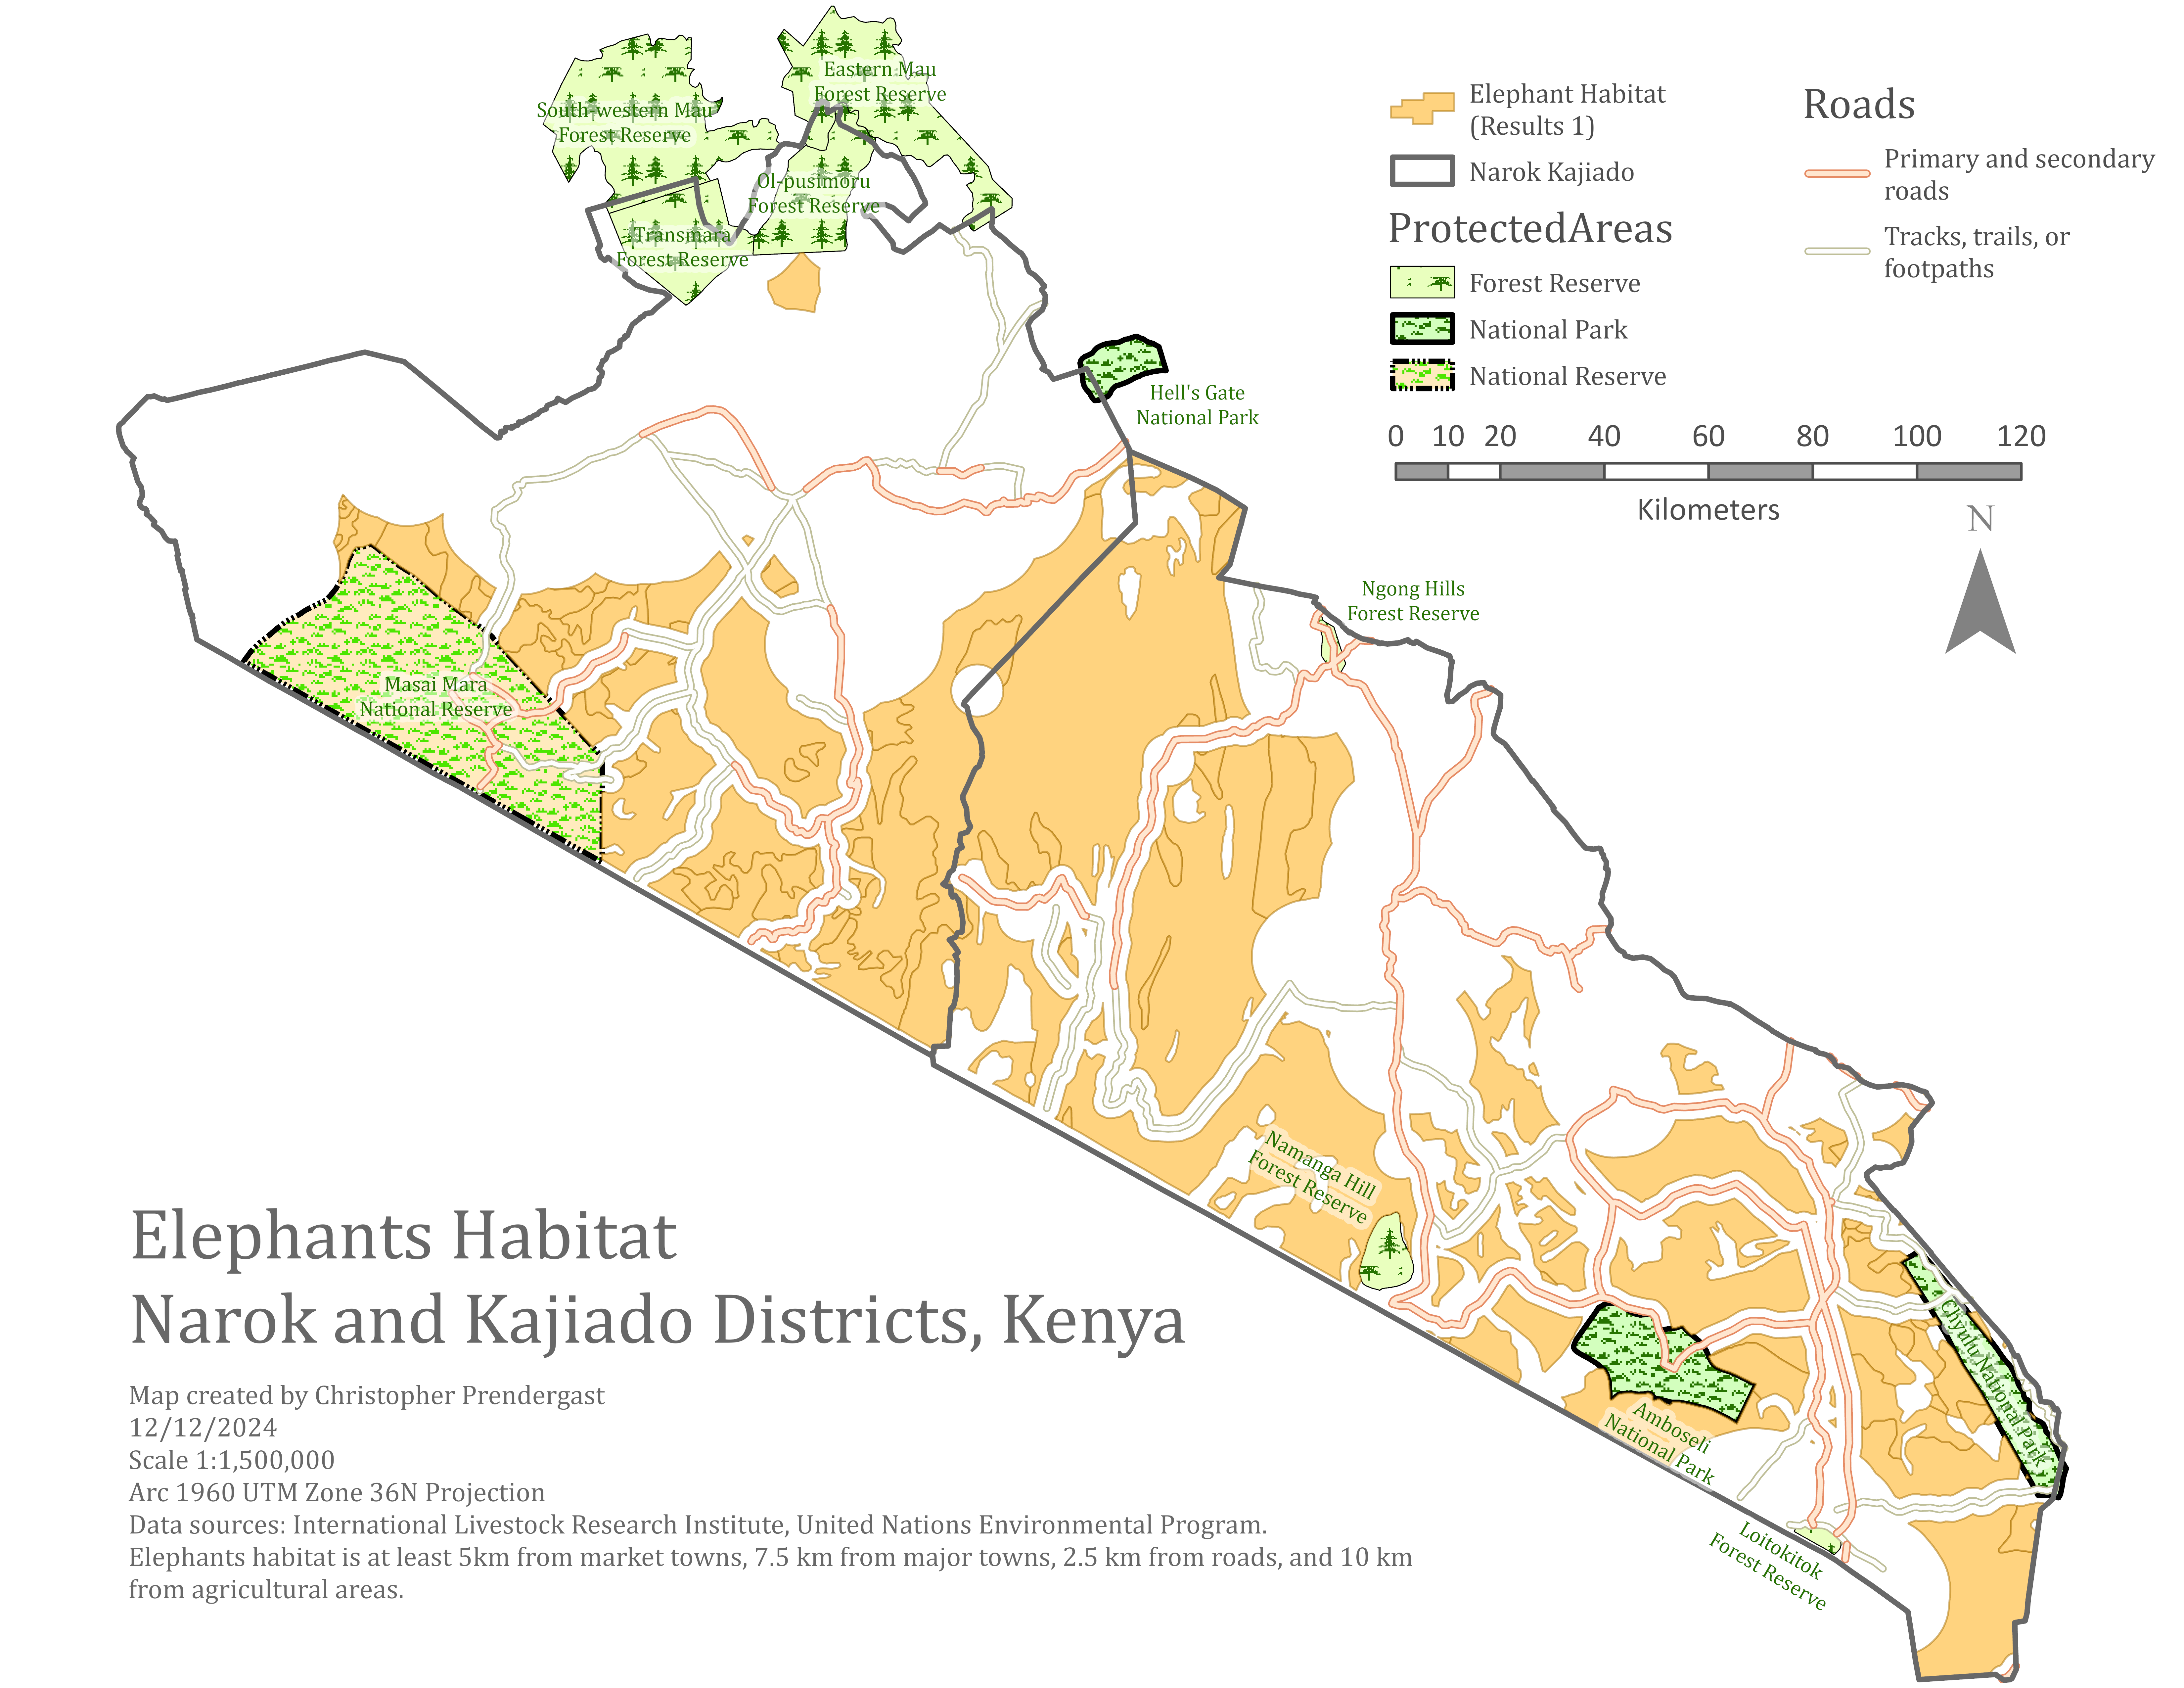
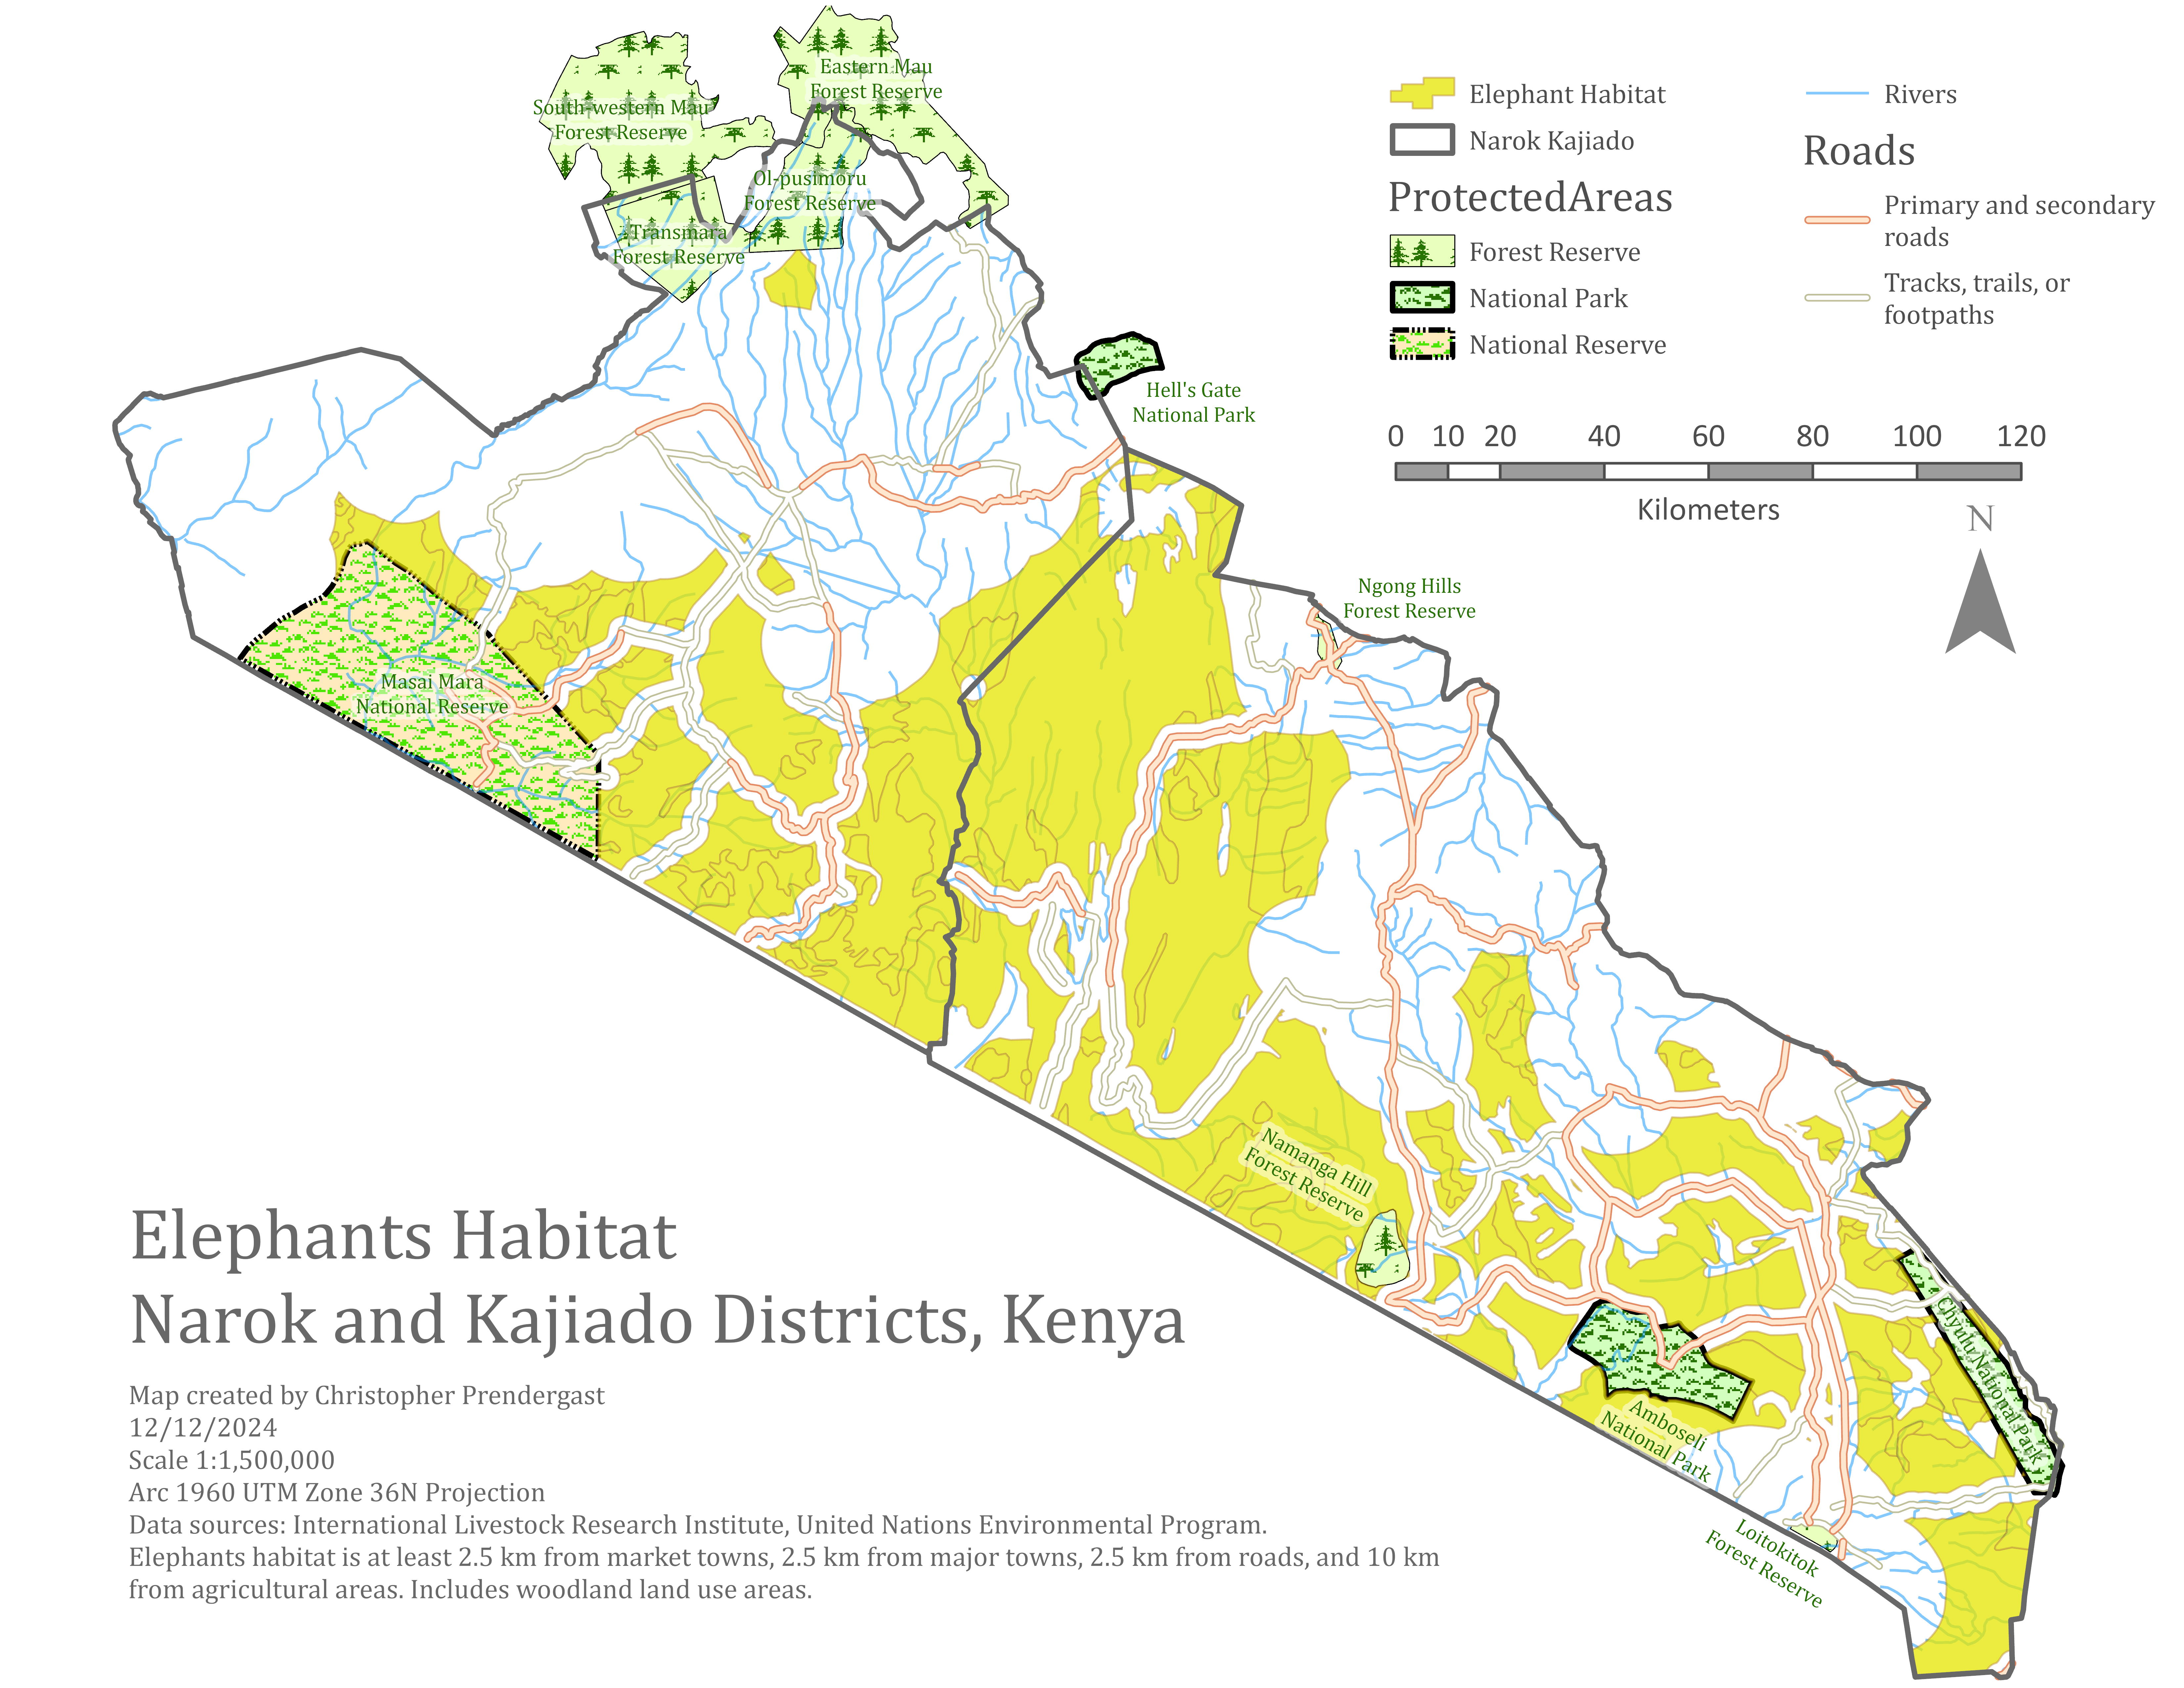
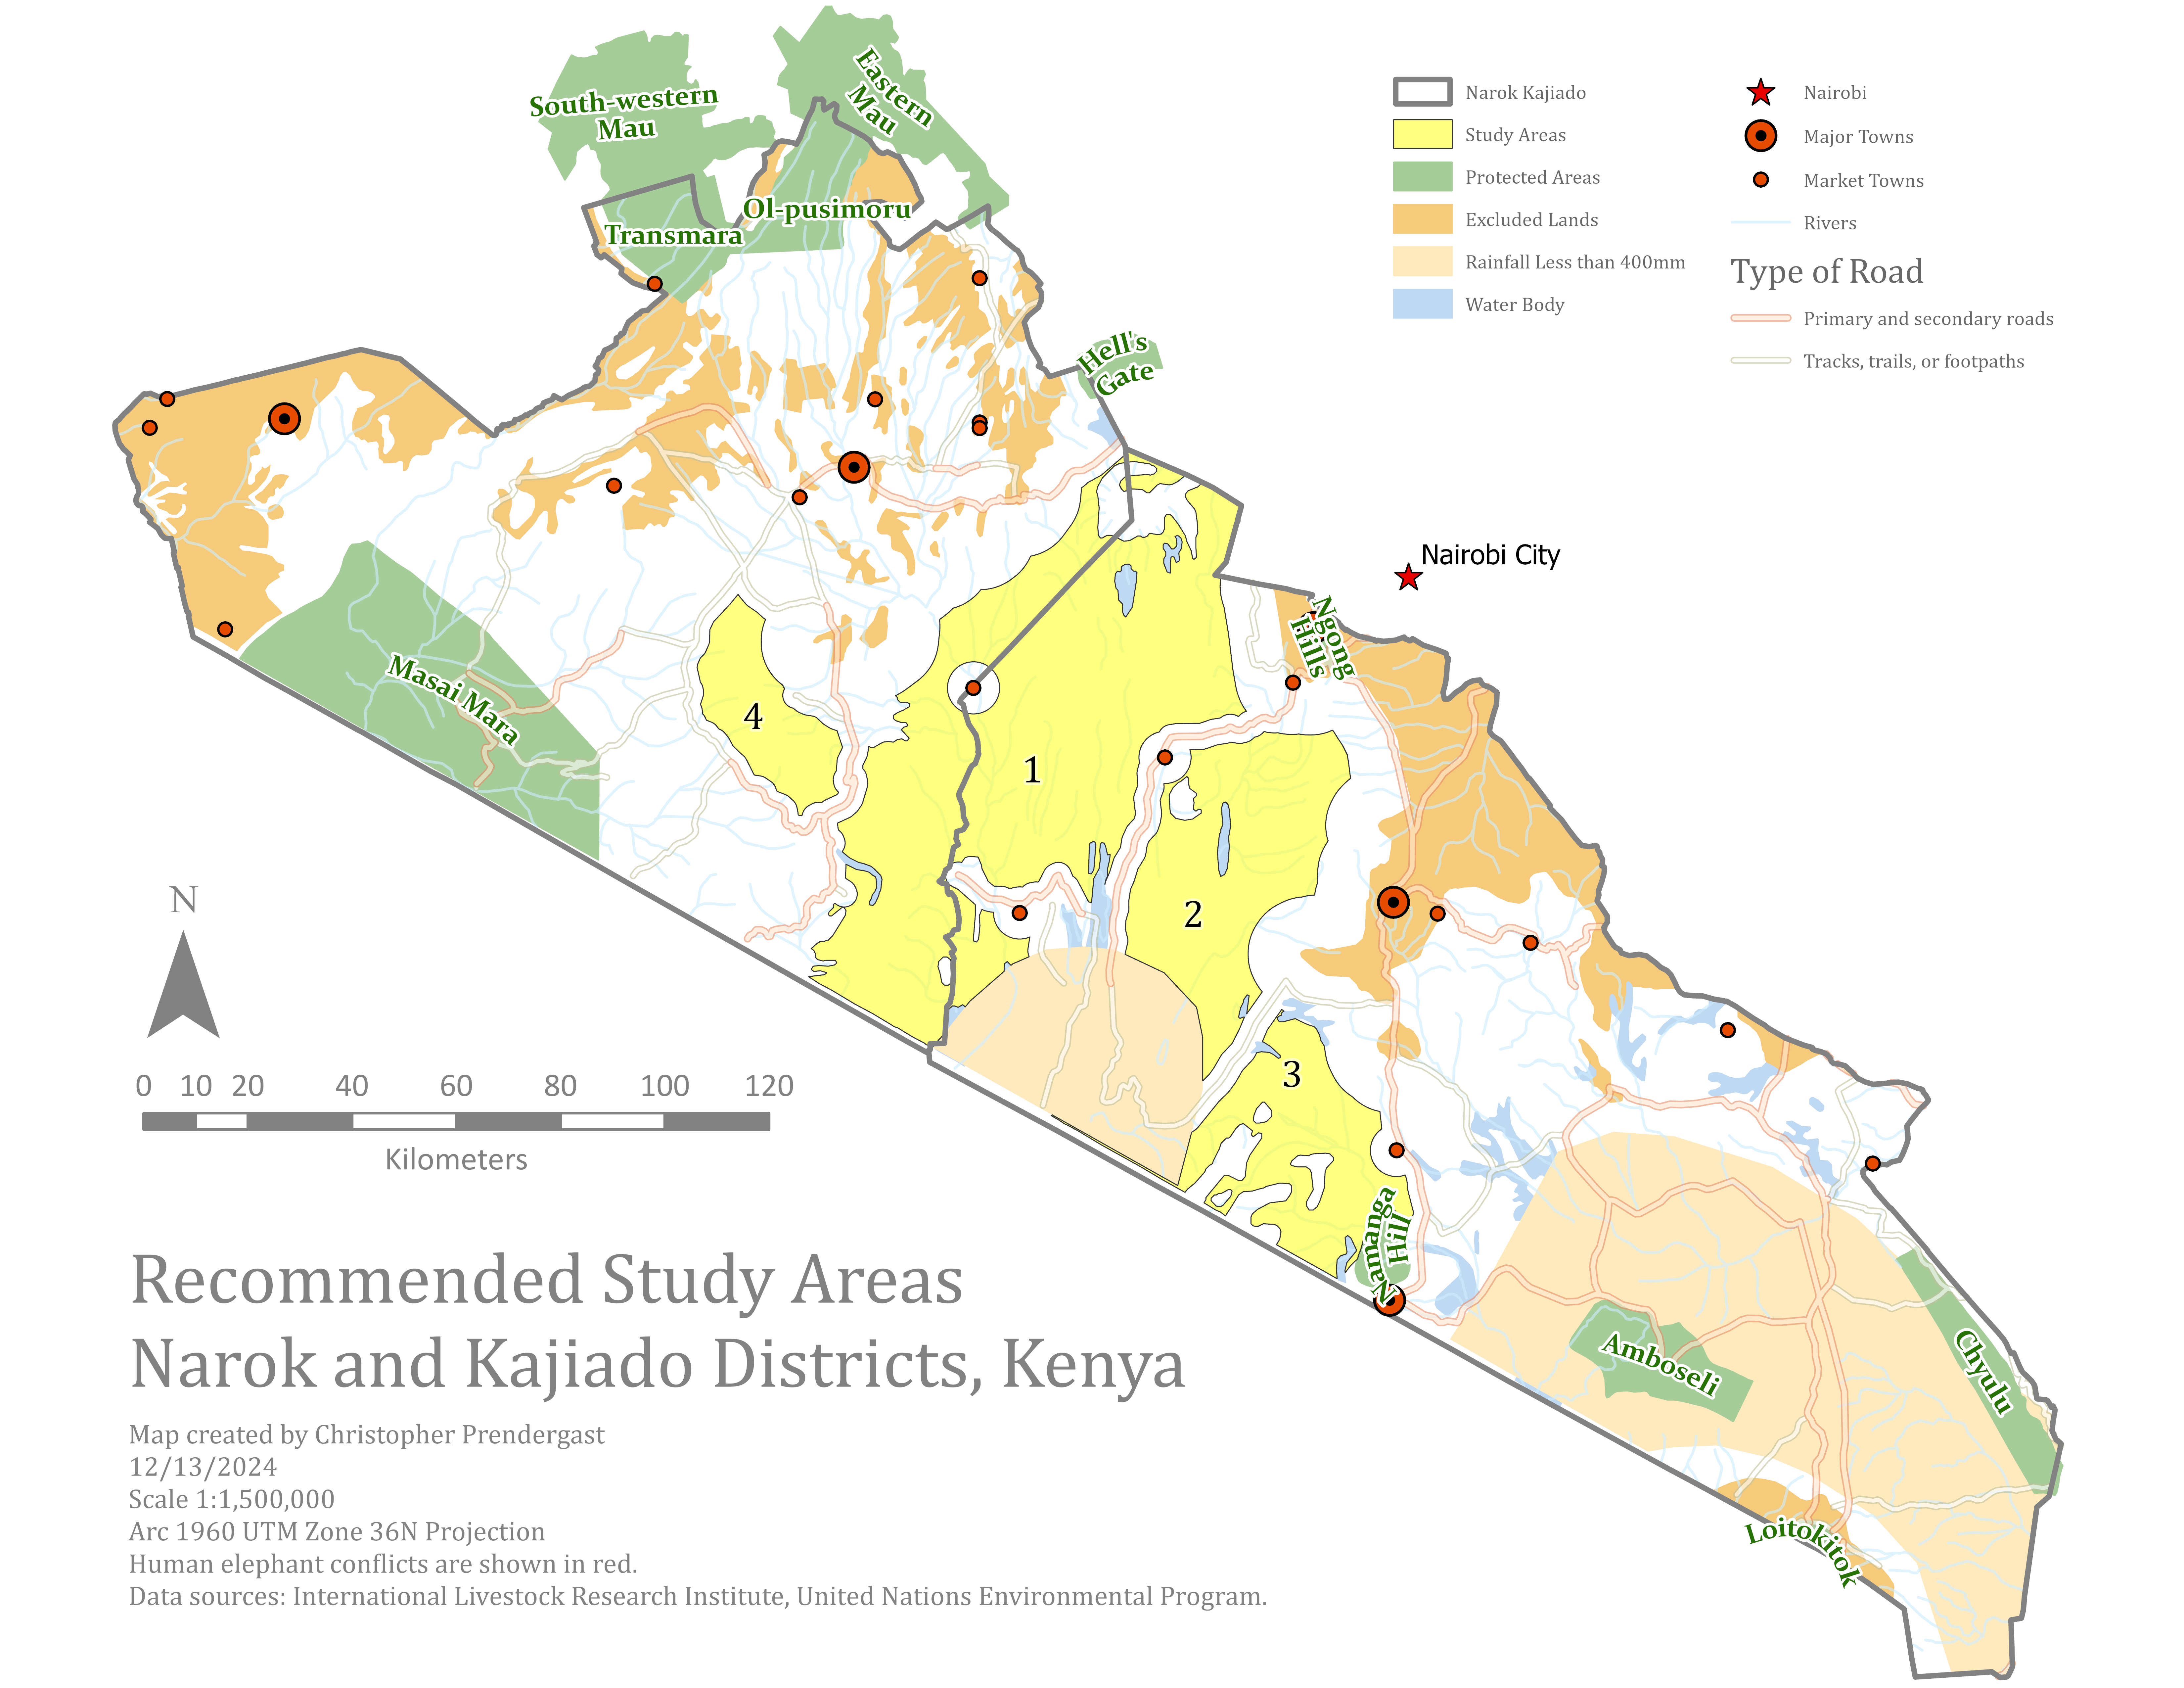
Analysis of Suitable Elephant Habitat, Narok and Kajiado Districts, Kenya
This project applied Geographic Information Systems (GIS) to assess elephant habitat suitability and human-elephant conflict patterns in the Narok and Kajiado districts of Kenya. Using ArcGIS Pro, the study combines environmental layers—such as protected areas, land use, and rainfall—with human-related data including roads, towns, and documented conflict locations. The goal of this spatial analysis project is to identify potential sites to set aside as elephant habitat conservation zones in southwestern Kenya. Maps created by this project enable visualization and analysis of spatial relationships, leading to the development of a ModelBuilder workflow. This model automates producing a detailed suitability map highlighting areas most favorable for elephant movement and conservation.

Go to article | Return to overview
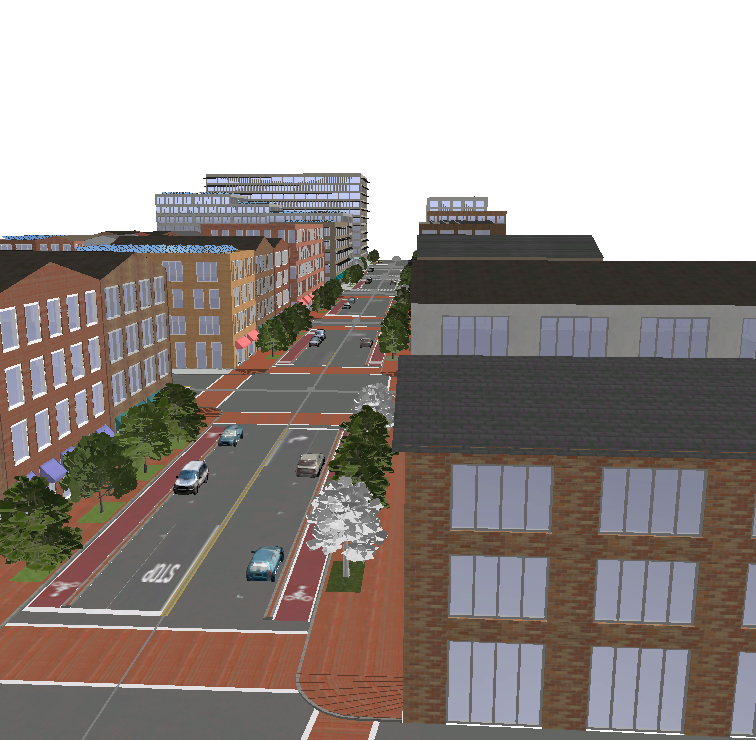
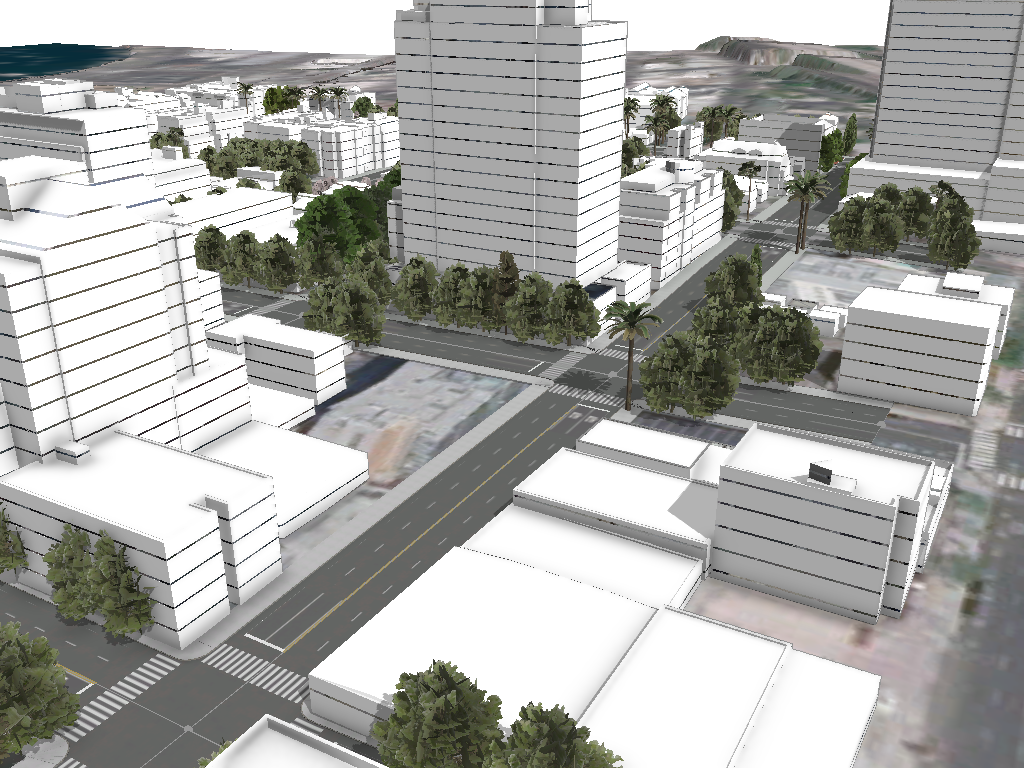
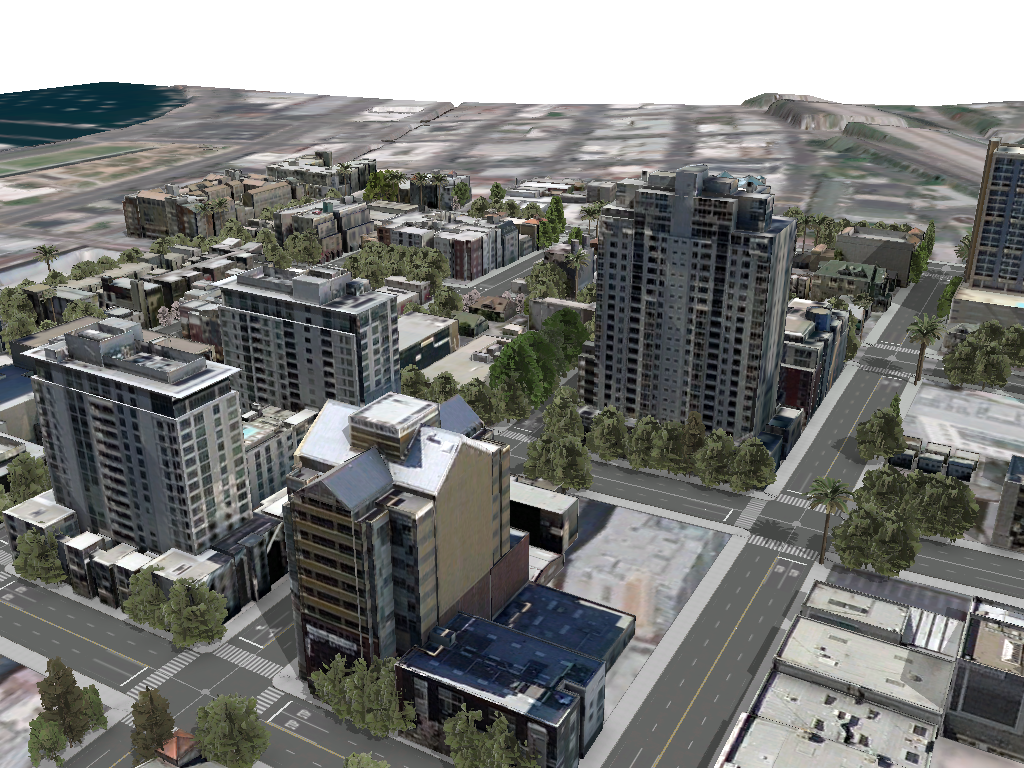
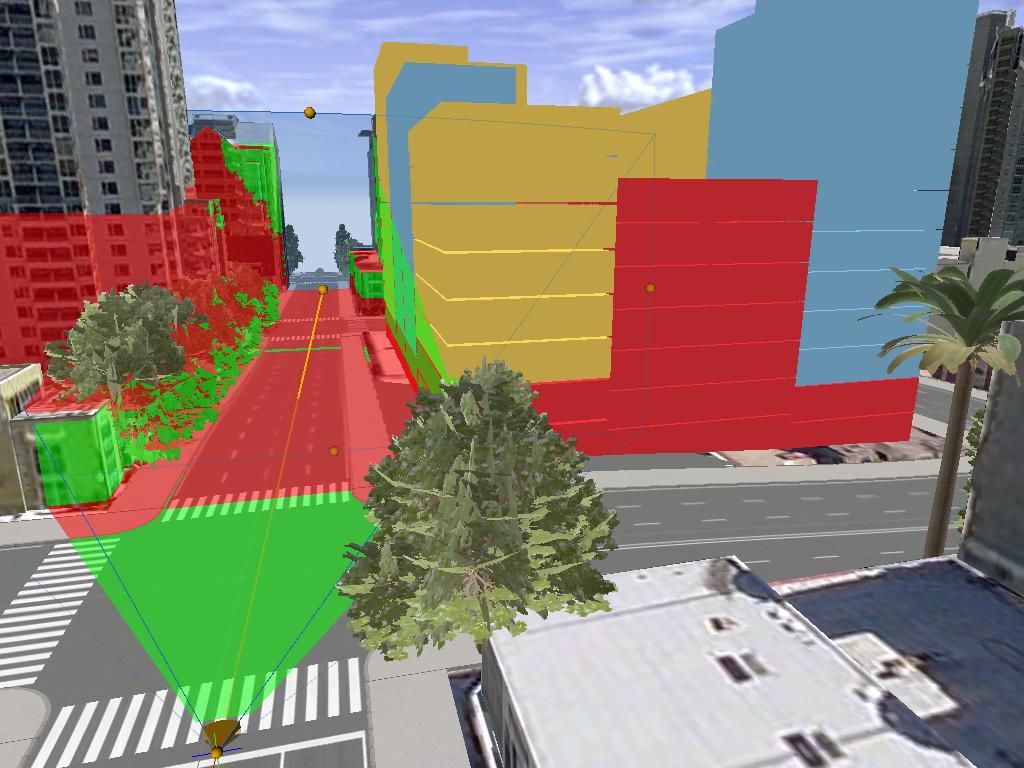
Analysis of a Proposed Development using ArcGIS CityEngine
Analysis of alternate development proposals for Little Italy, San Diego, California using ArcGIS CityEngine and 3D Scene Viewer.


Go to article | Return to overview
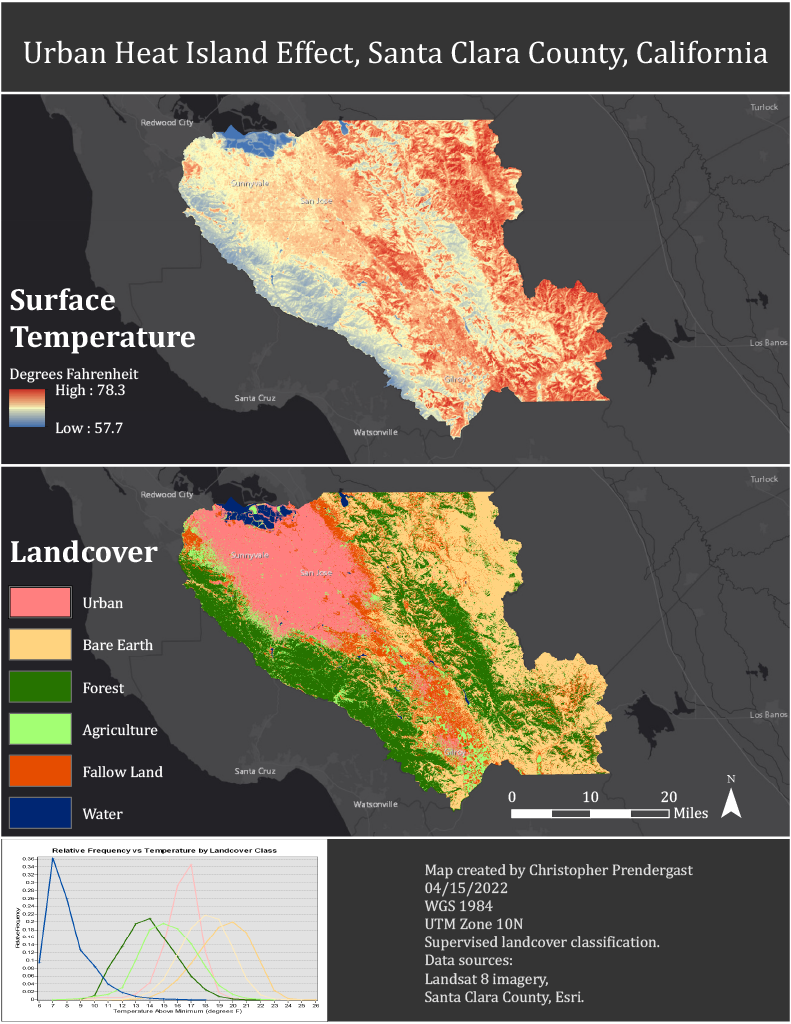
Analysis of the Urban Heat Island Effect, Santa Clara County
An analysis of land surface temperature by landcover class for Santa Clara County derived from Landsat 8 imagery and a supervised image classification. Presents results in maps, charts, and tables. Draws conclusions, identifies limitation of this study, and suggests areas for further study.
Go to article | Return to overview
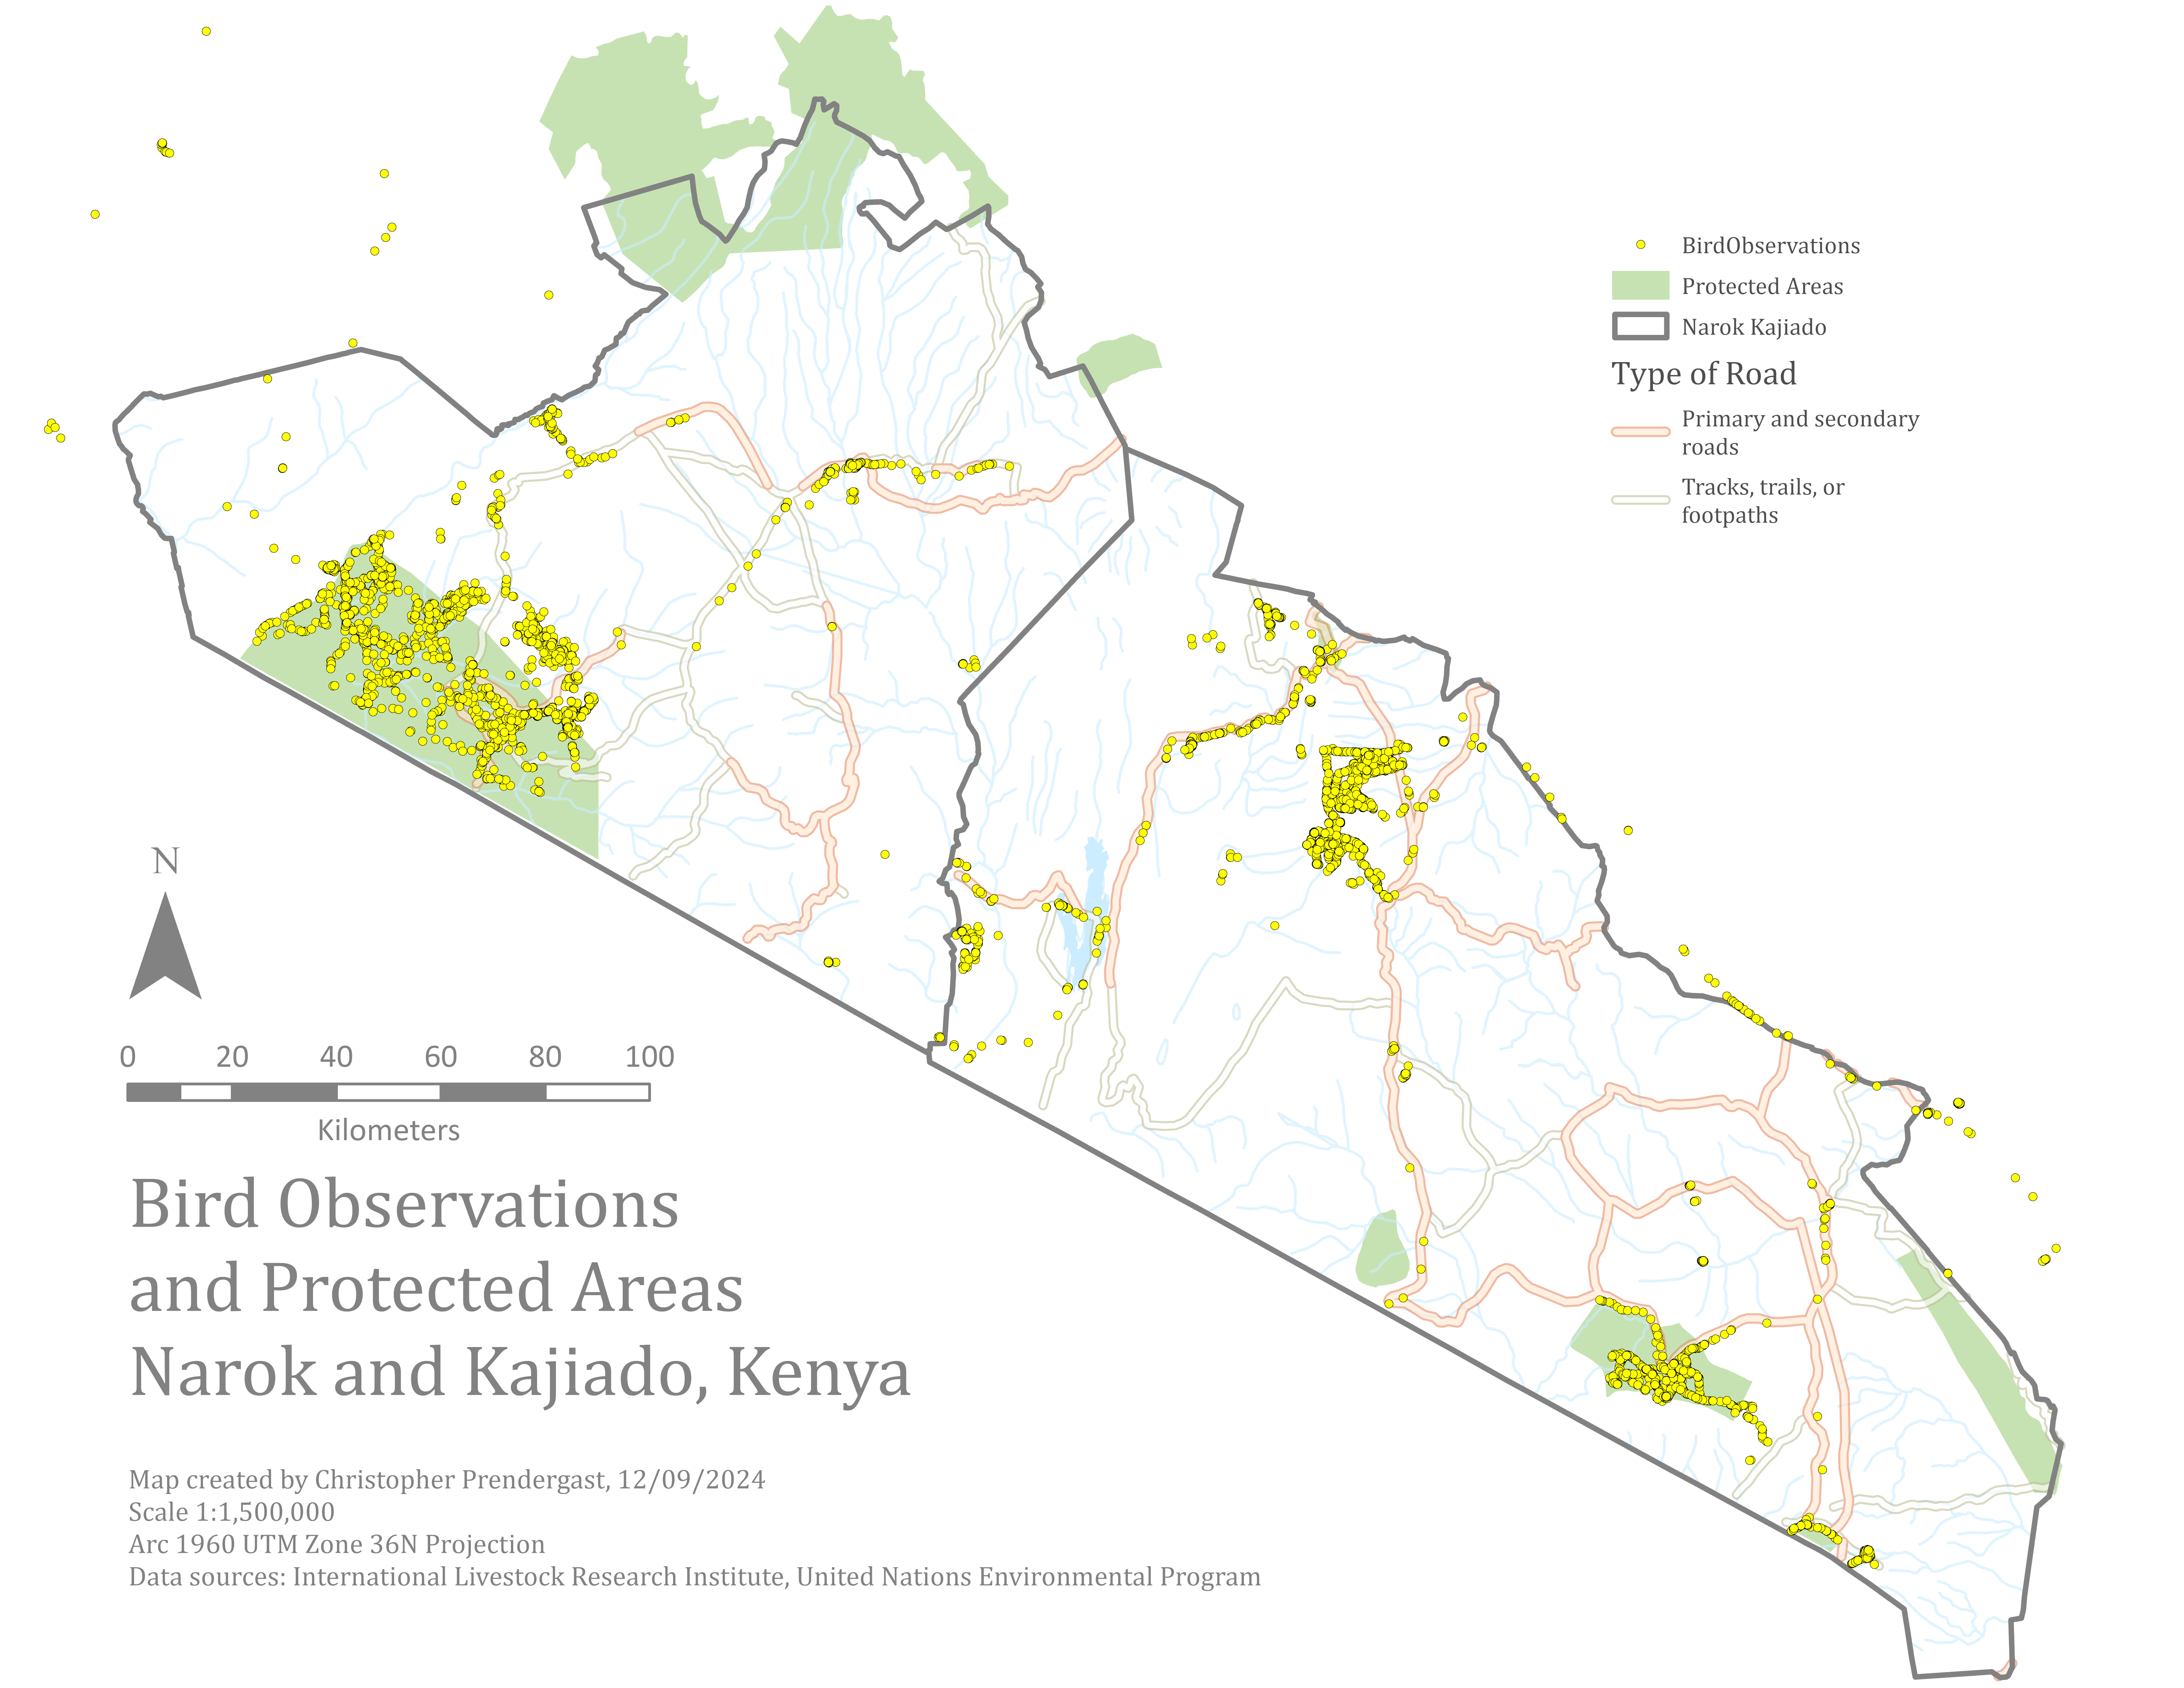
Bird Observations, Narok and Kajiado Districts, Kenya
The Bird Observation Map shows the spatial distribution of recorded bird sightings in Narok and Kajiado Districts, Kenya. Using point data for observations along with contextual layers like protected areas and roads, the map highlights hotspots of avian activity and provides insight into environmental and human influences on bird distribution. It serves as a research and management tool for monitoring, conservation planning, and tracking changes in bird populations over time.
Go to article | Return to overview
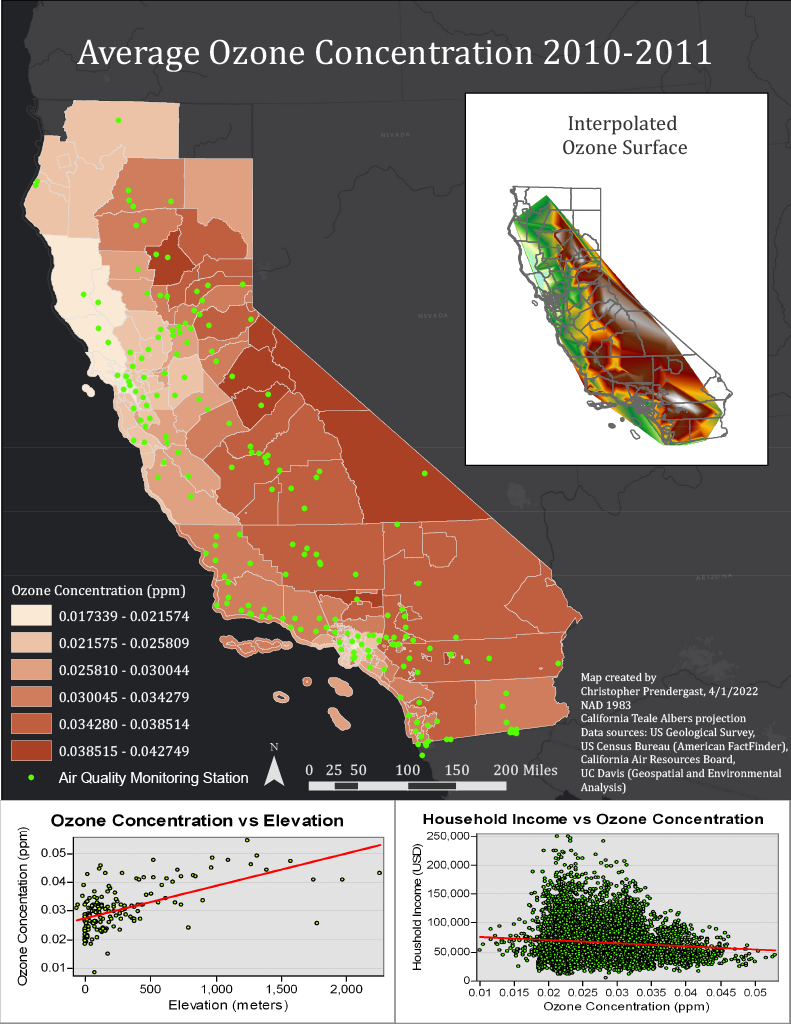
California Ozone
Map of average ozone concentration for 2010-2011 by county in California. The inset includes an interpolated concentration surface which is derived from the monitoring station data. Additional charts show the relationship between ozone concentration, elevation, and household income.
Go to article | Return to overview
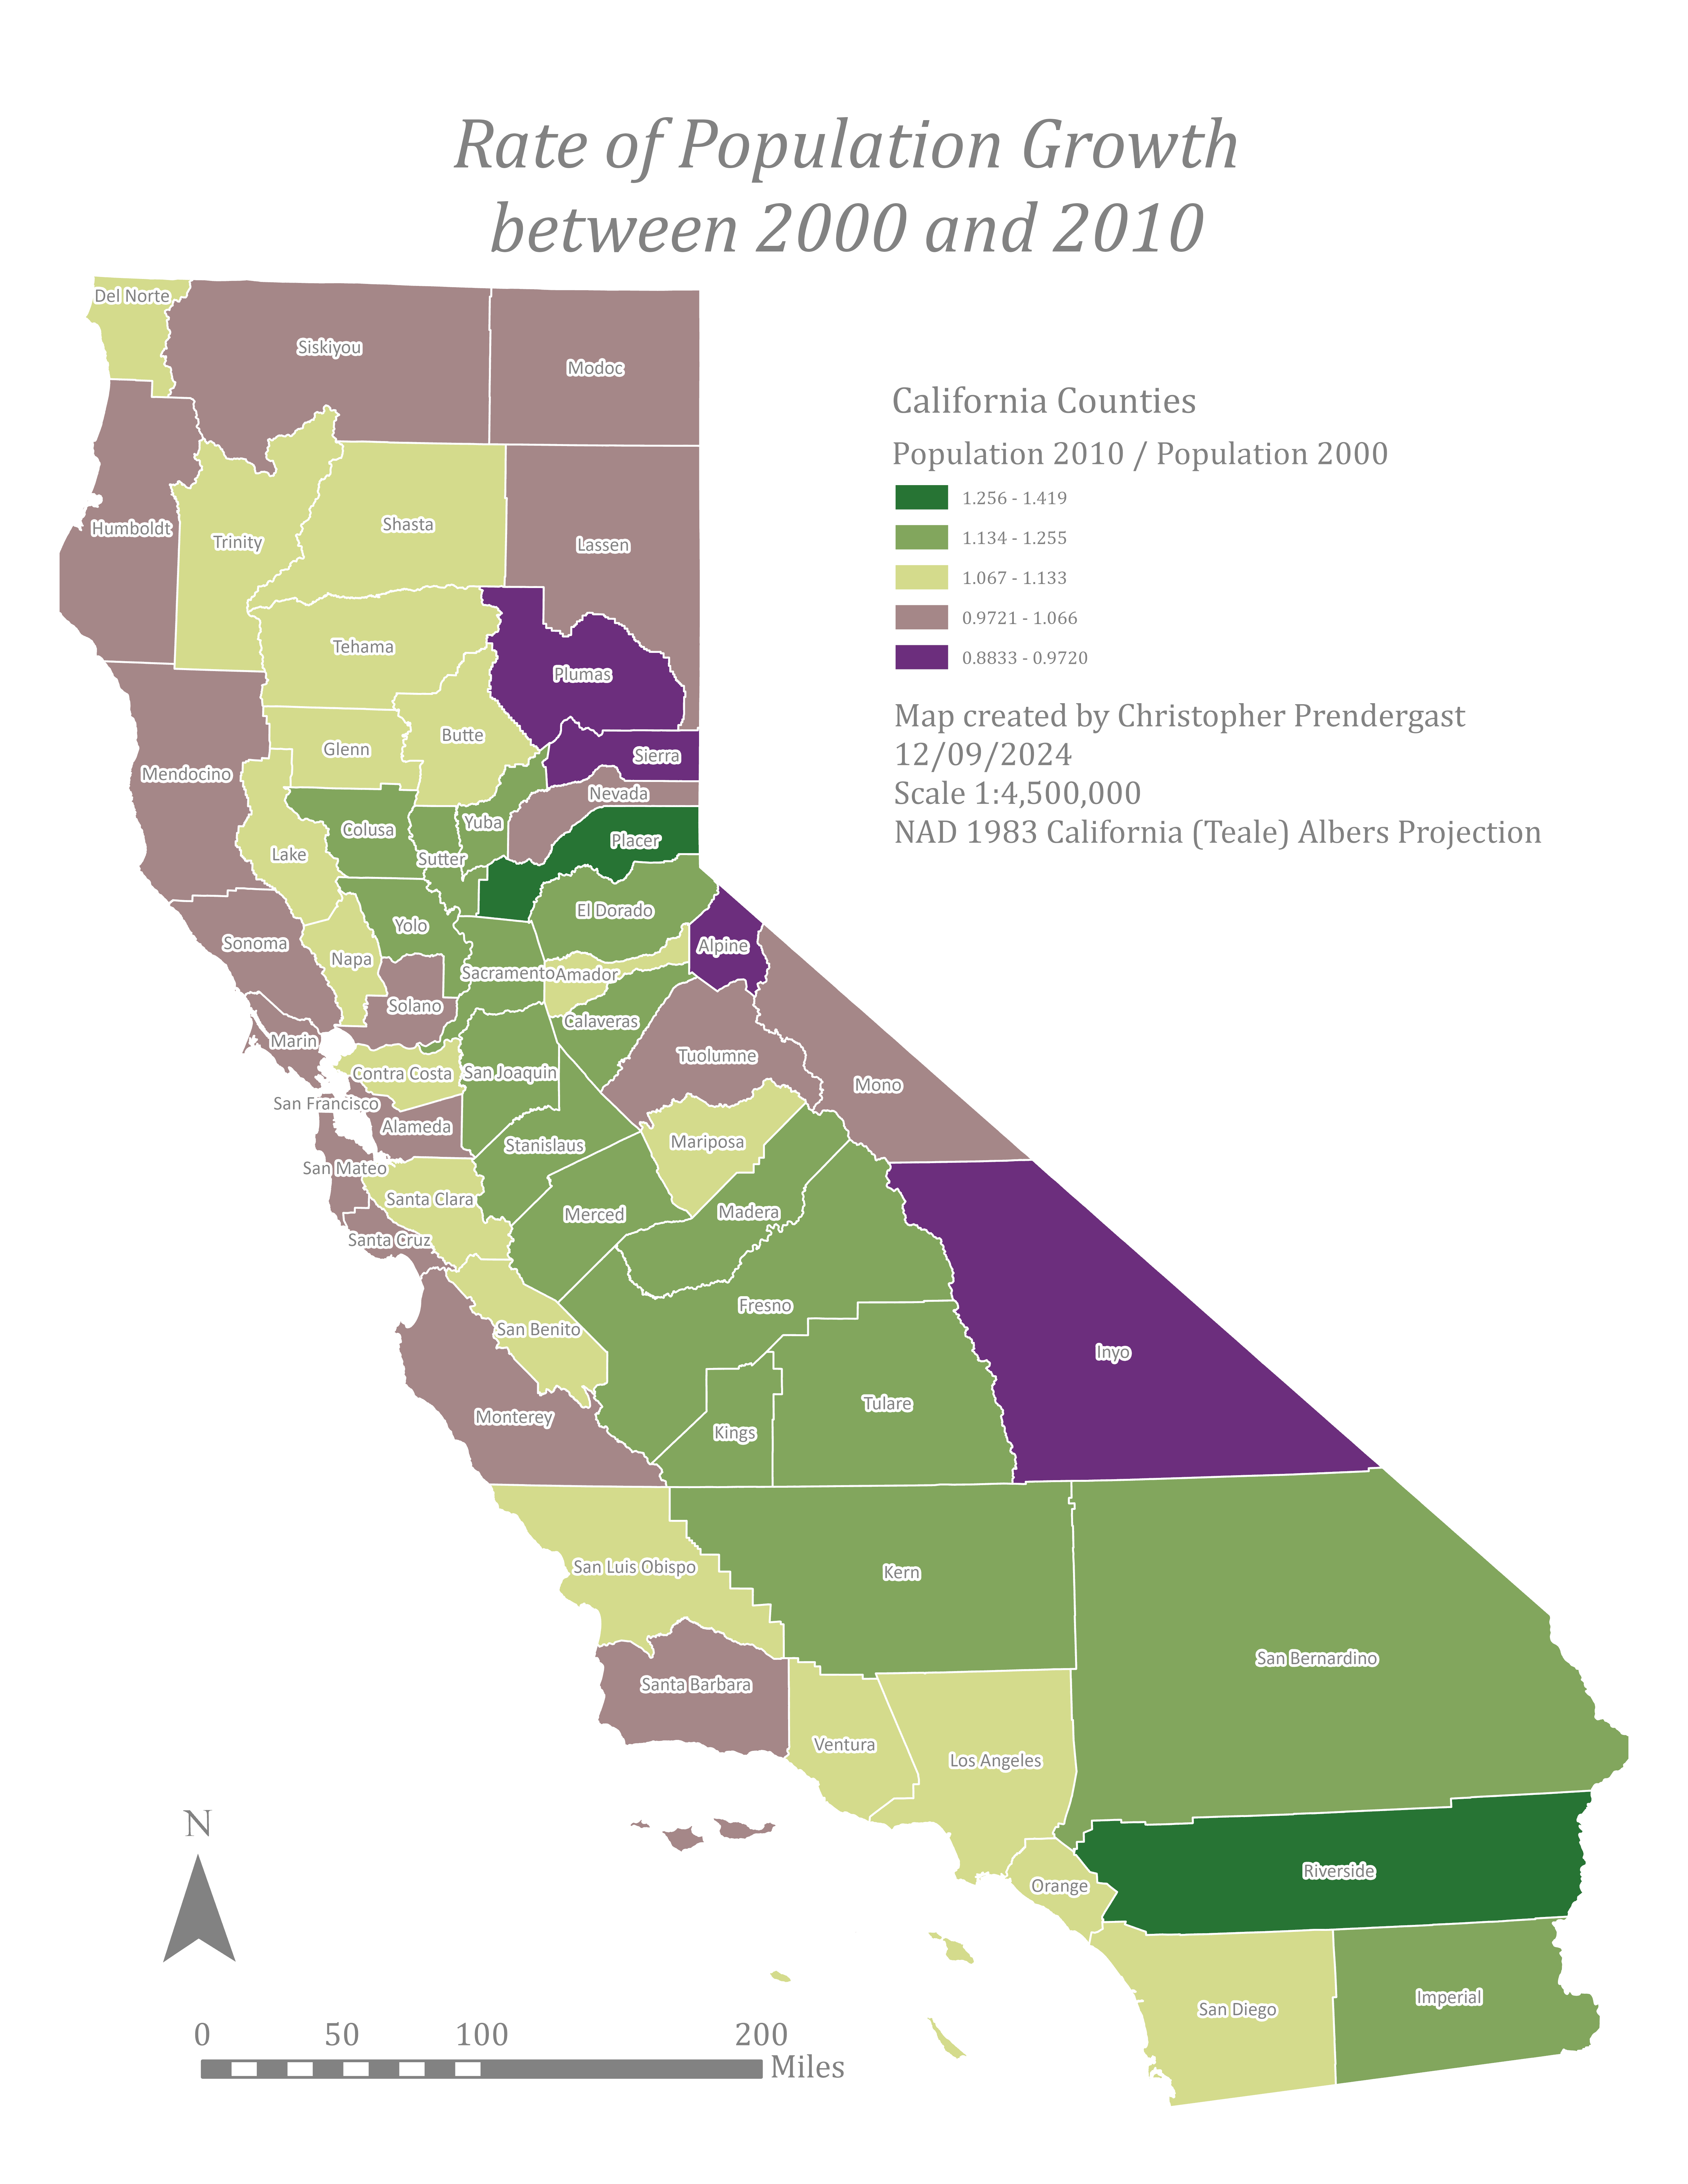
California Population Growth 2000 to 2010
California Population Map (2000–2010): Shows county-level population growth (green) and decline (purple). Darker shades indicate larger changes. Uses the California (Teale) Albers projection, optimized for accurate area representation.
Go to article | Return to overview
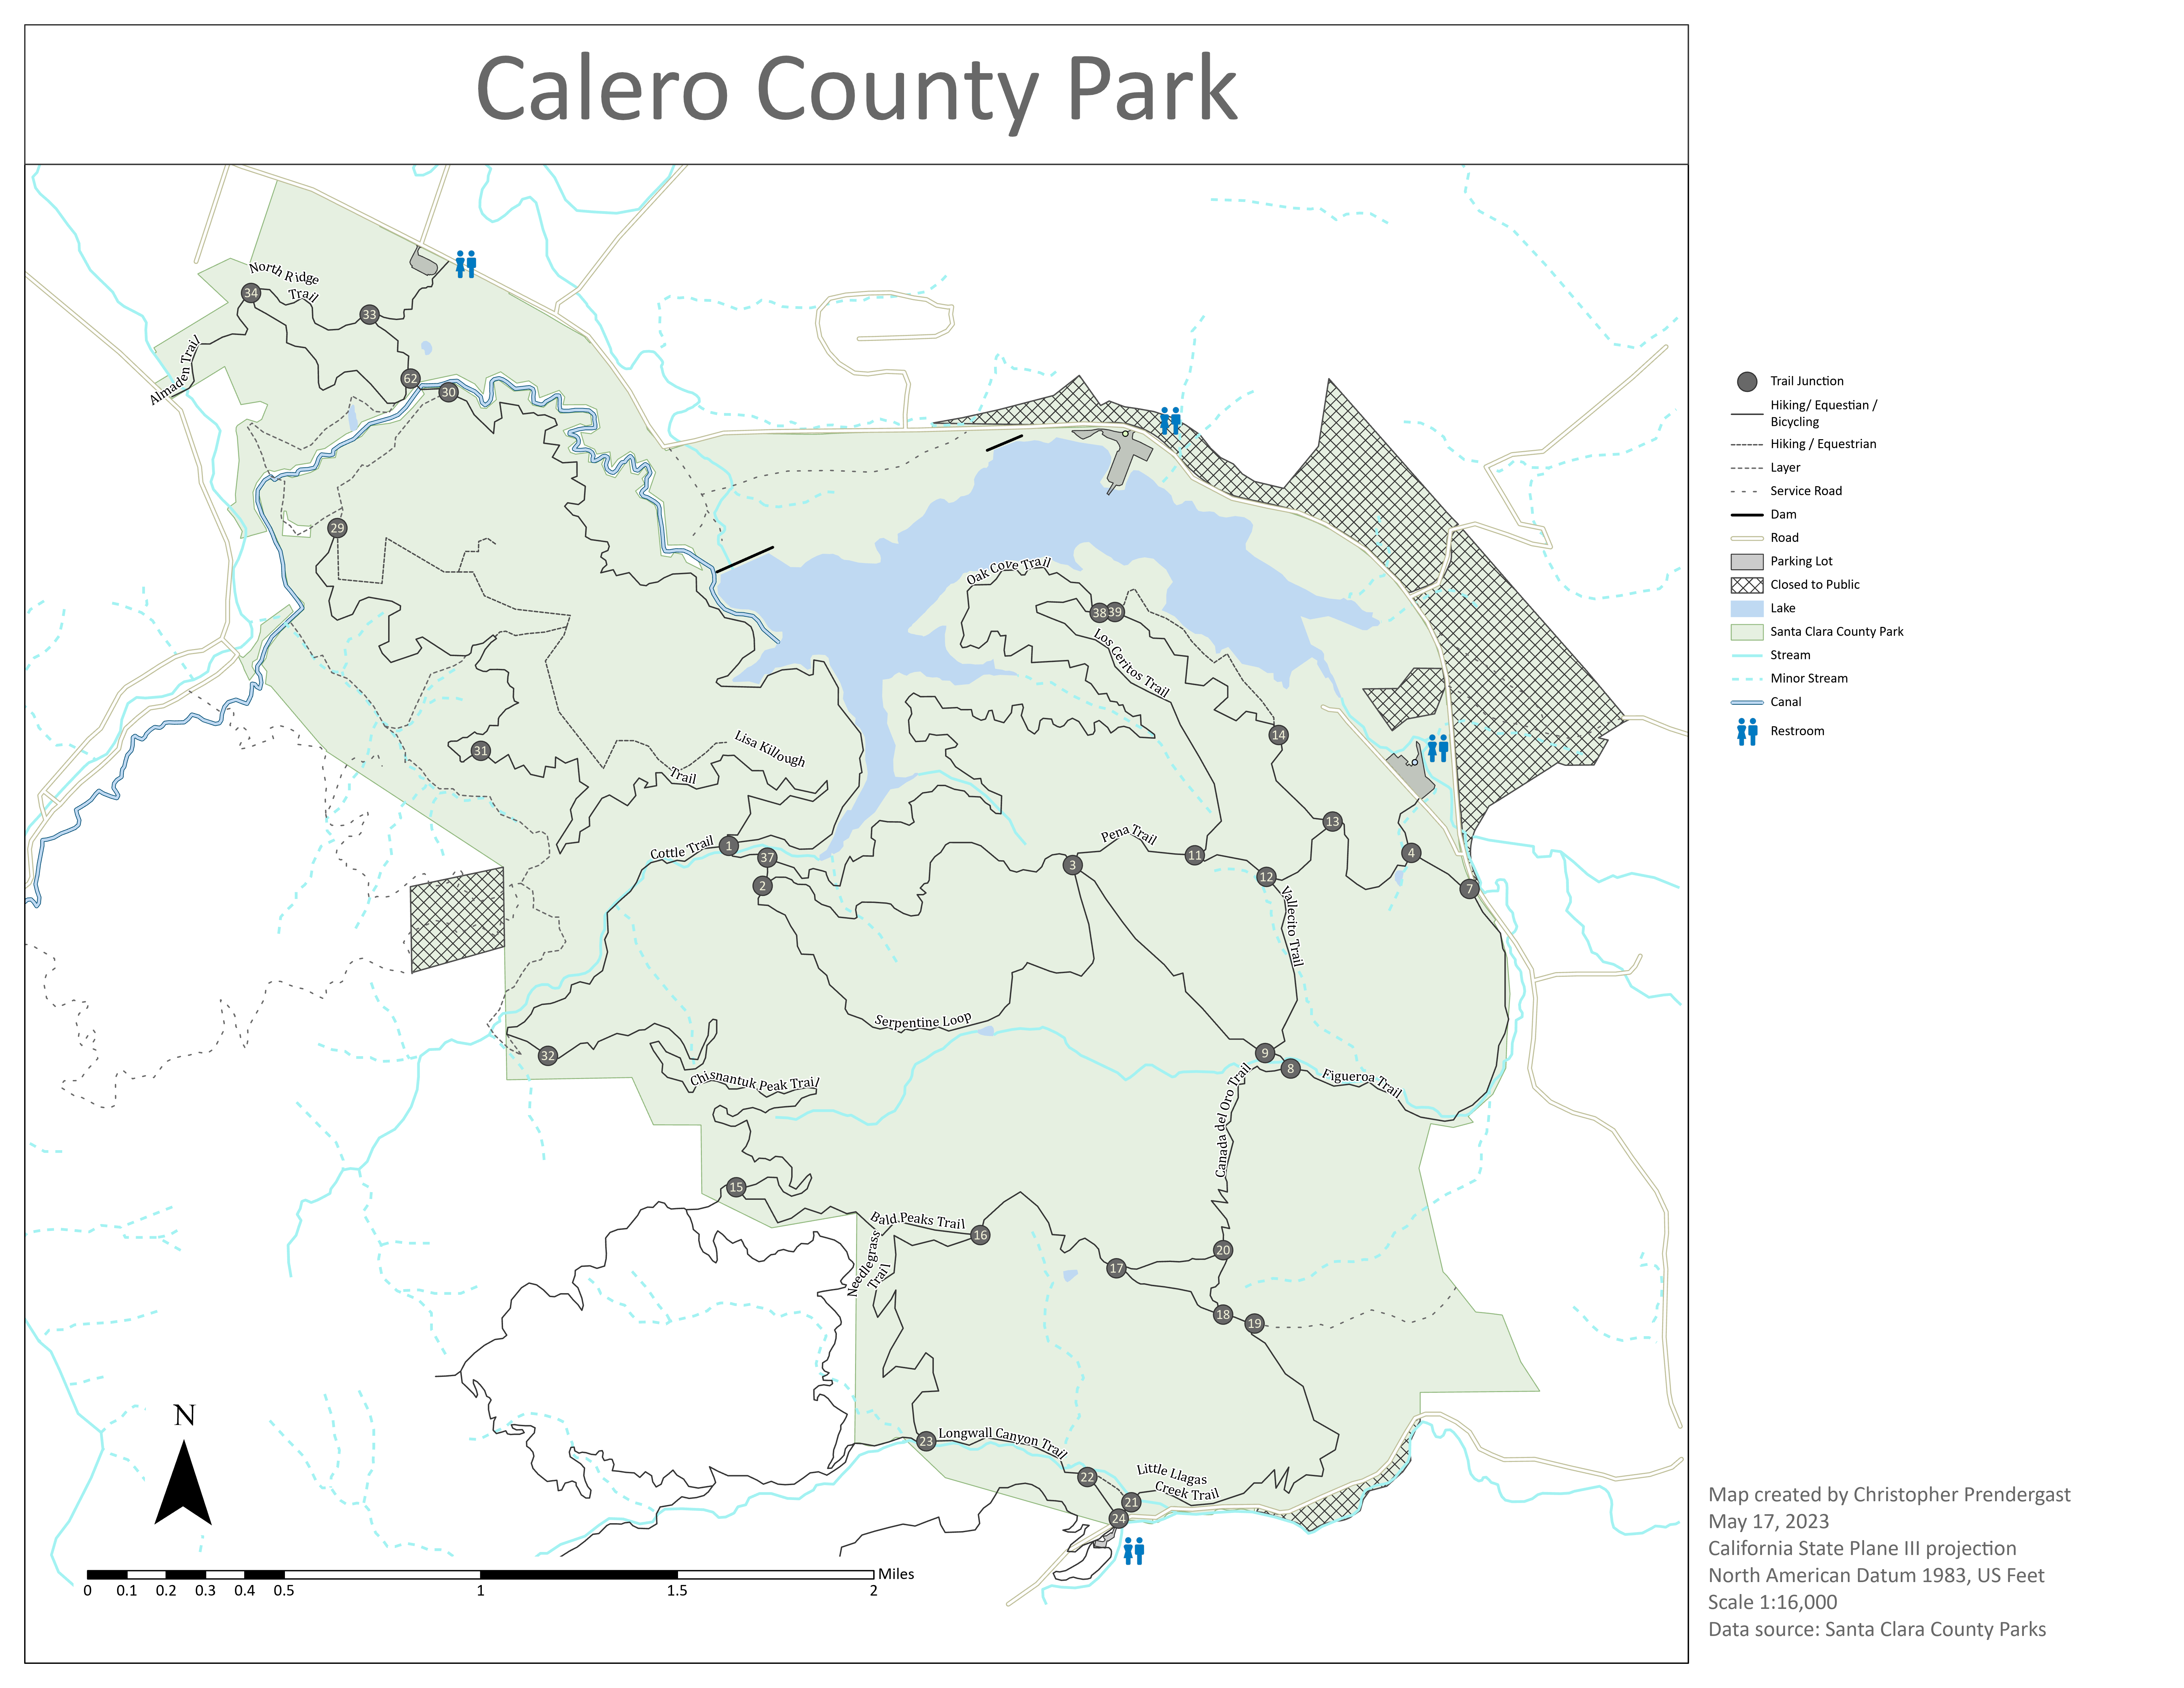
Geodatabase Design, Calero County Park, Santa Clara County, California
Geodatabase design project for Calero County Park. Includes recommended definitions of feature classes, fields, subtypes, and domains.
Go to article | Return to overview
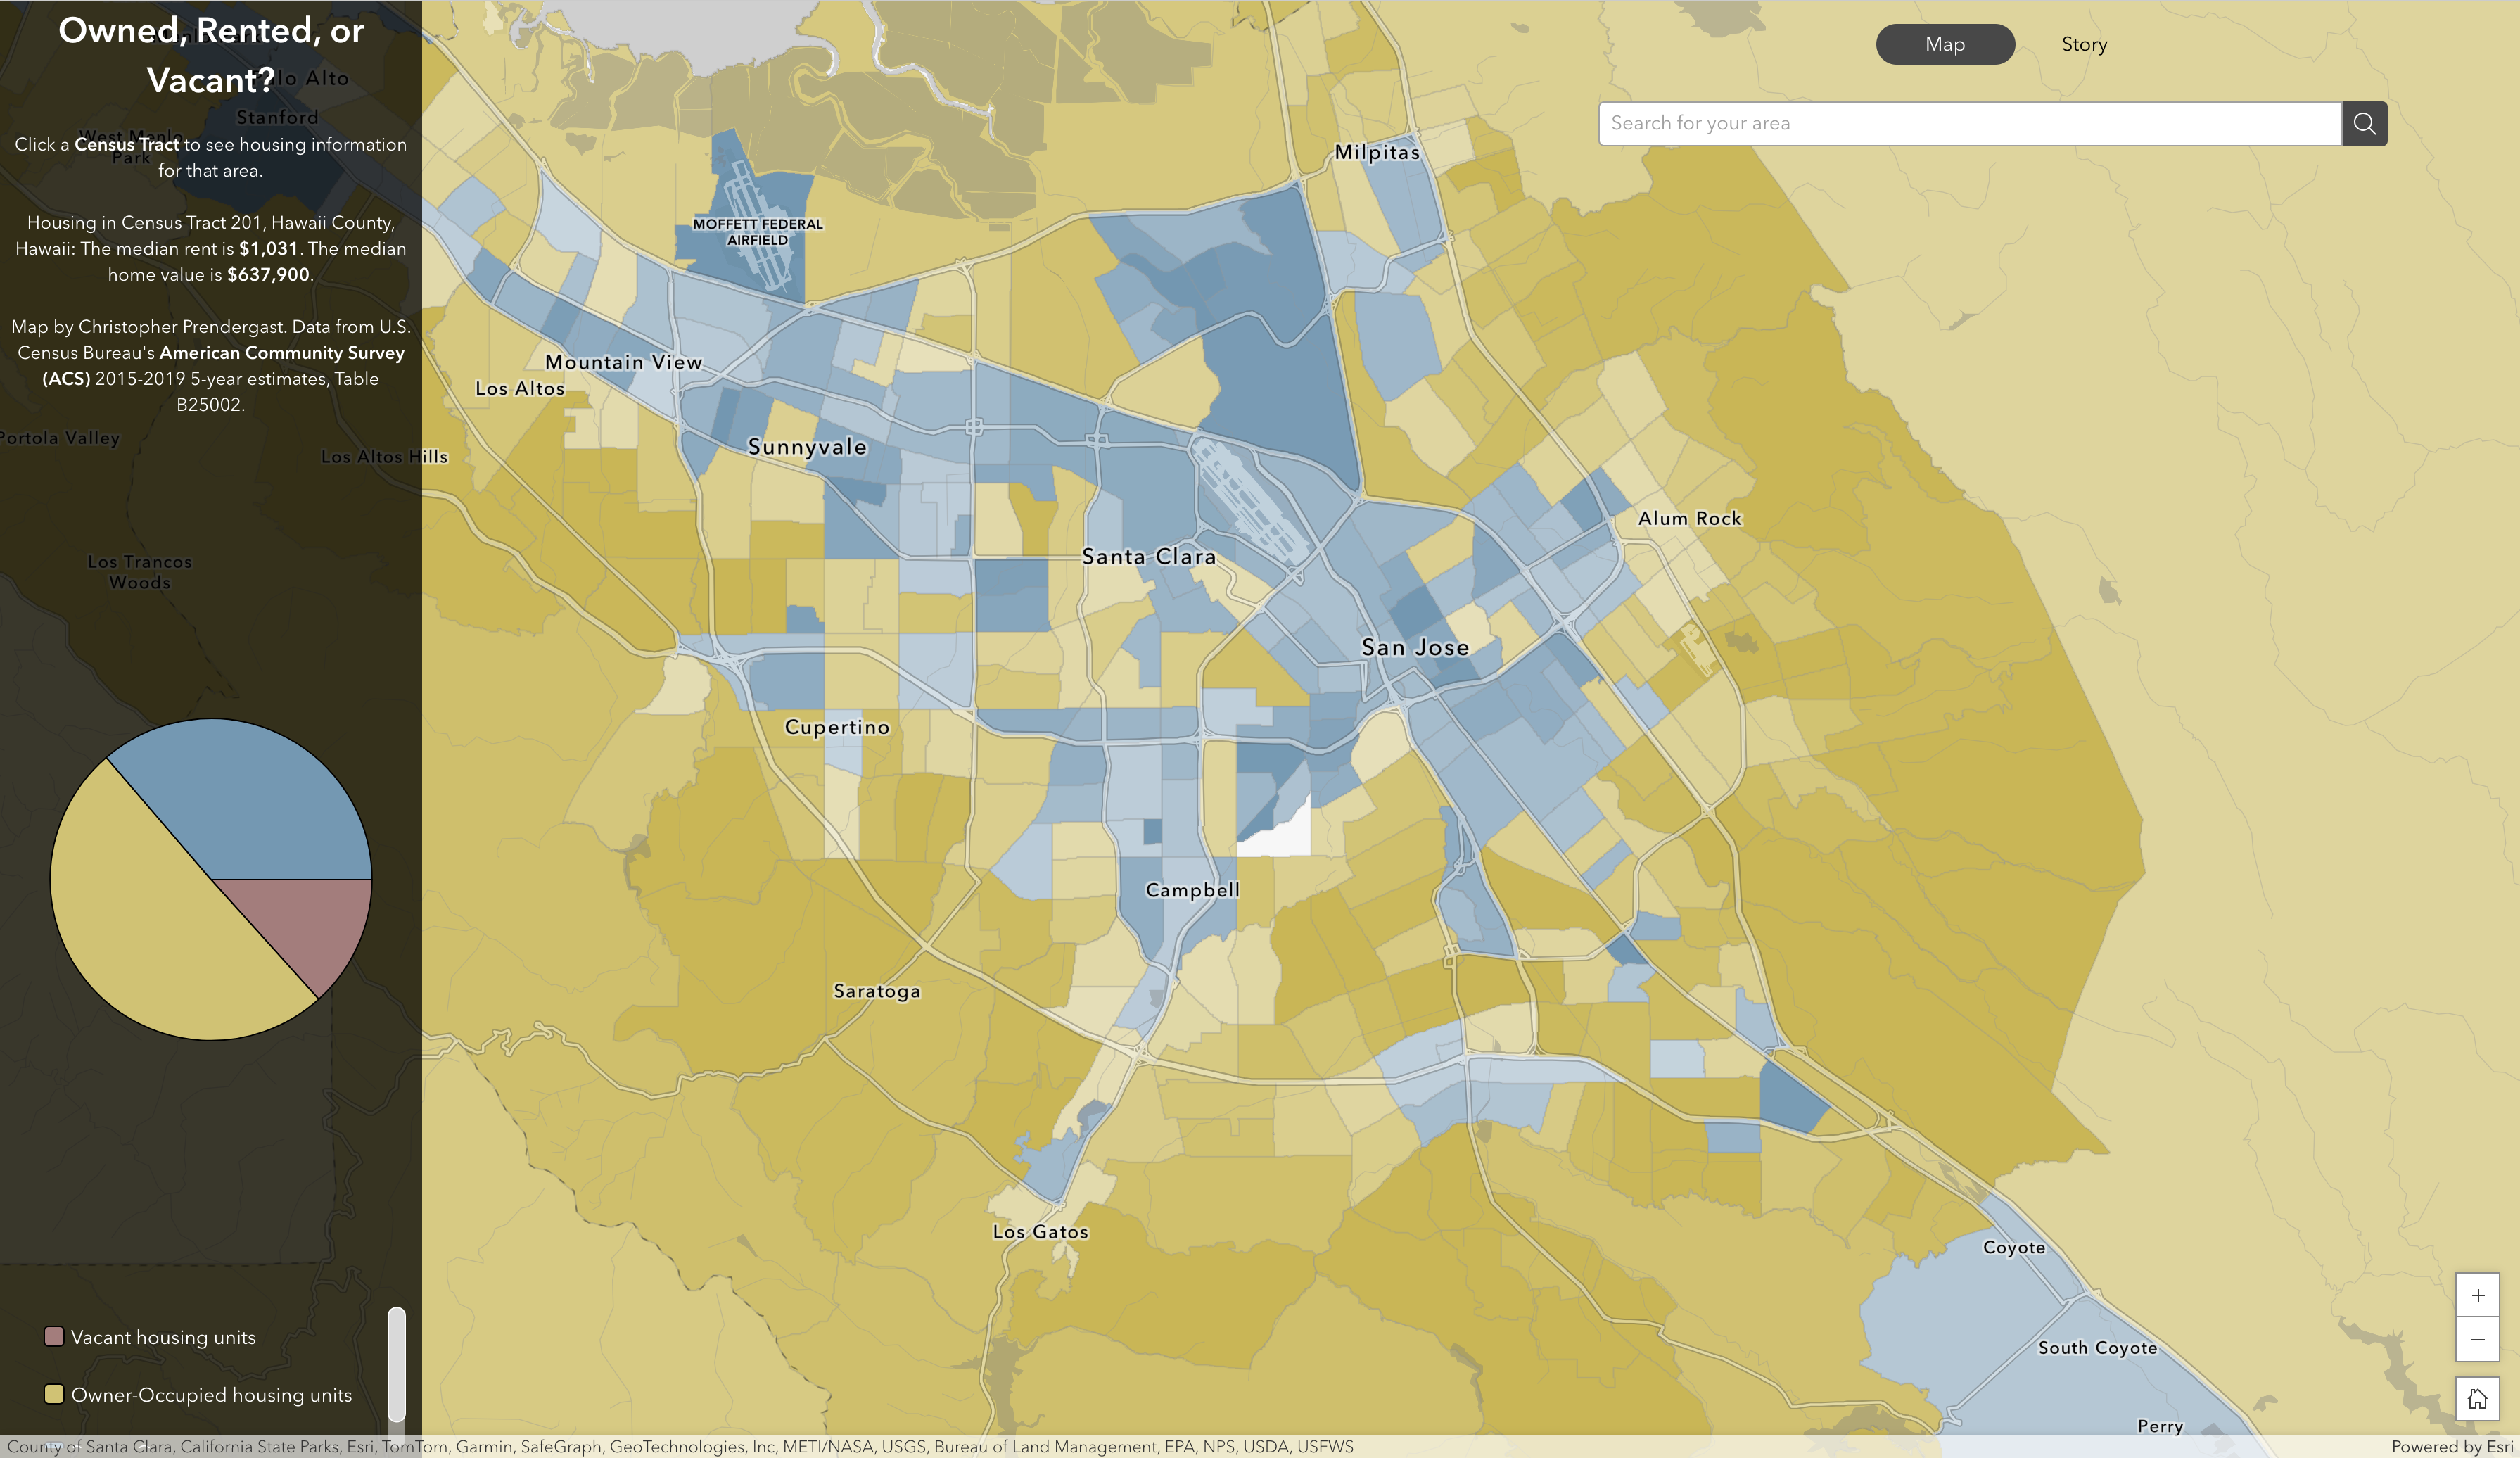
Housing Availability in San Jose
Created with ArcGIS Experience Builder, this page displays housing availability in San Jose.
Go to article | Return to overview
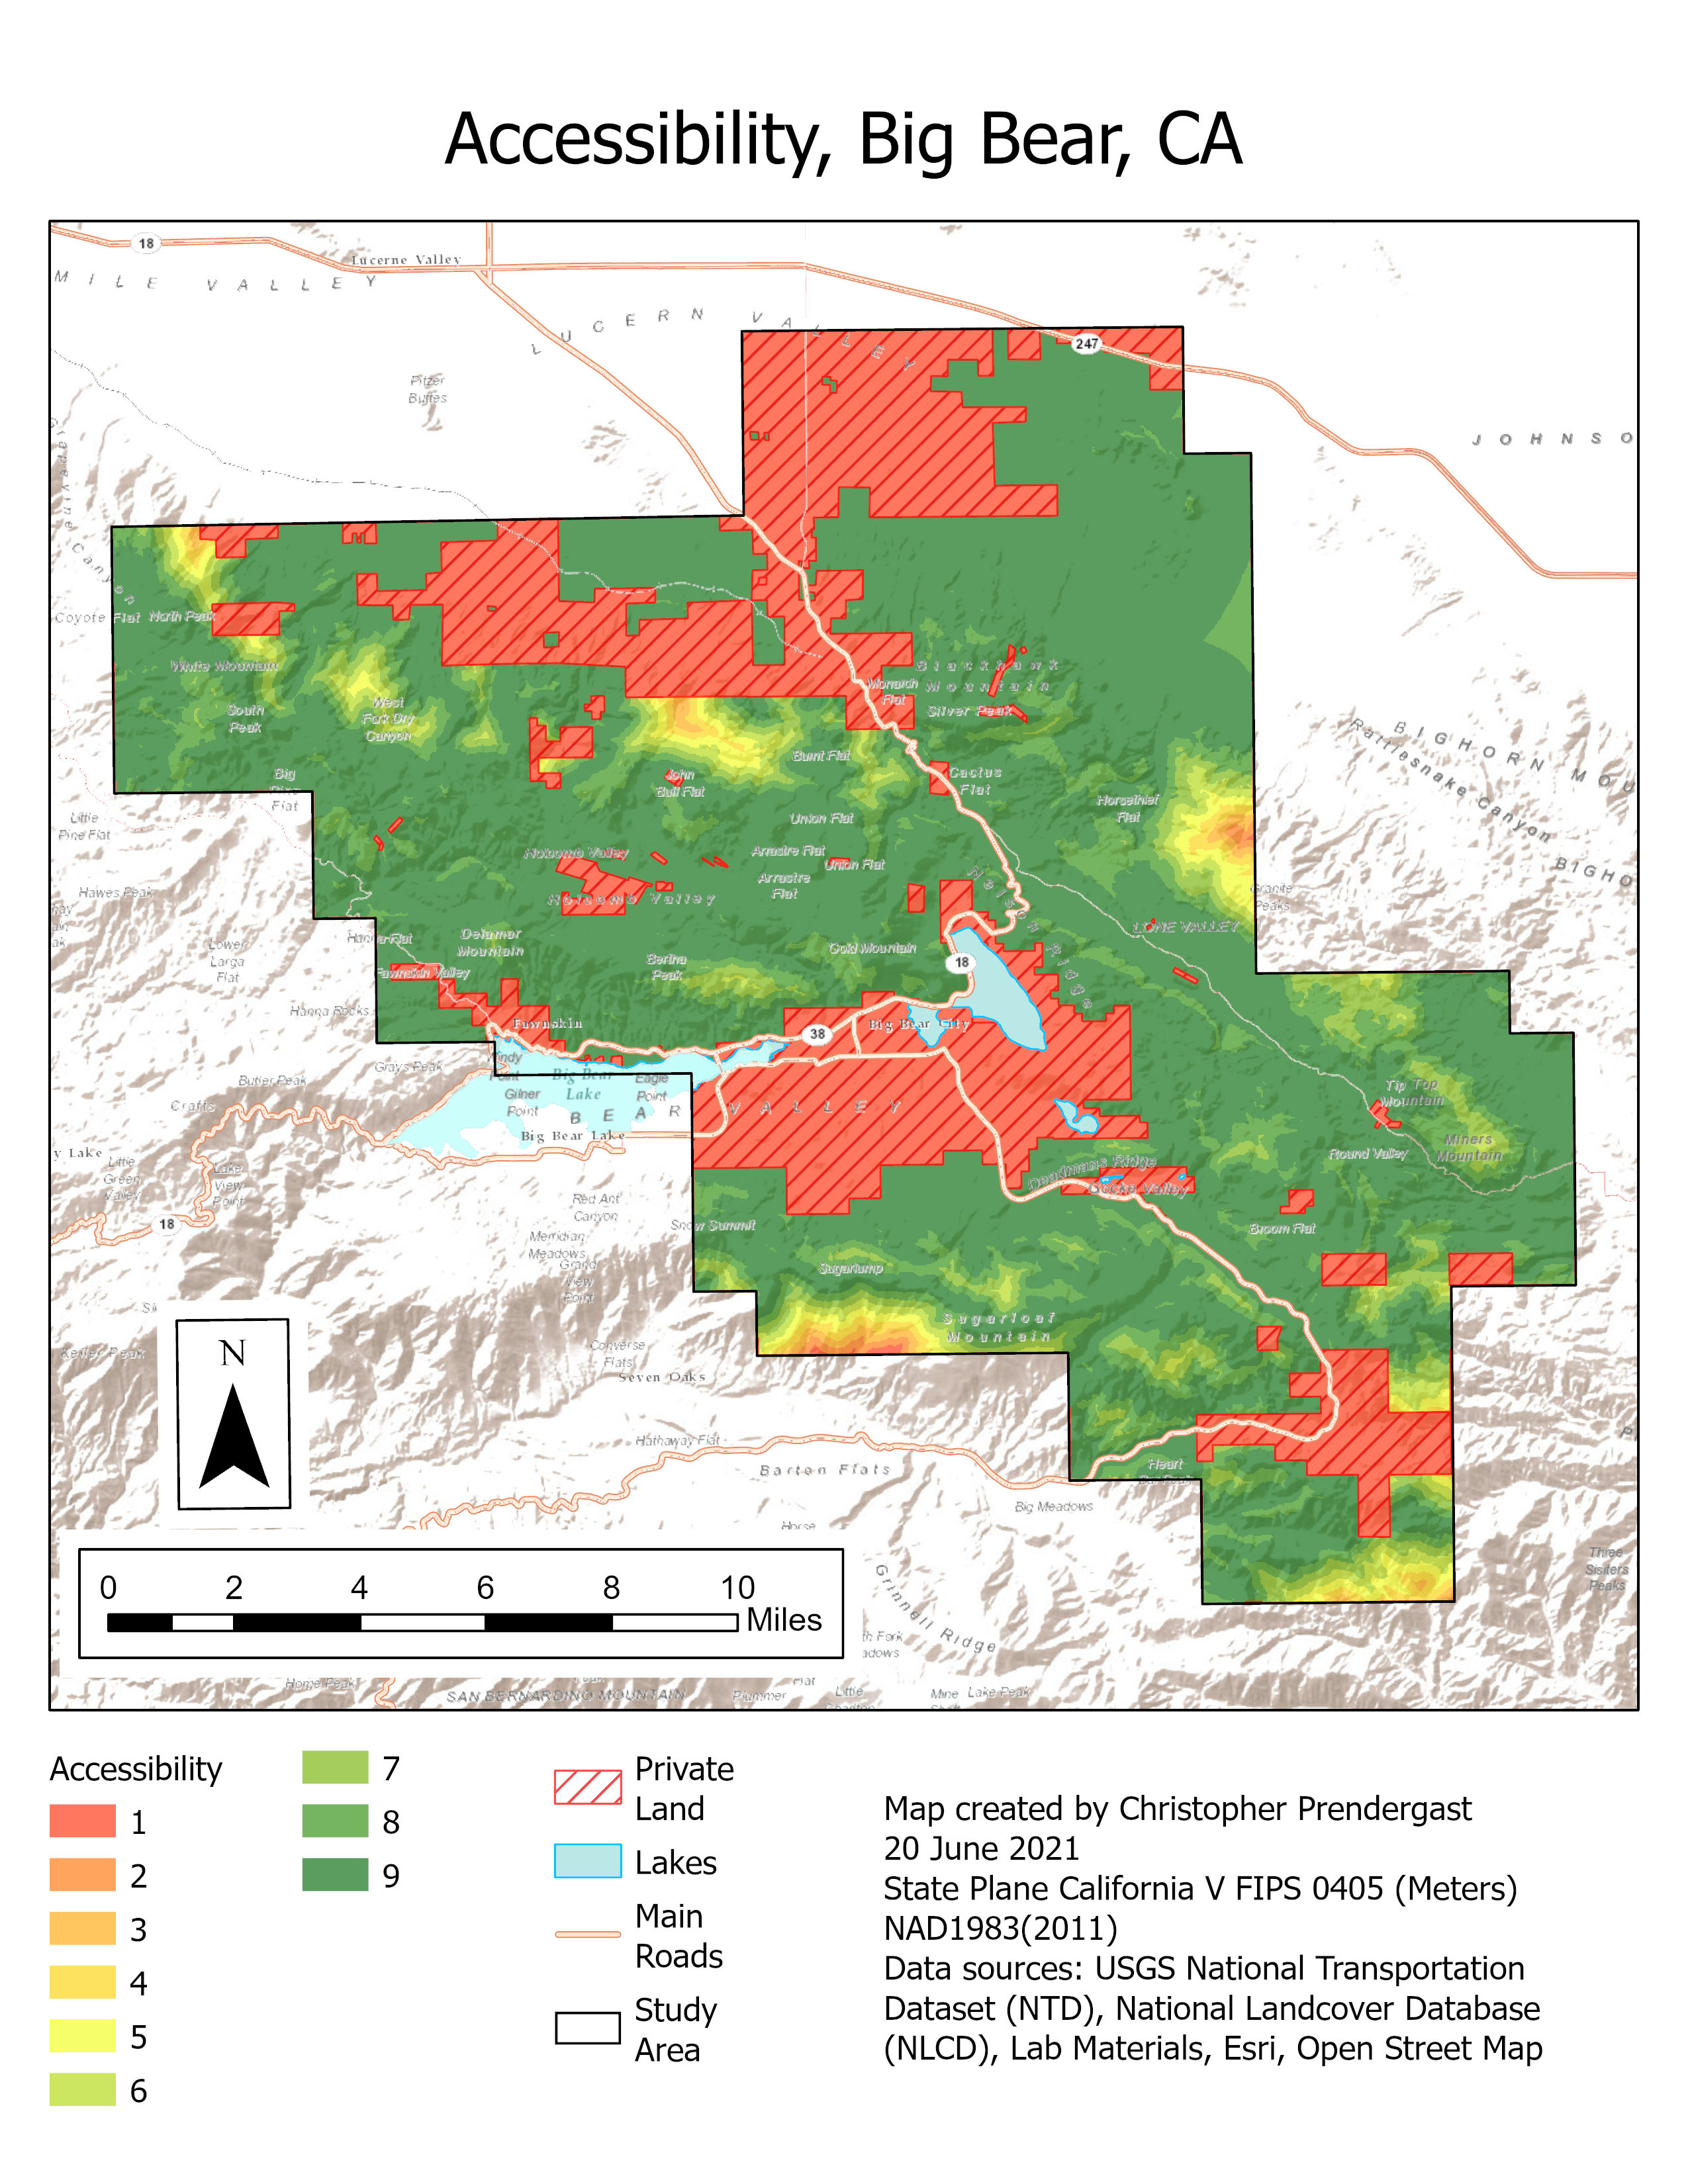
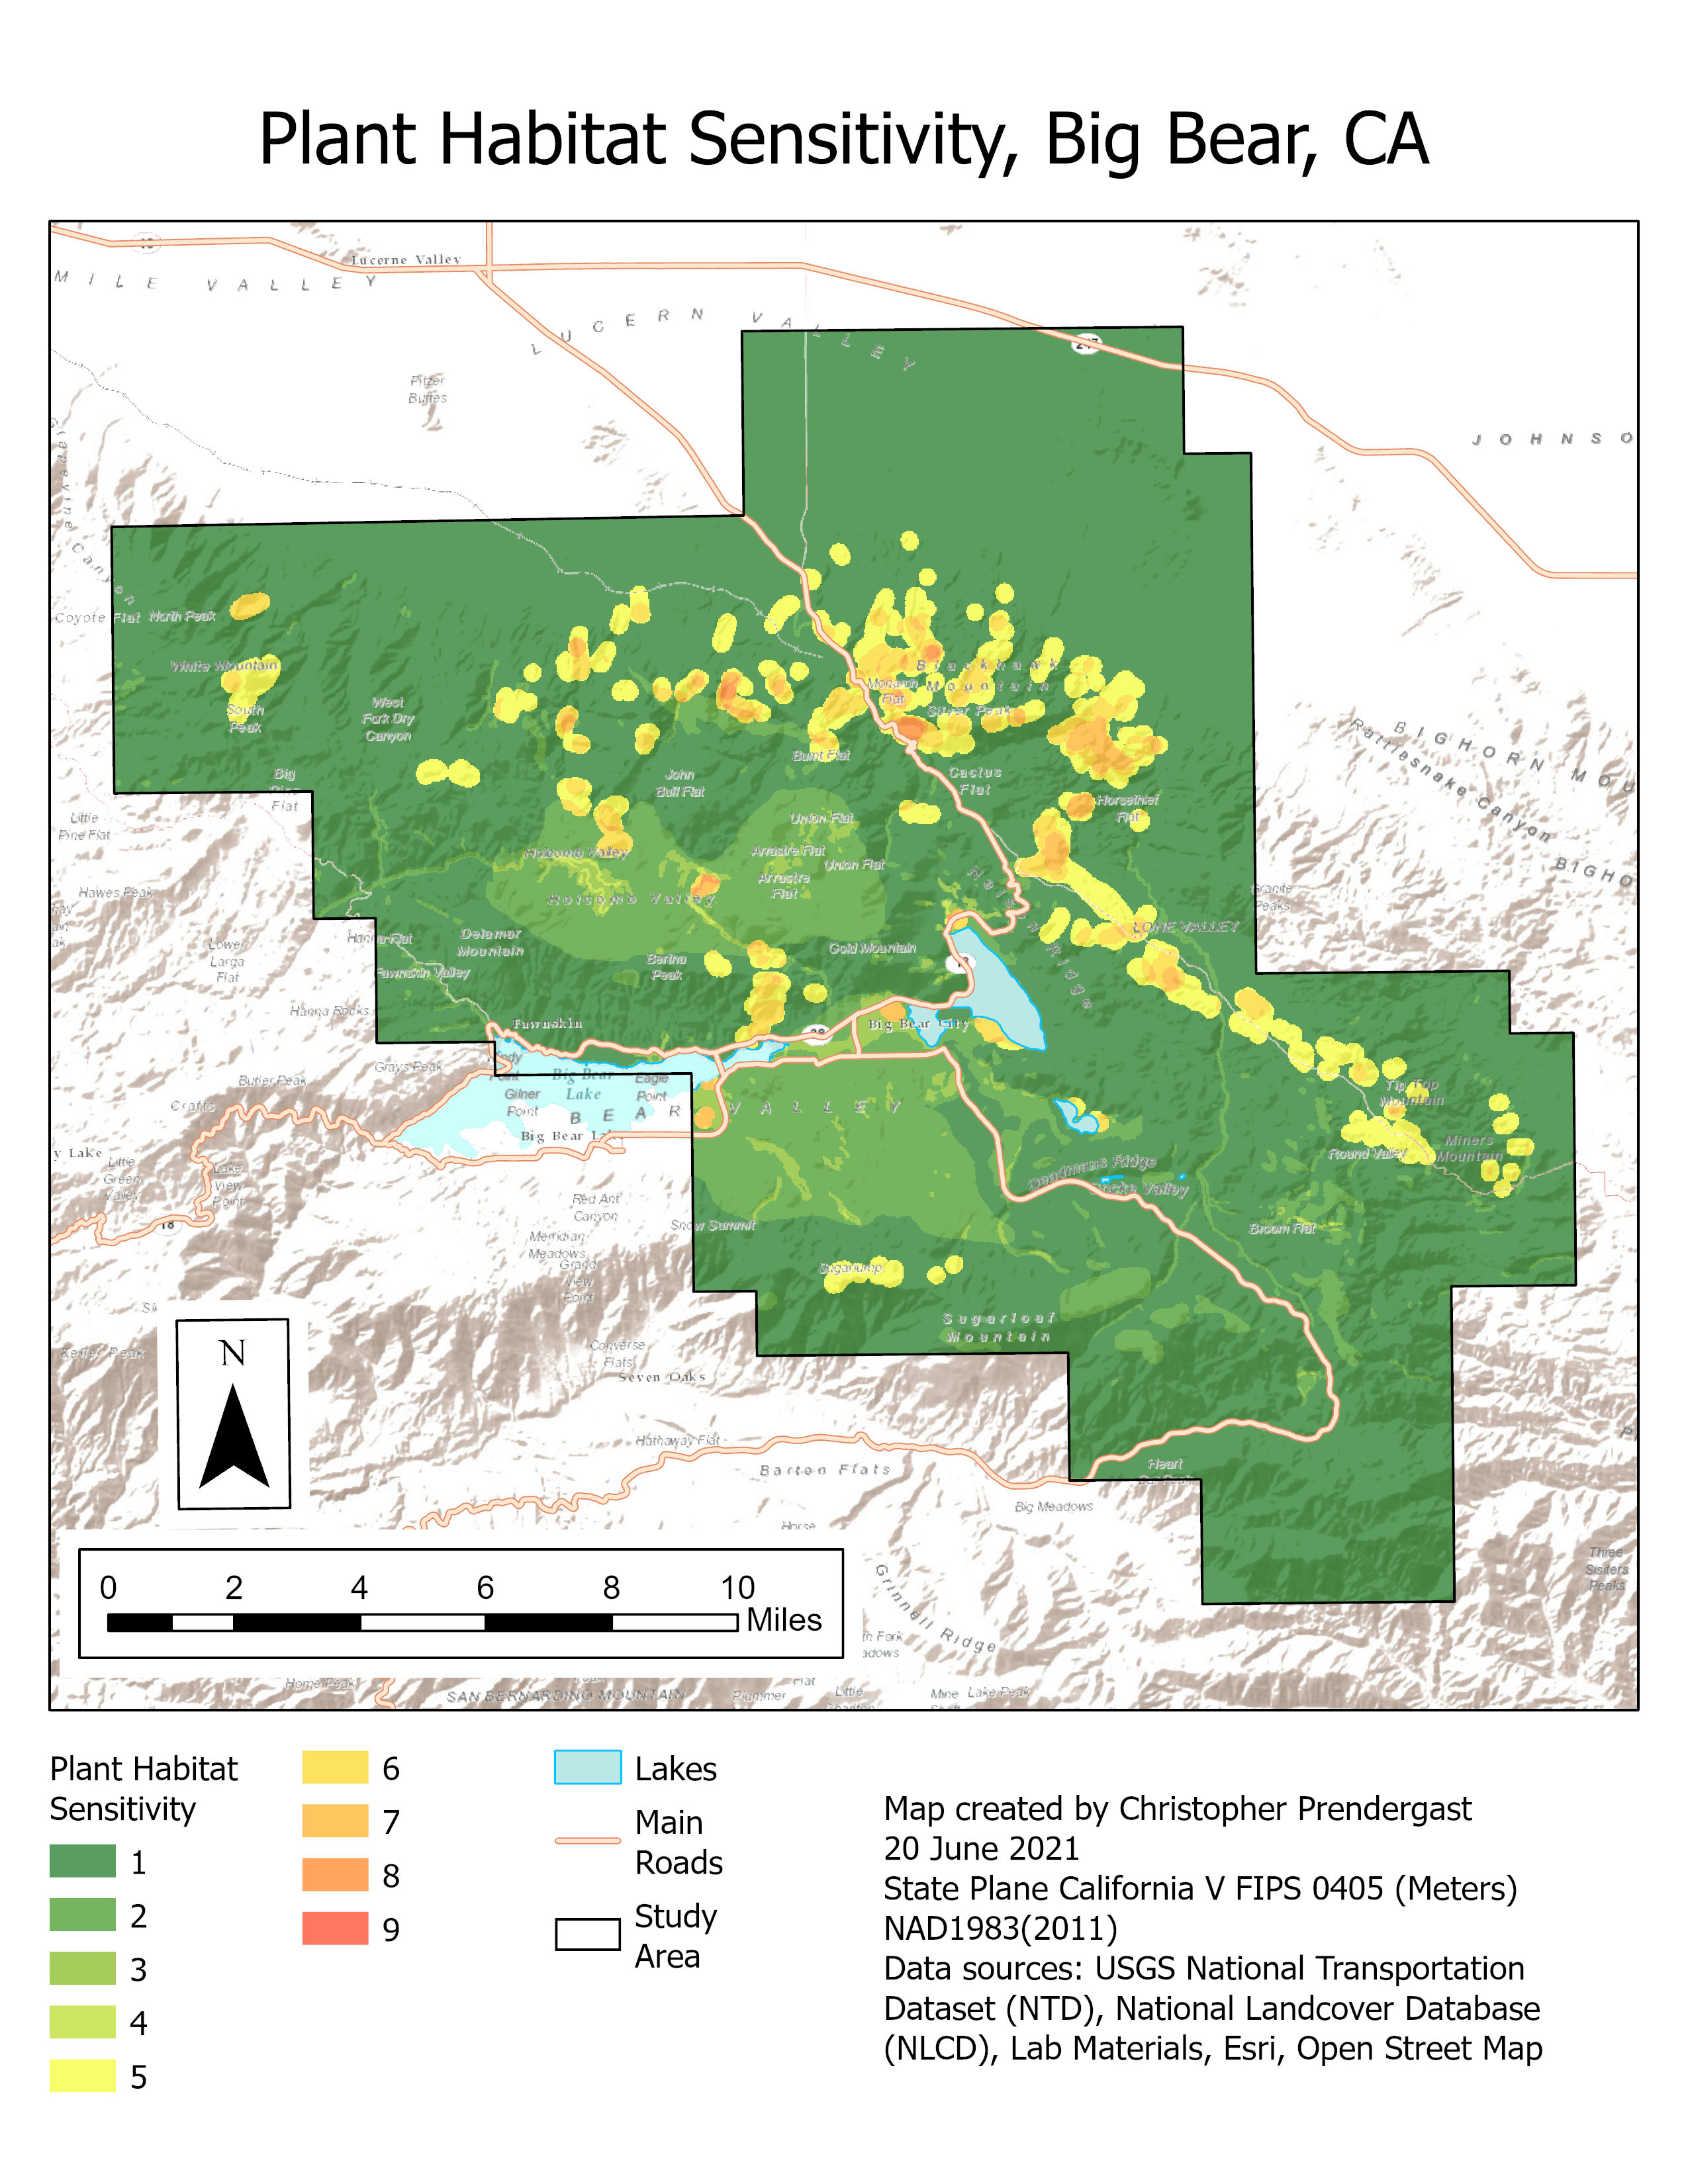
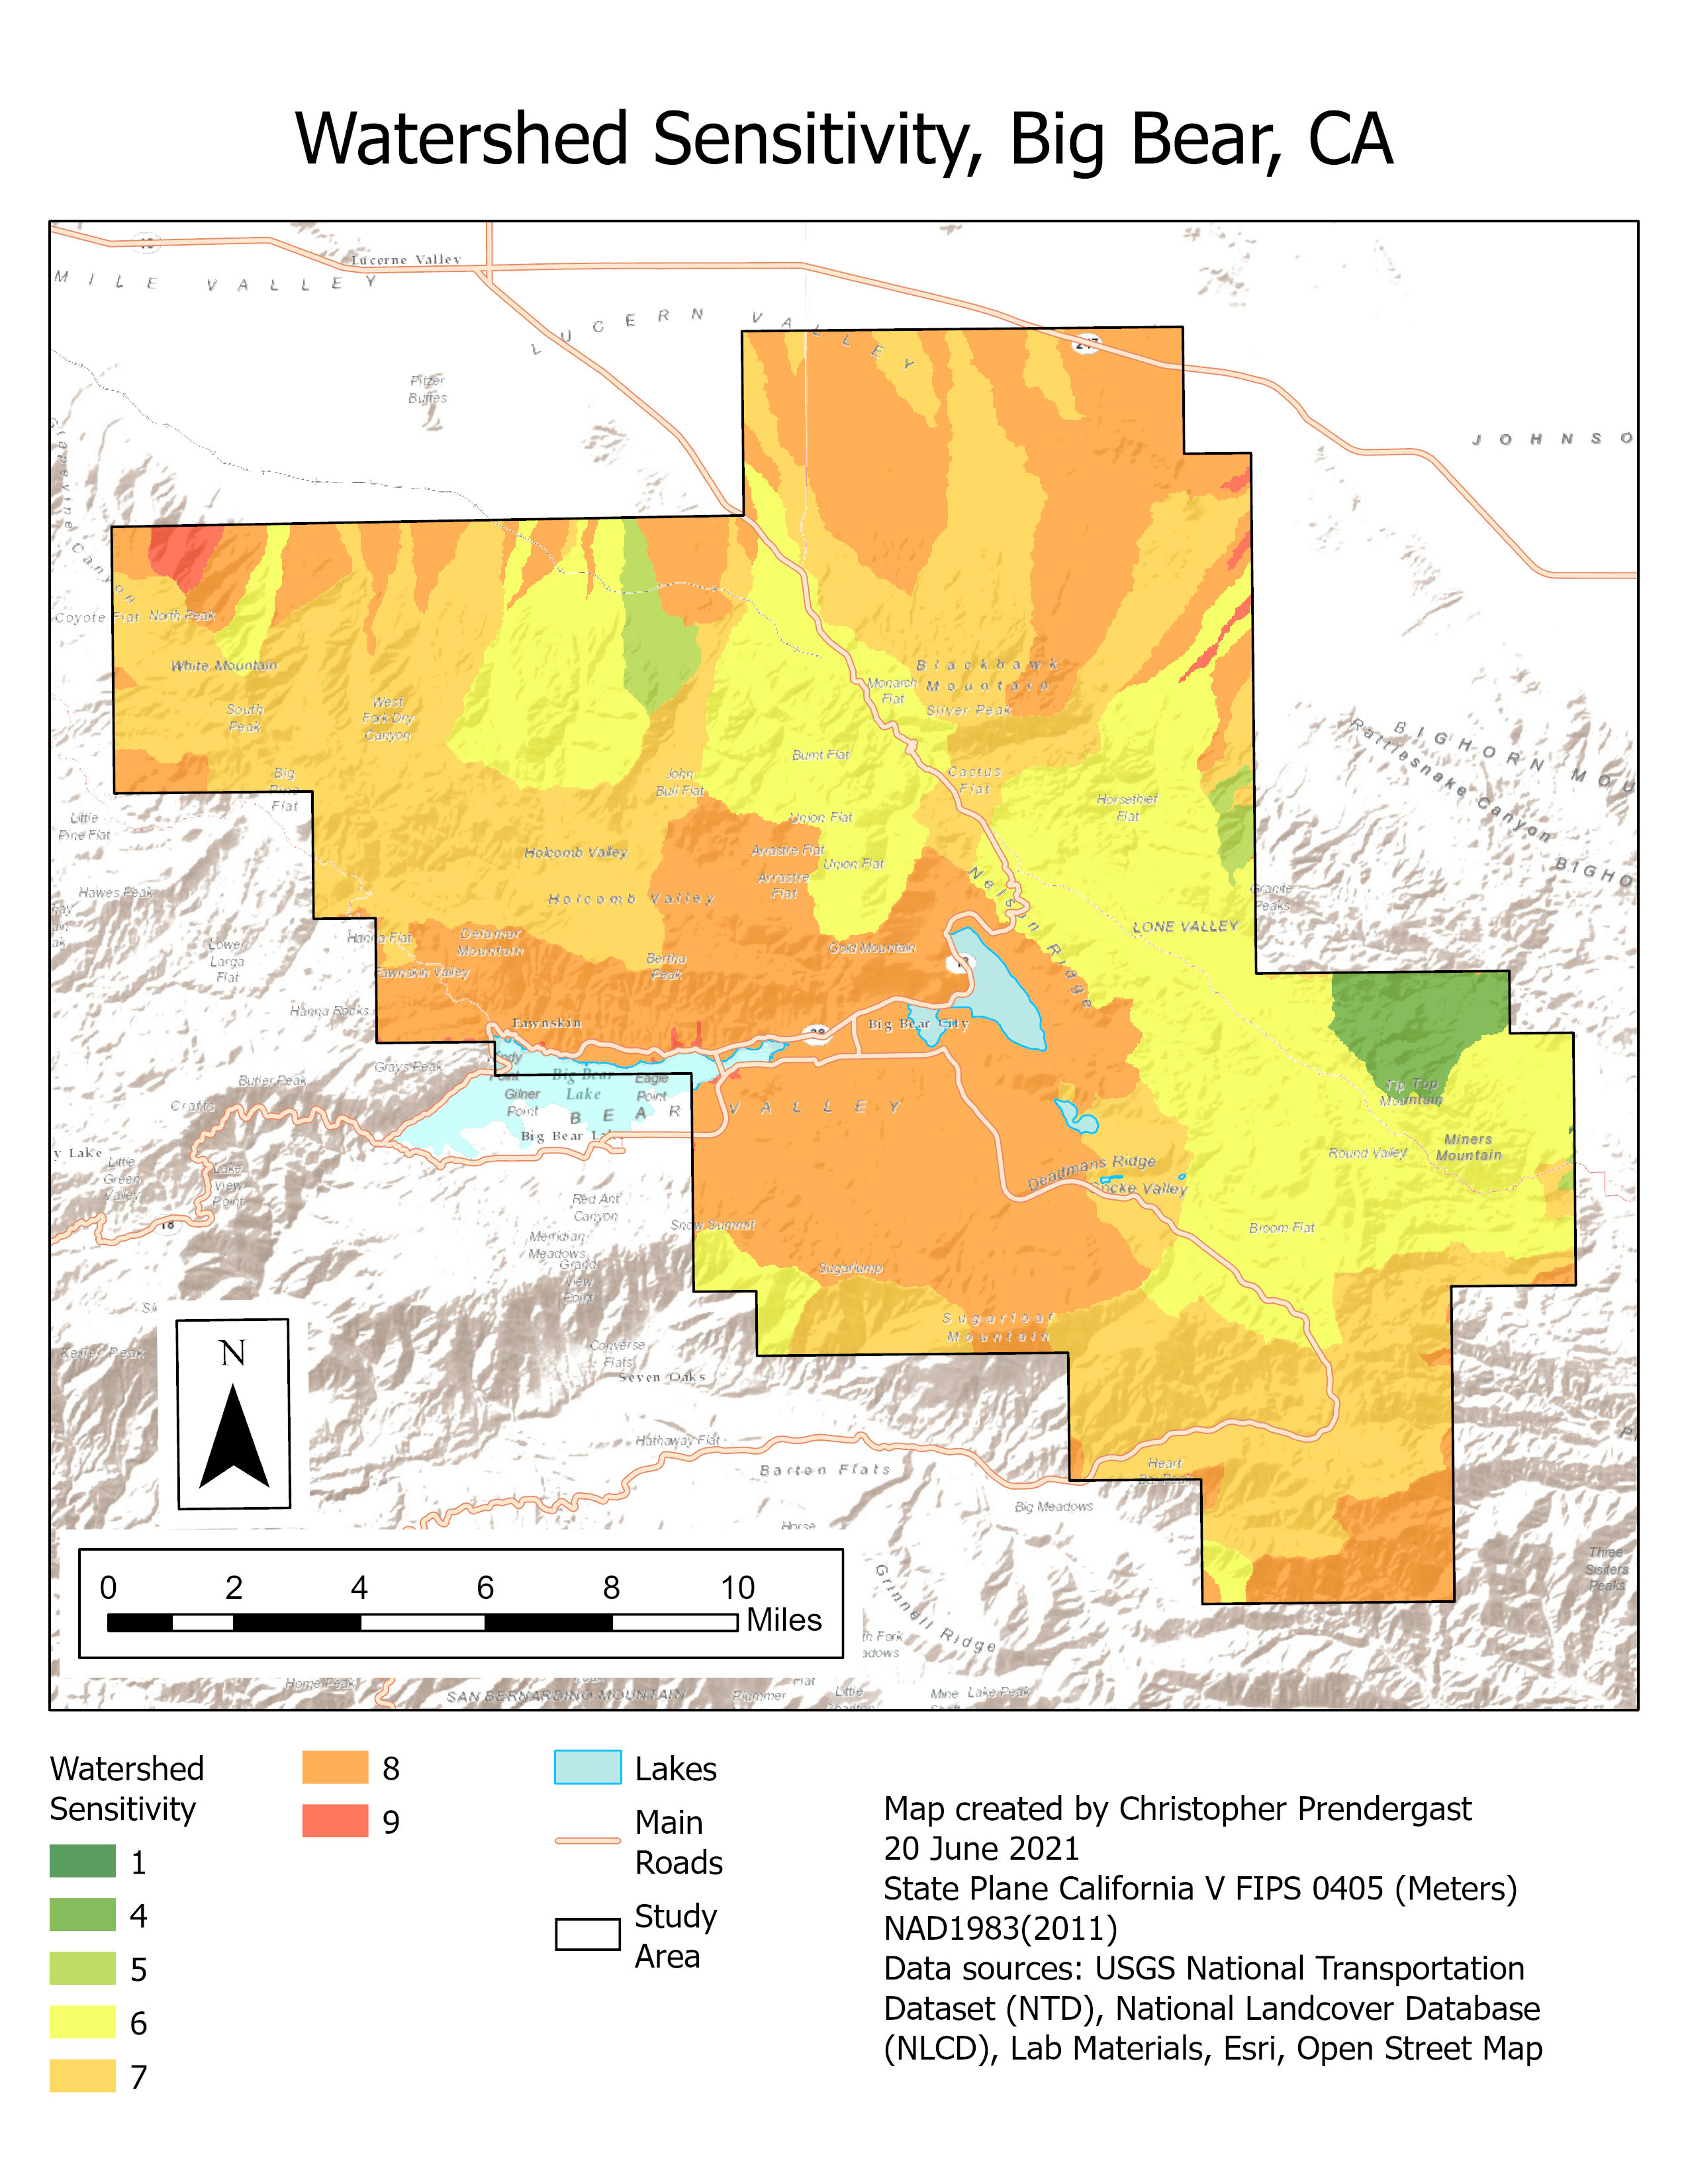
Location Analysis for New Carbonate Mine, San Bernardino National Forest
An analysis to identify suitable potential locations for a new mining operation within an environmentally sensitive area of the San Bernardino National Forest near Big Bear, California. The area has high-grade calcium carbonate depoits.


Go to article | Return to overview
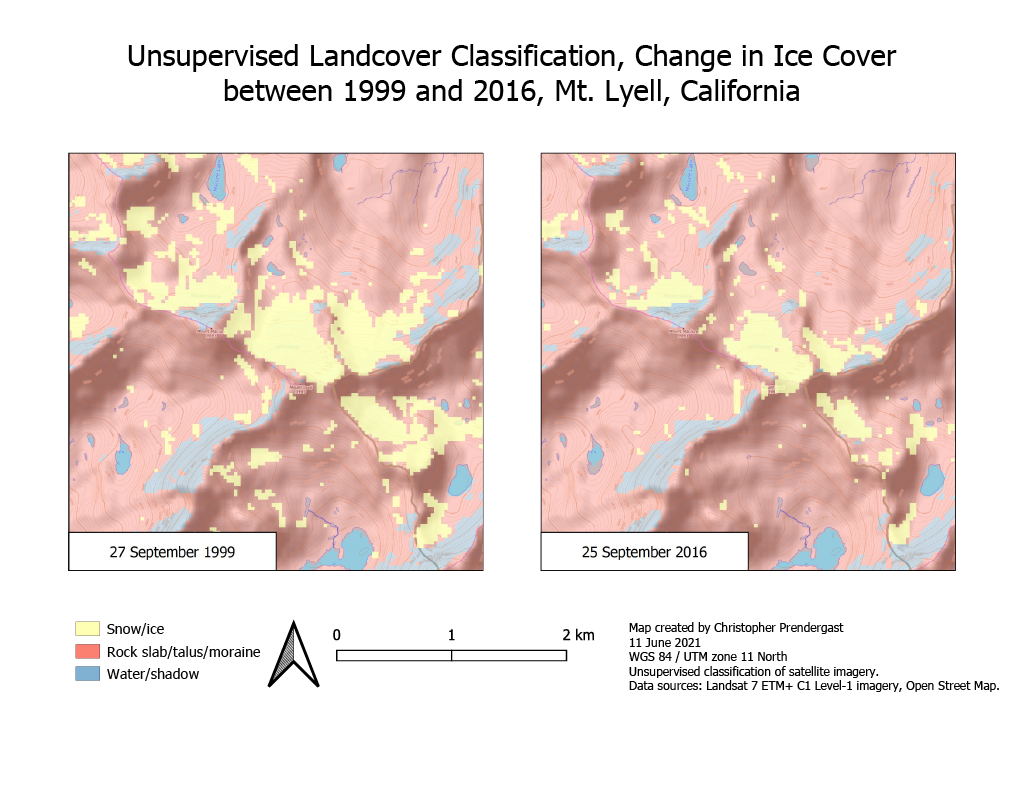
Lyell Glacier, Yosemite National Park
A study was conducted using remote sensing imagery to quantify the change in area over time of the Lyell glacier in Yosemite National Park, California.
Go to article | Return to overview
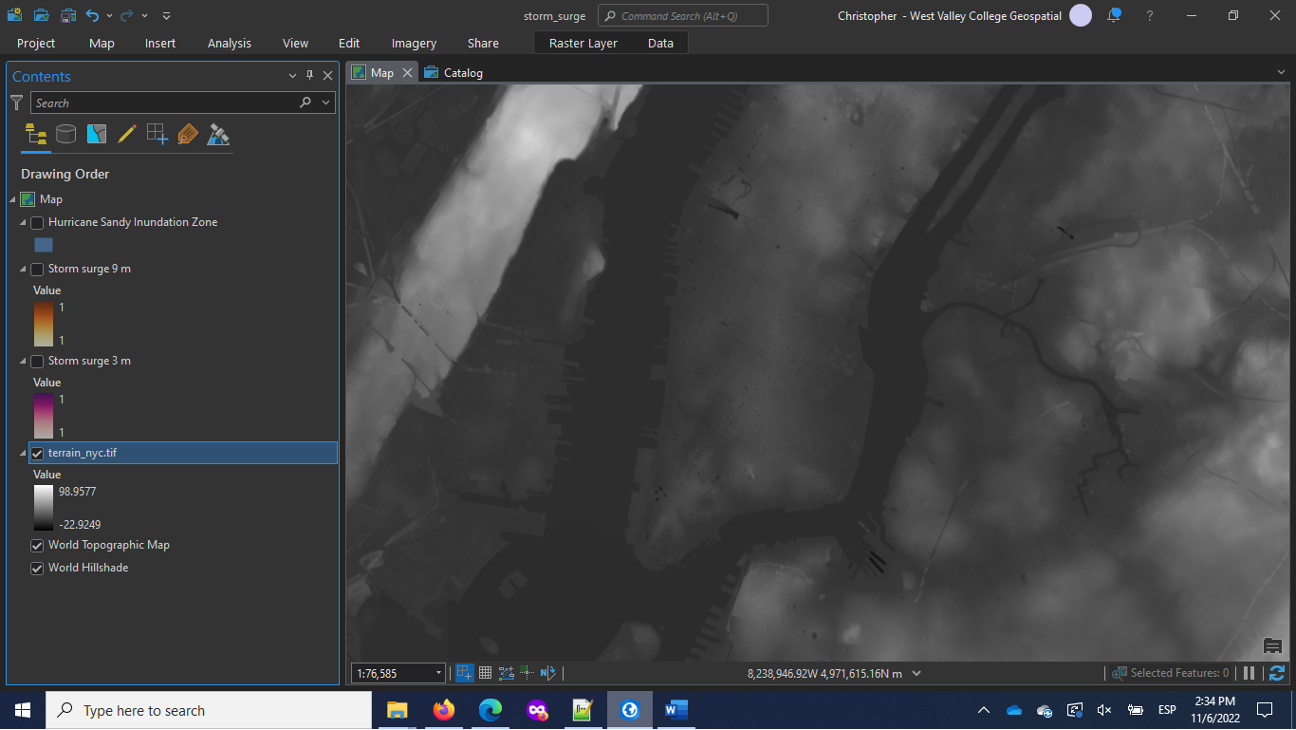
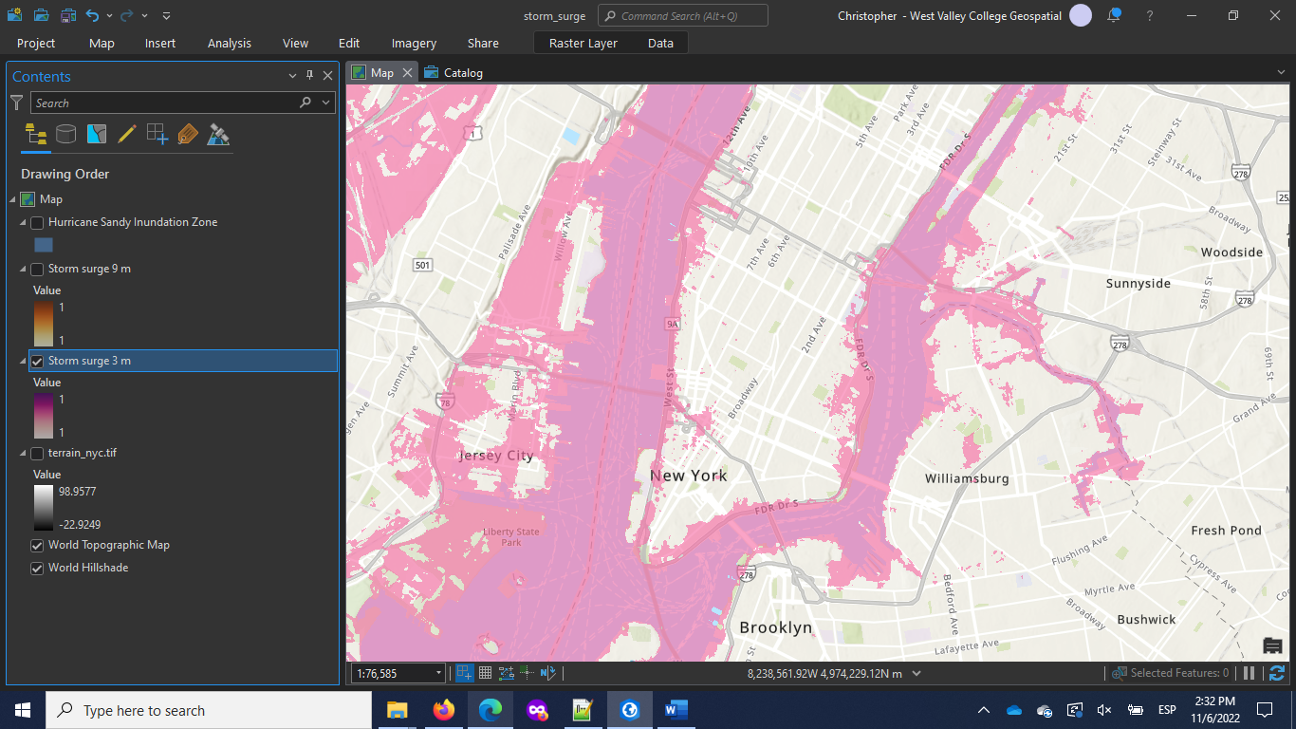
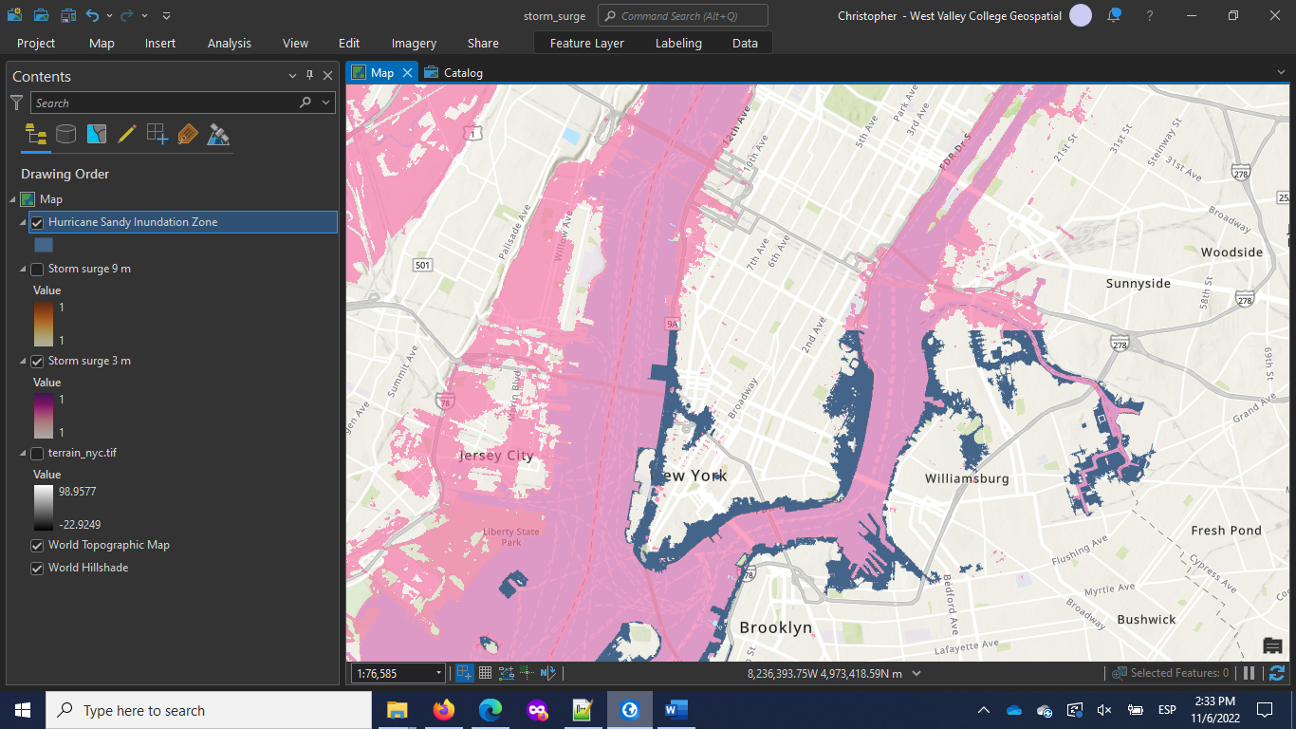
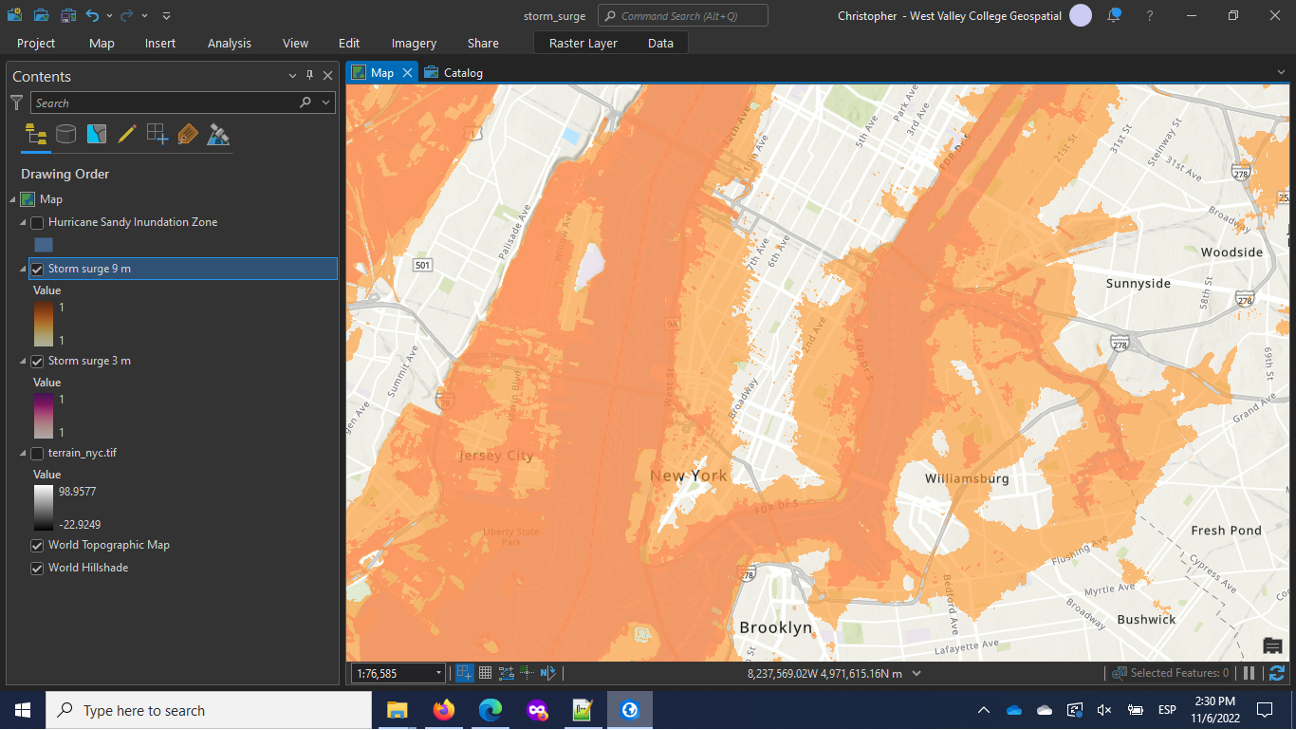
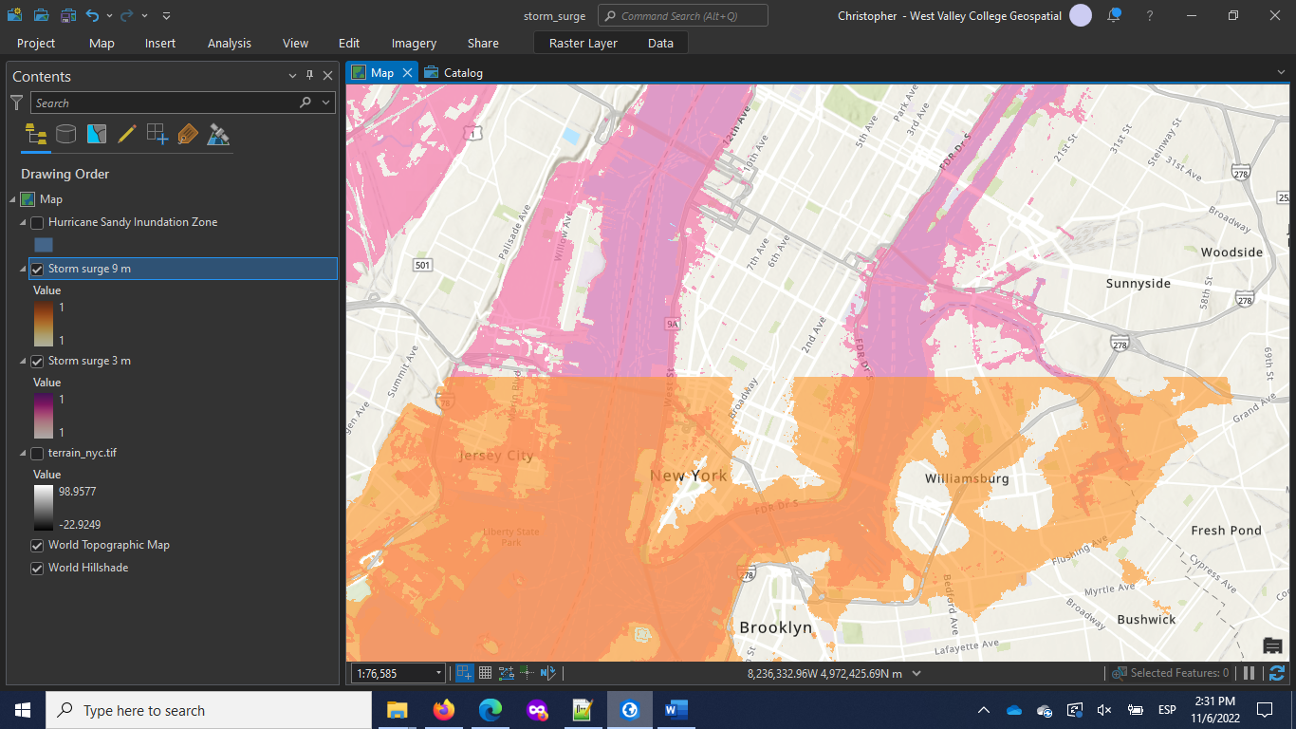
Map Hurricane Storm Surge, New York City
Maps show how storm surges of different magnitudes could impact New York City. A base elevation map provides terrain context, while modeled 3-meter and 9-meter surge maps highlight areas at risk from moderate and extreme hurricanes. The Hurricane Sandy inundation map validates the 3-meter scenario with real-world data, and overlaying the 3- and 9-meter surges demonstrates how flooding risk increases dramatically with storm intensity.
Go to article | Return to overview
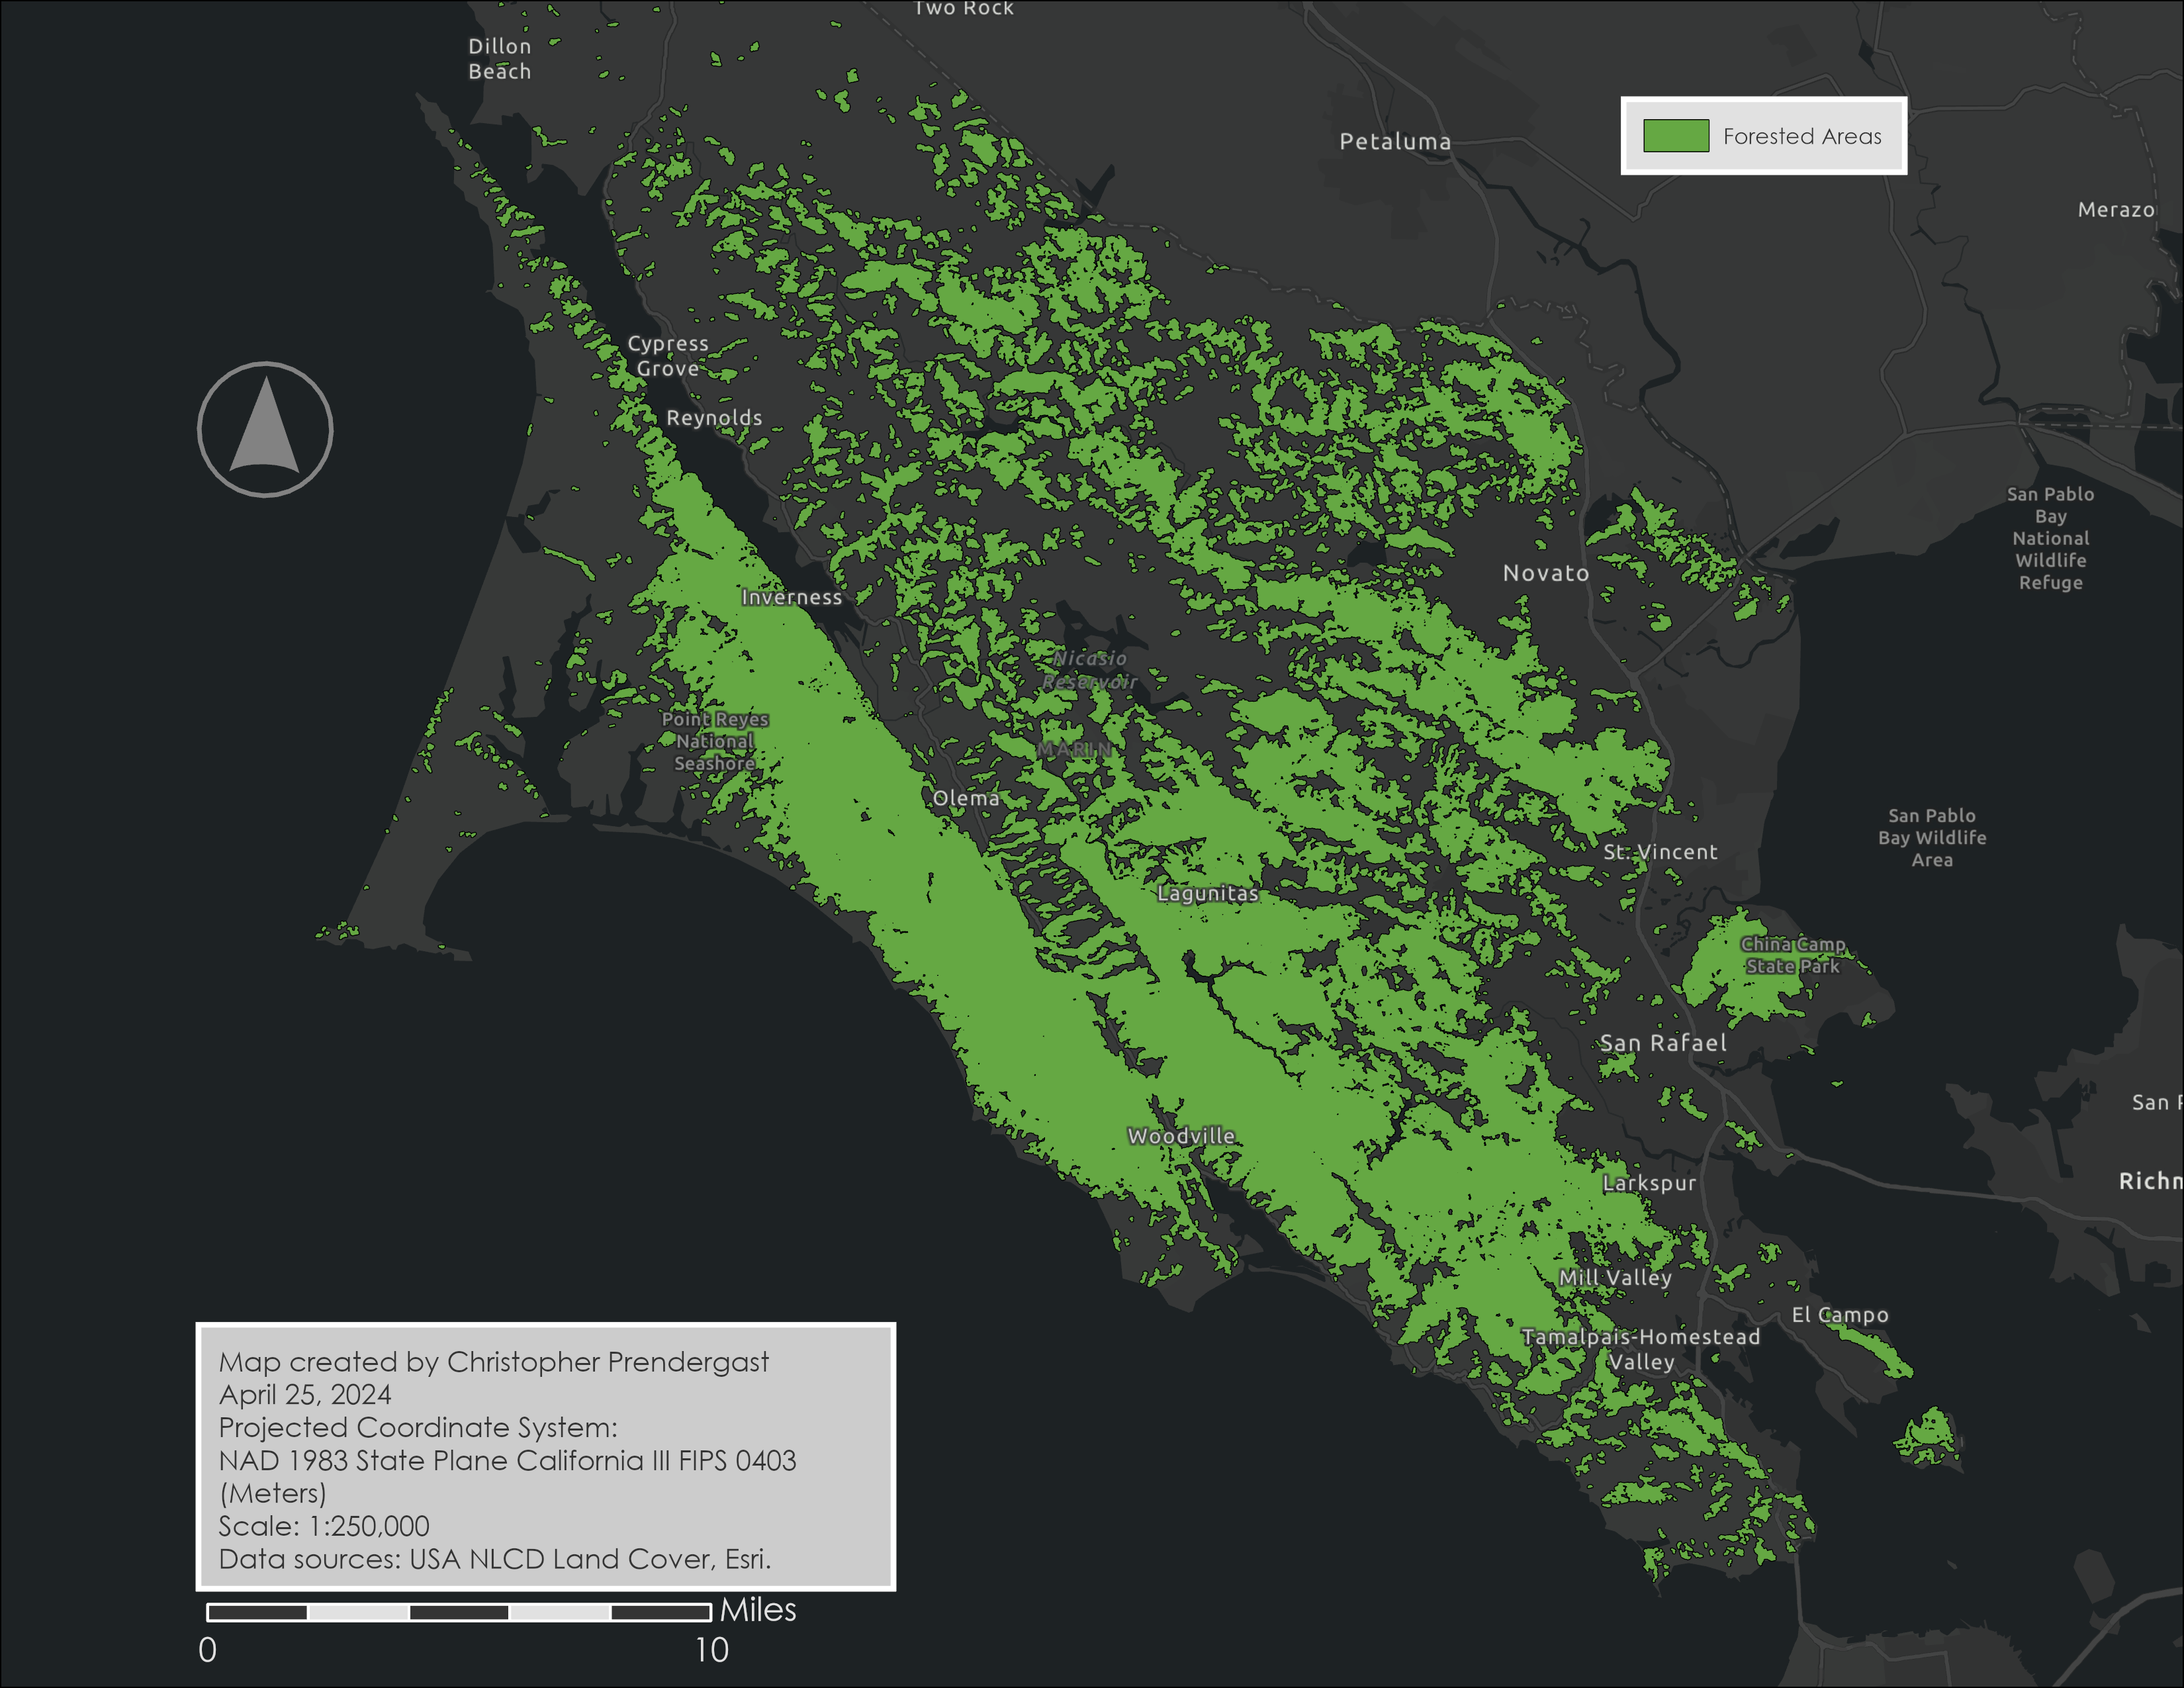
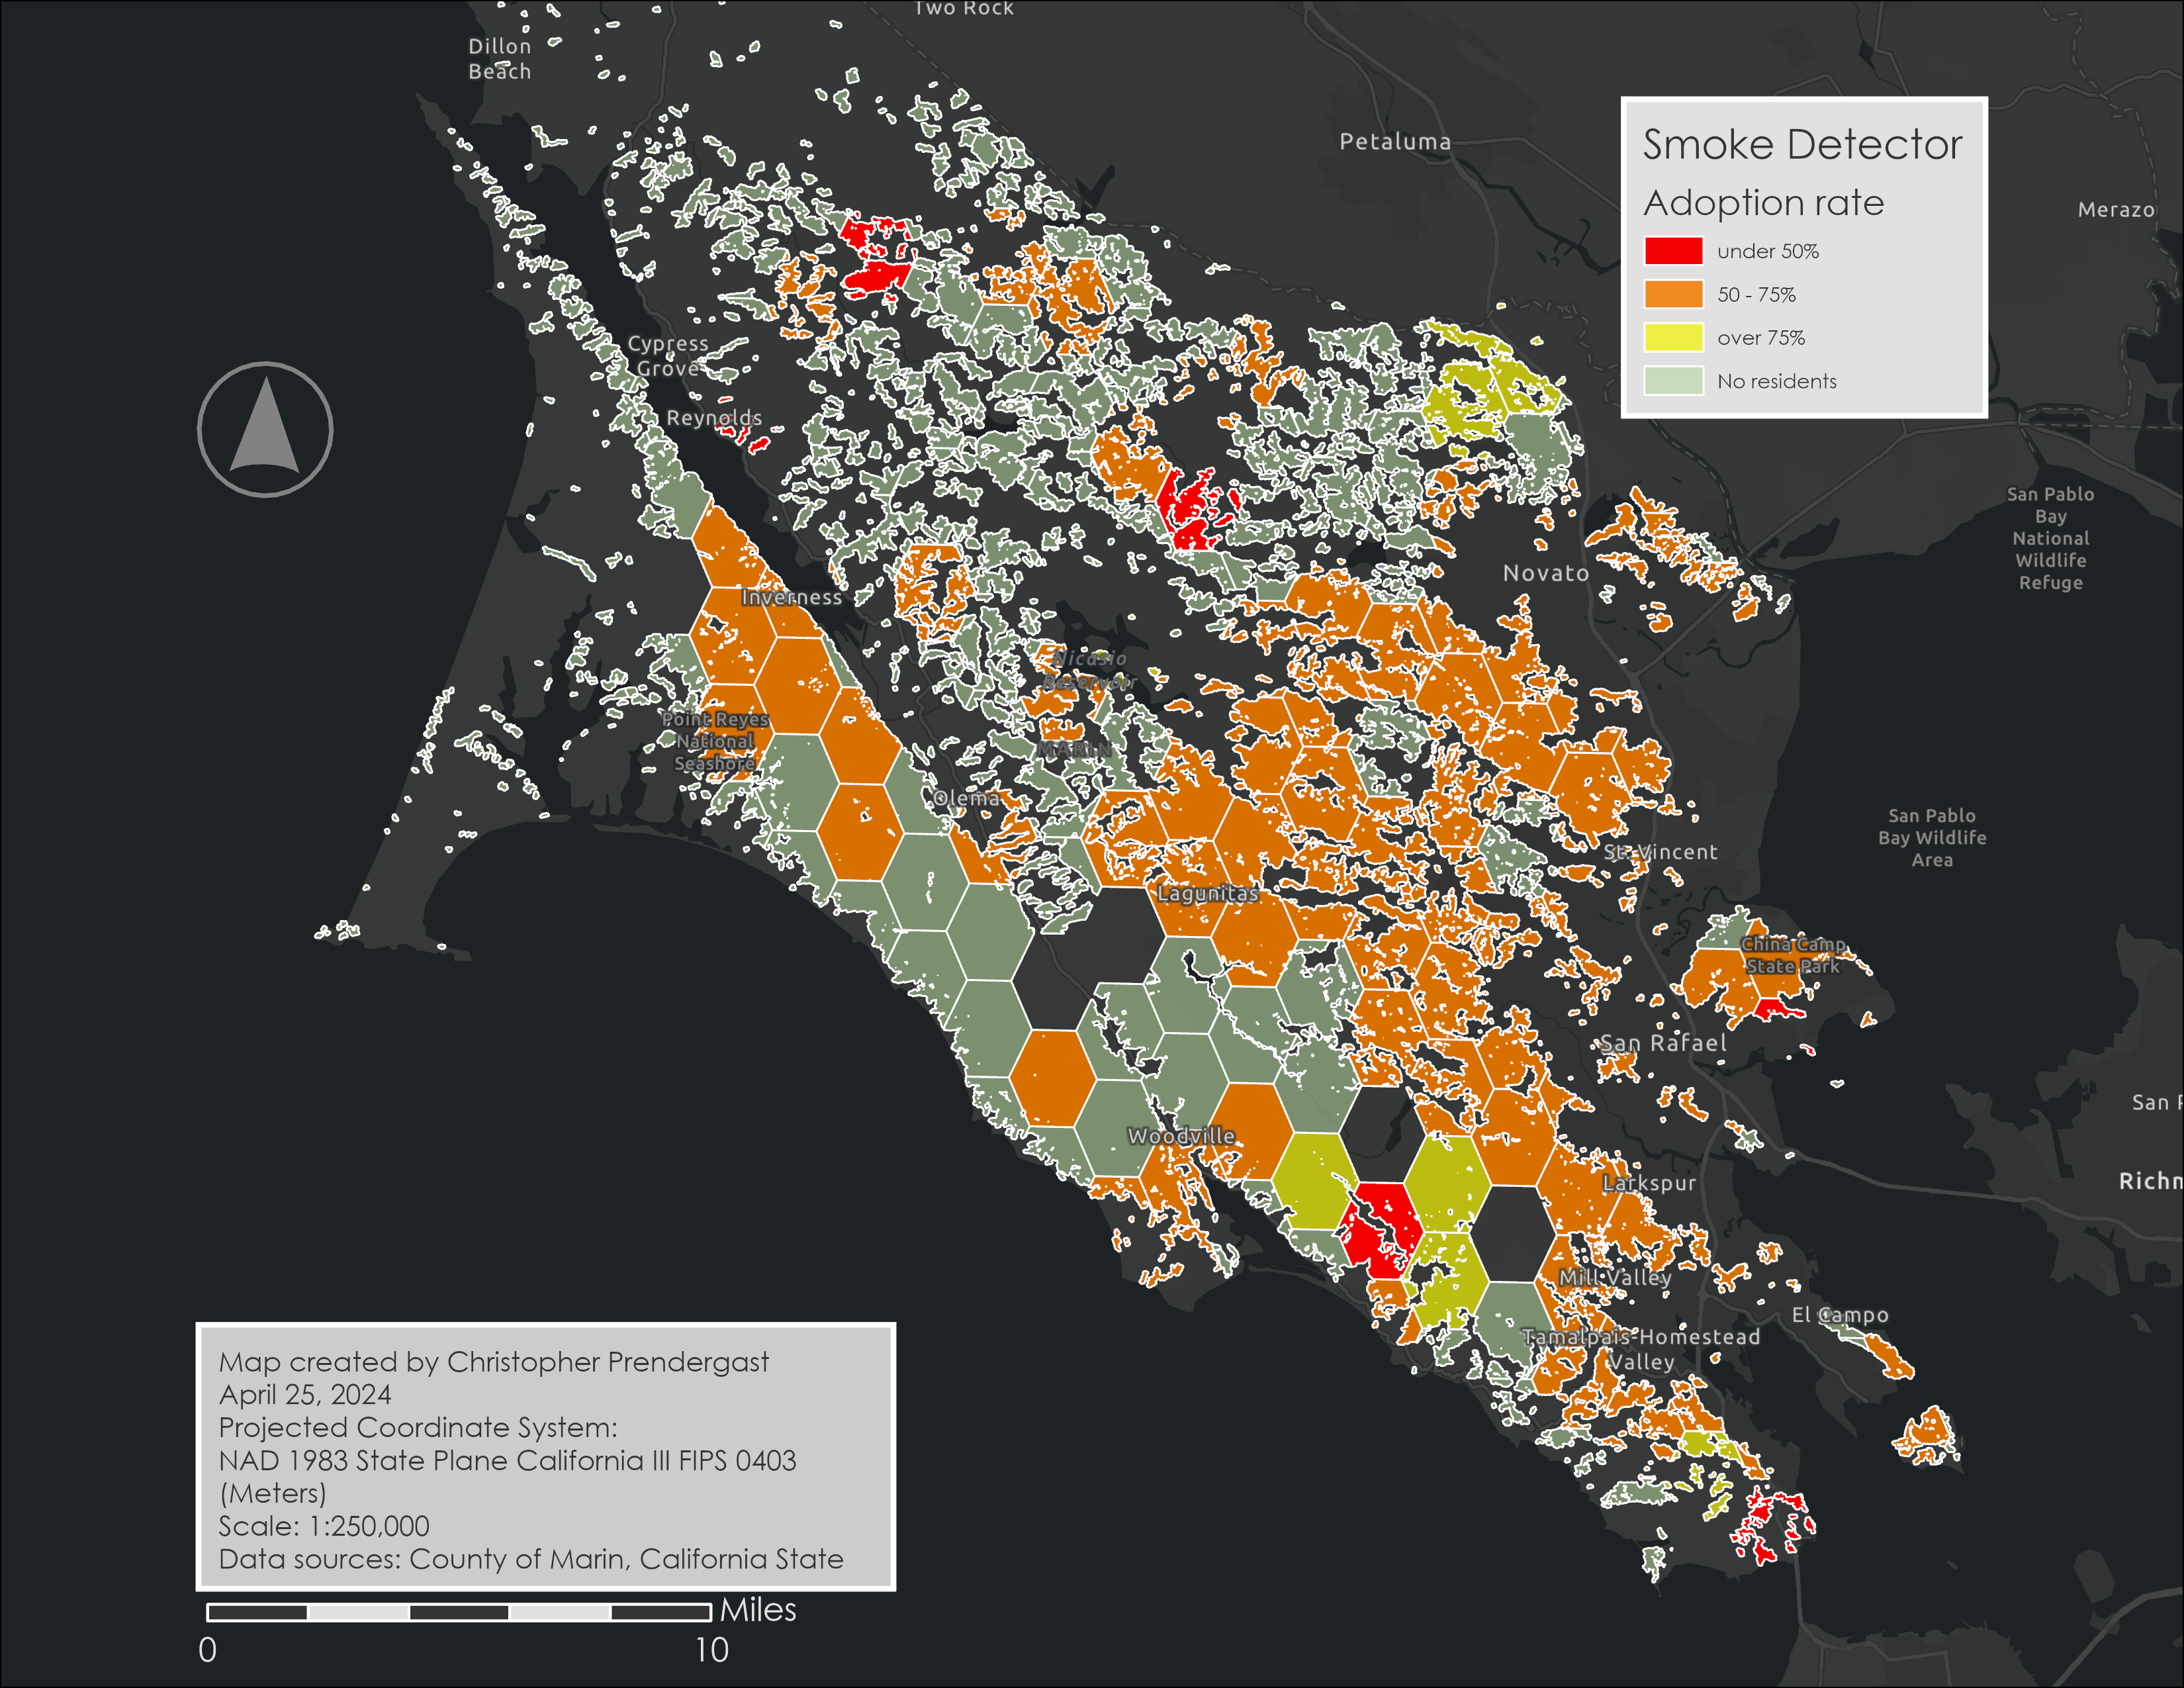
Marin Smoke Detectors
The maps in this project provide a visual overview of fire preparedness in Marin County by illustrating the distribution of households with smoke detectors across different areas. The primary map highlights the percentage of households equipped with smoke detectors in various neighborhoods. The second maps focus on forested regions, offering context and helping officials understand where fire risks are higher and which communities may need targeted education or resources. These maps together support informed decision-making by visually identifying vulnerable areas and guiding fire prevention efforts.
Go to article | Return to overview
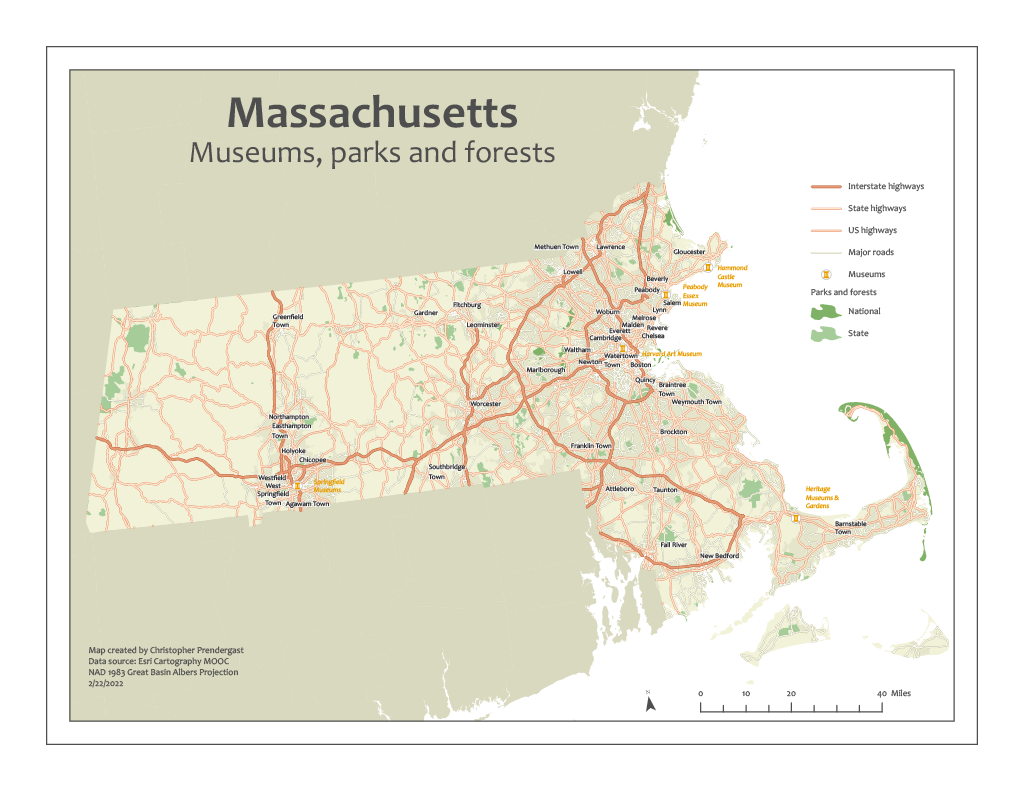
Massachusetts Parks
Map showing museums, parks, and forests in Massachusetts.
Go to article | Return to overview
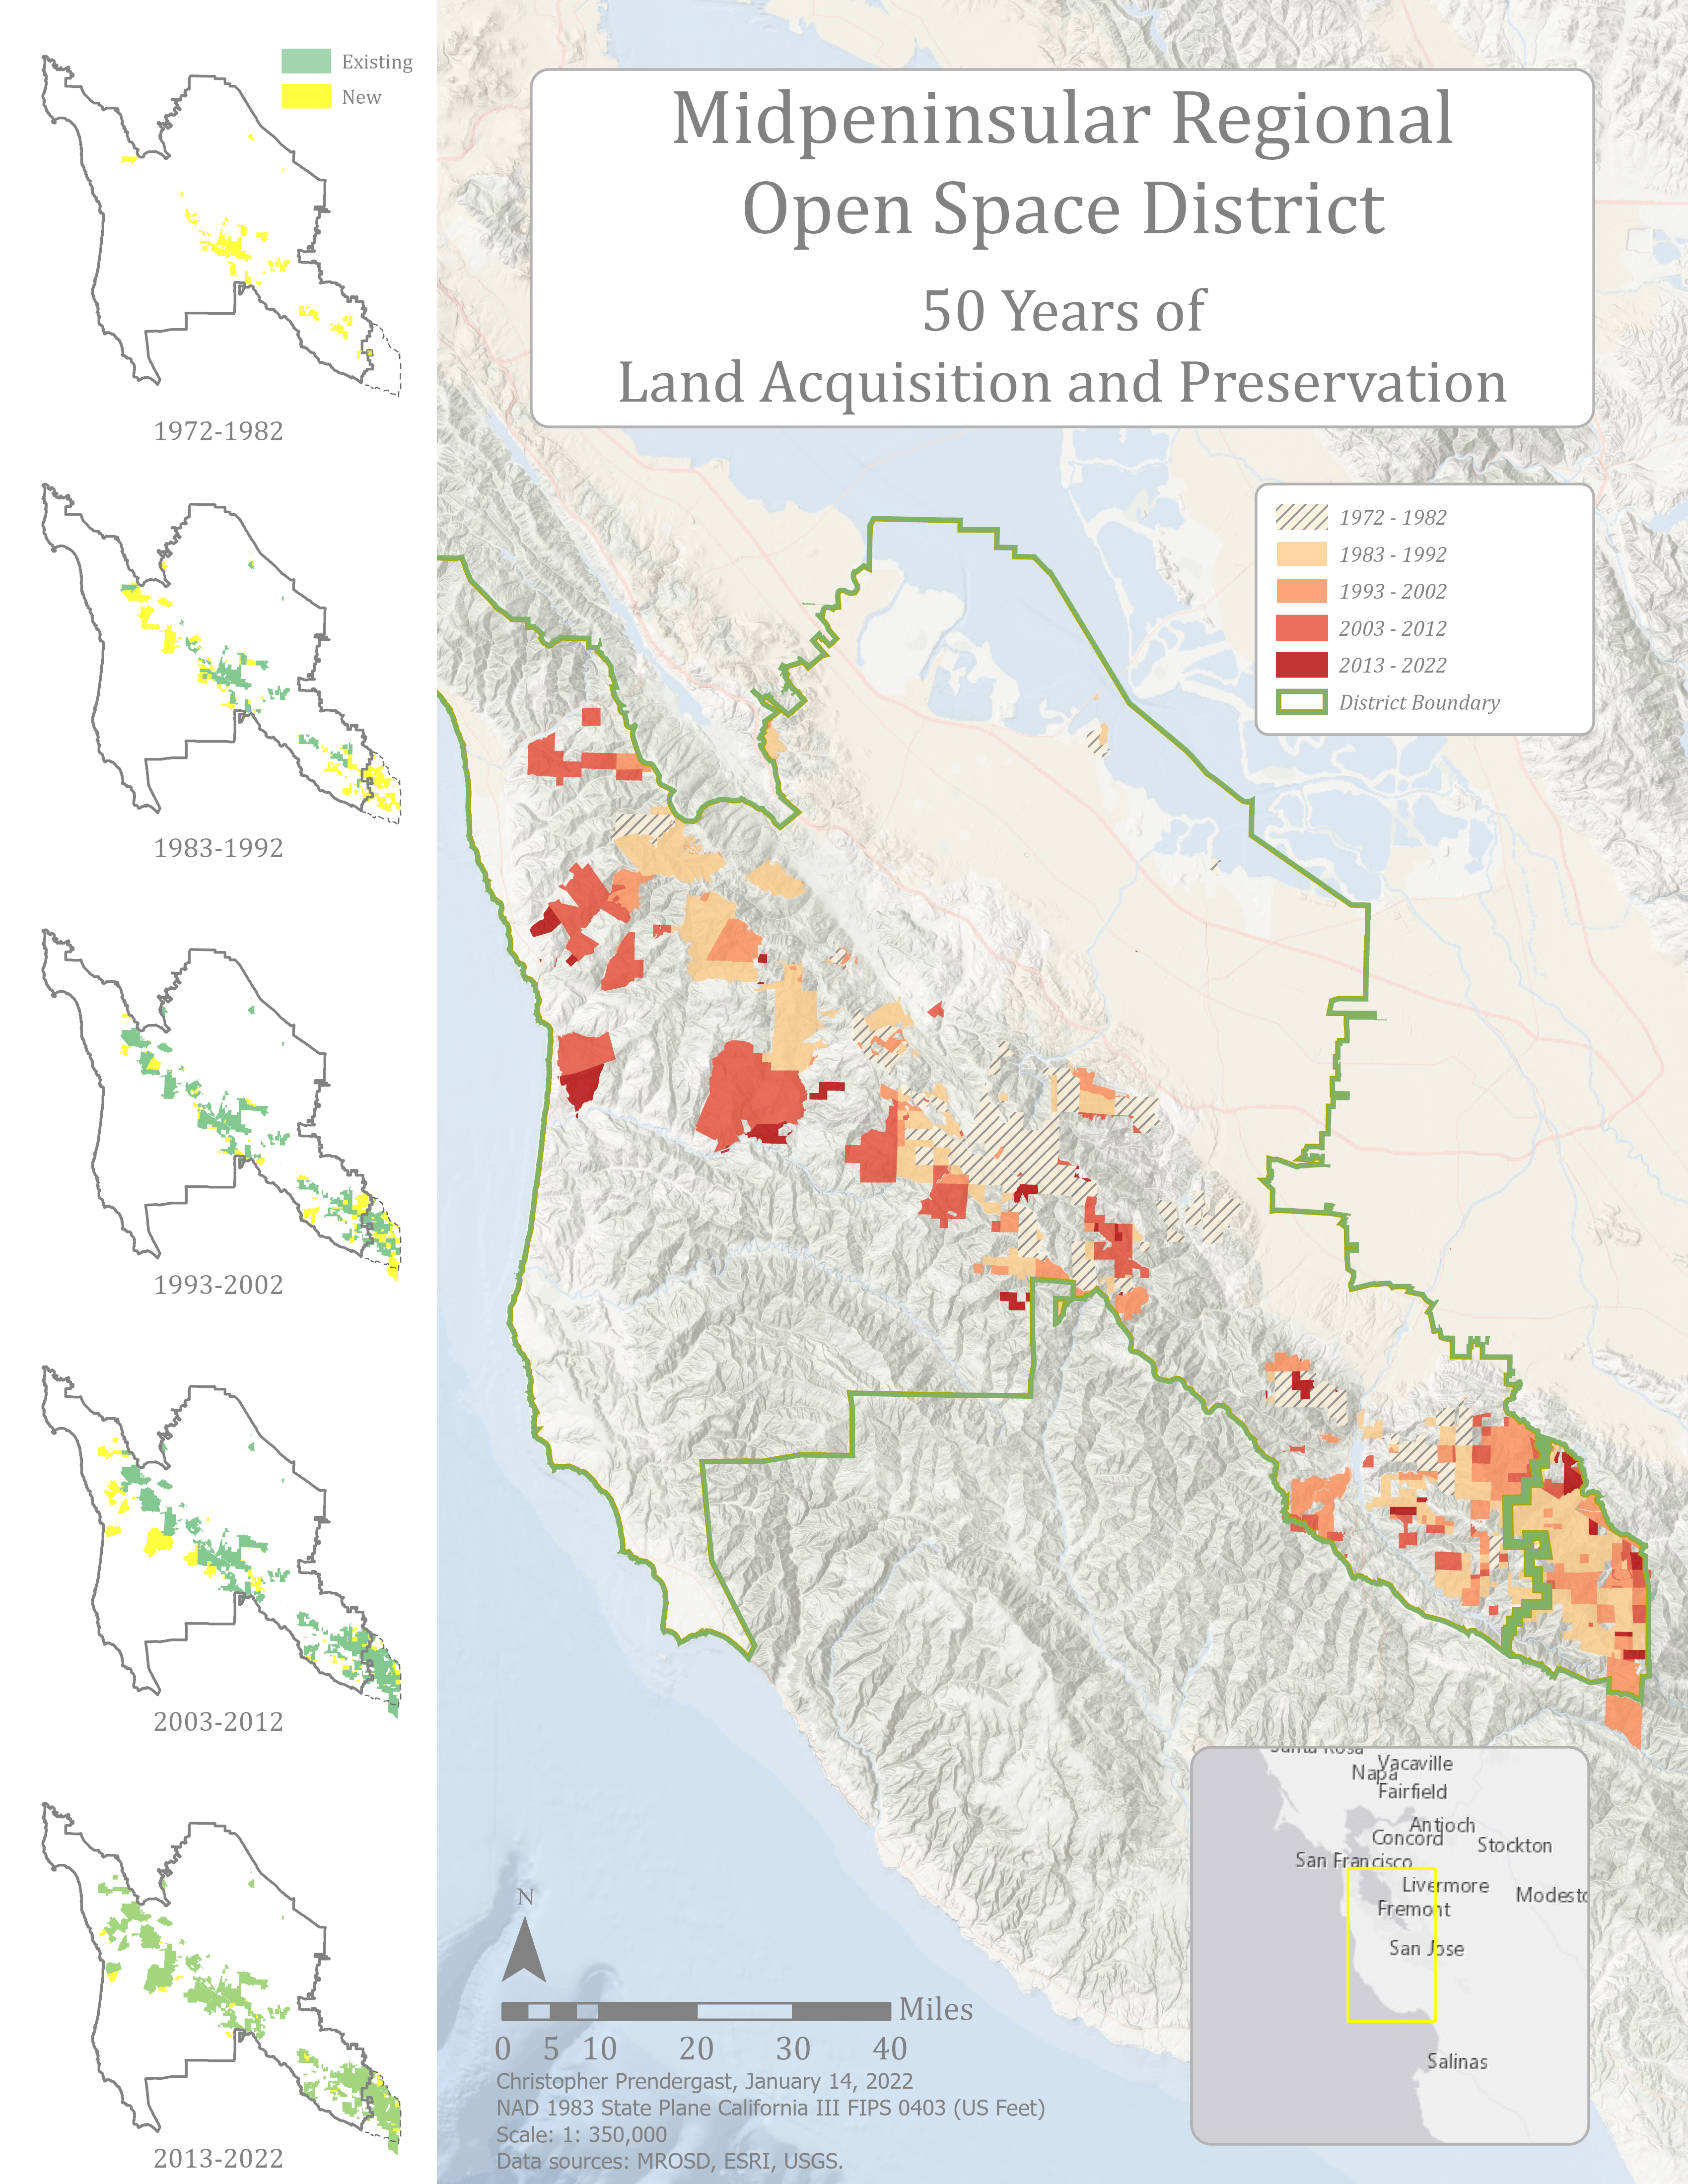
Midpeninsula Regional Open Space District -- 50 Years of Land Acquisition and Preservation
Map illustrating the 50-year history of land Acquisition and preservation by the Midpeninsula Regional Open Space District
Go to article | Return to overview
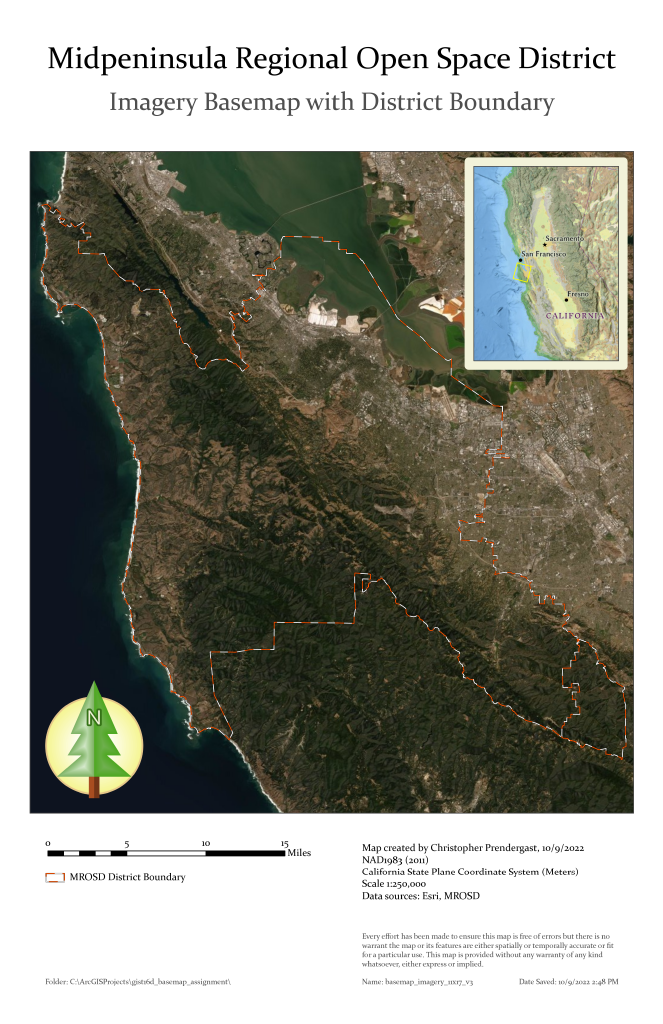
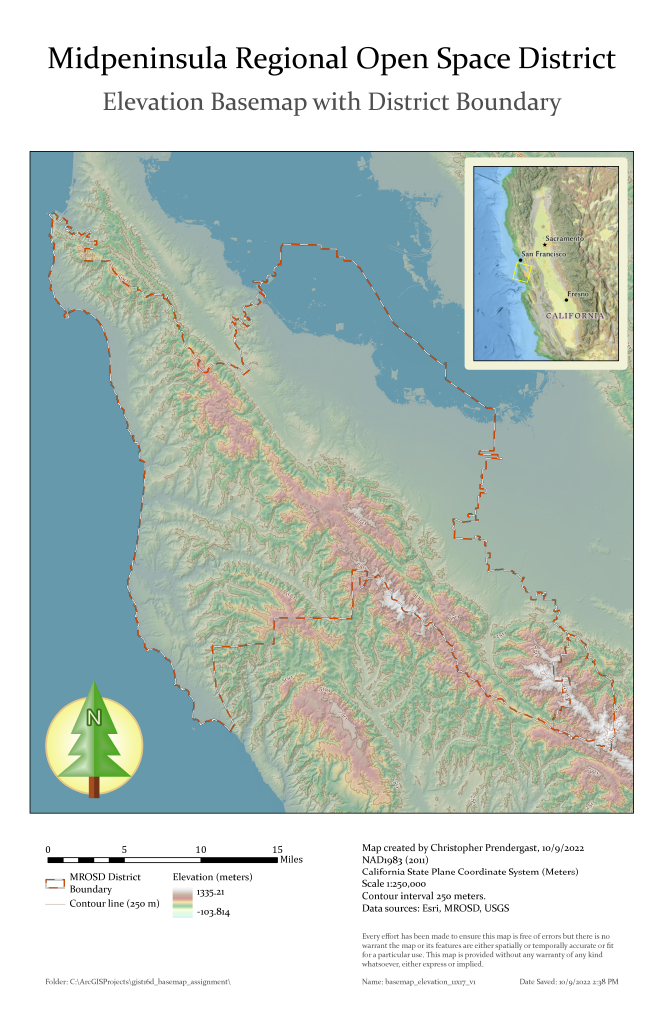
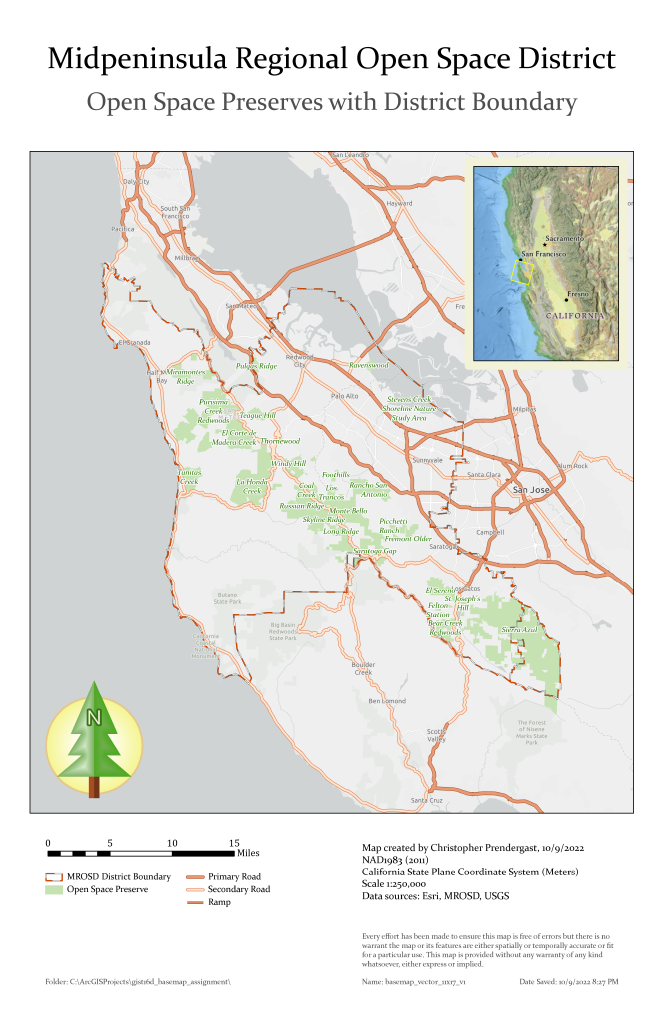
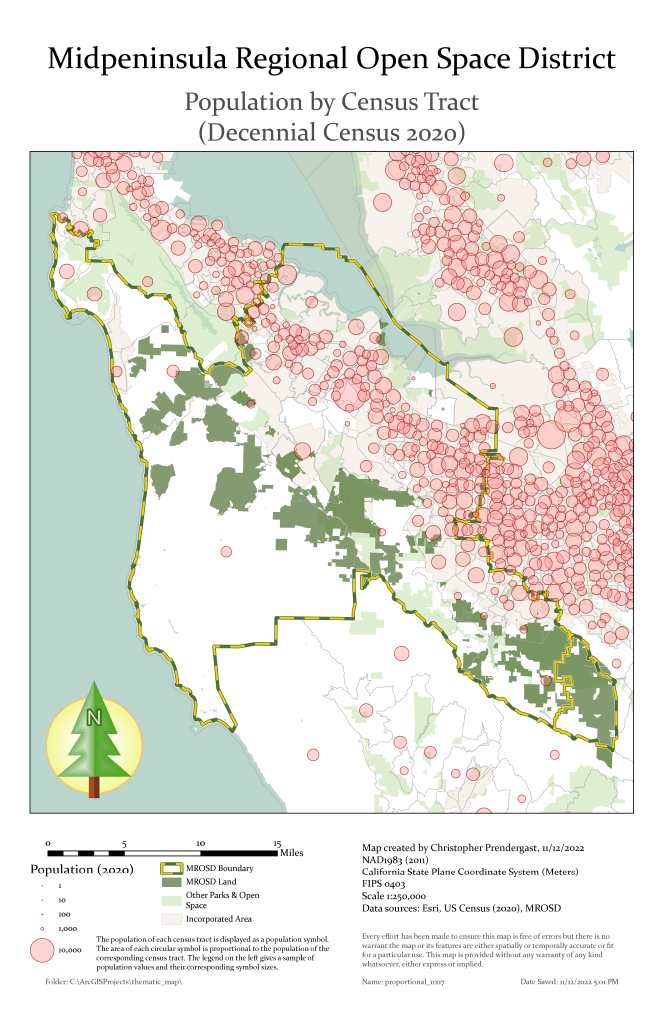
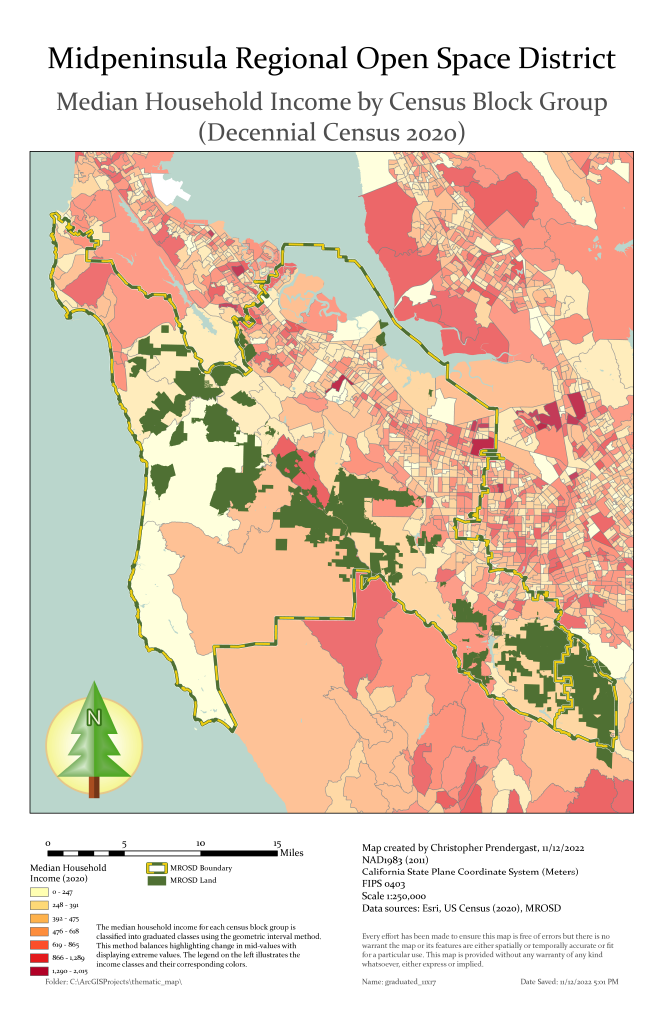
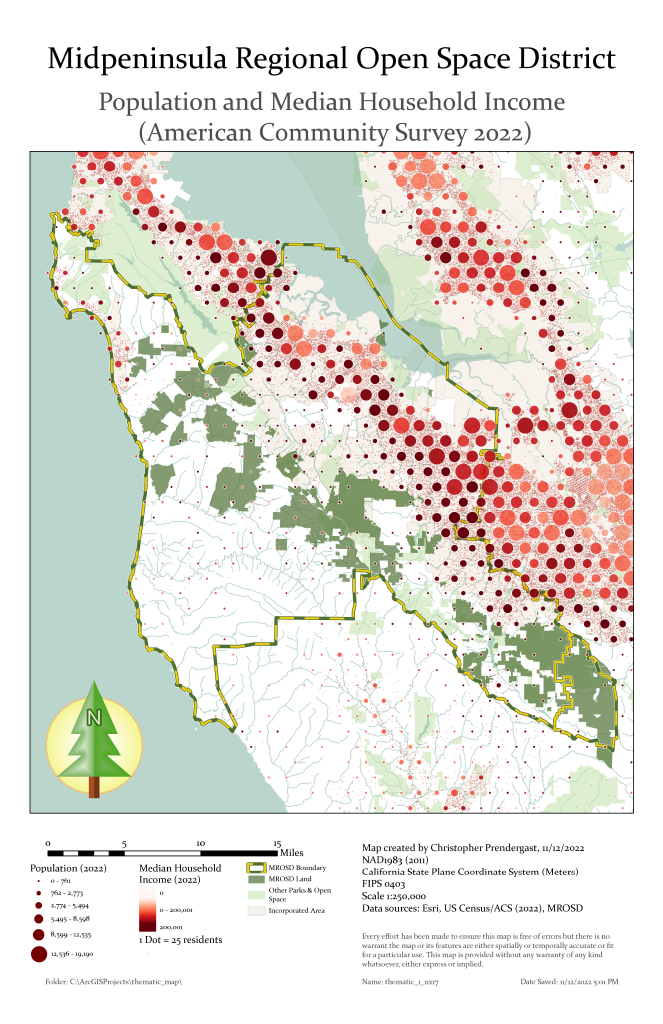
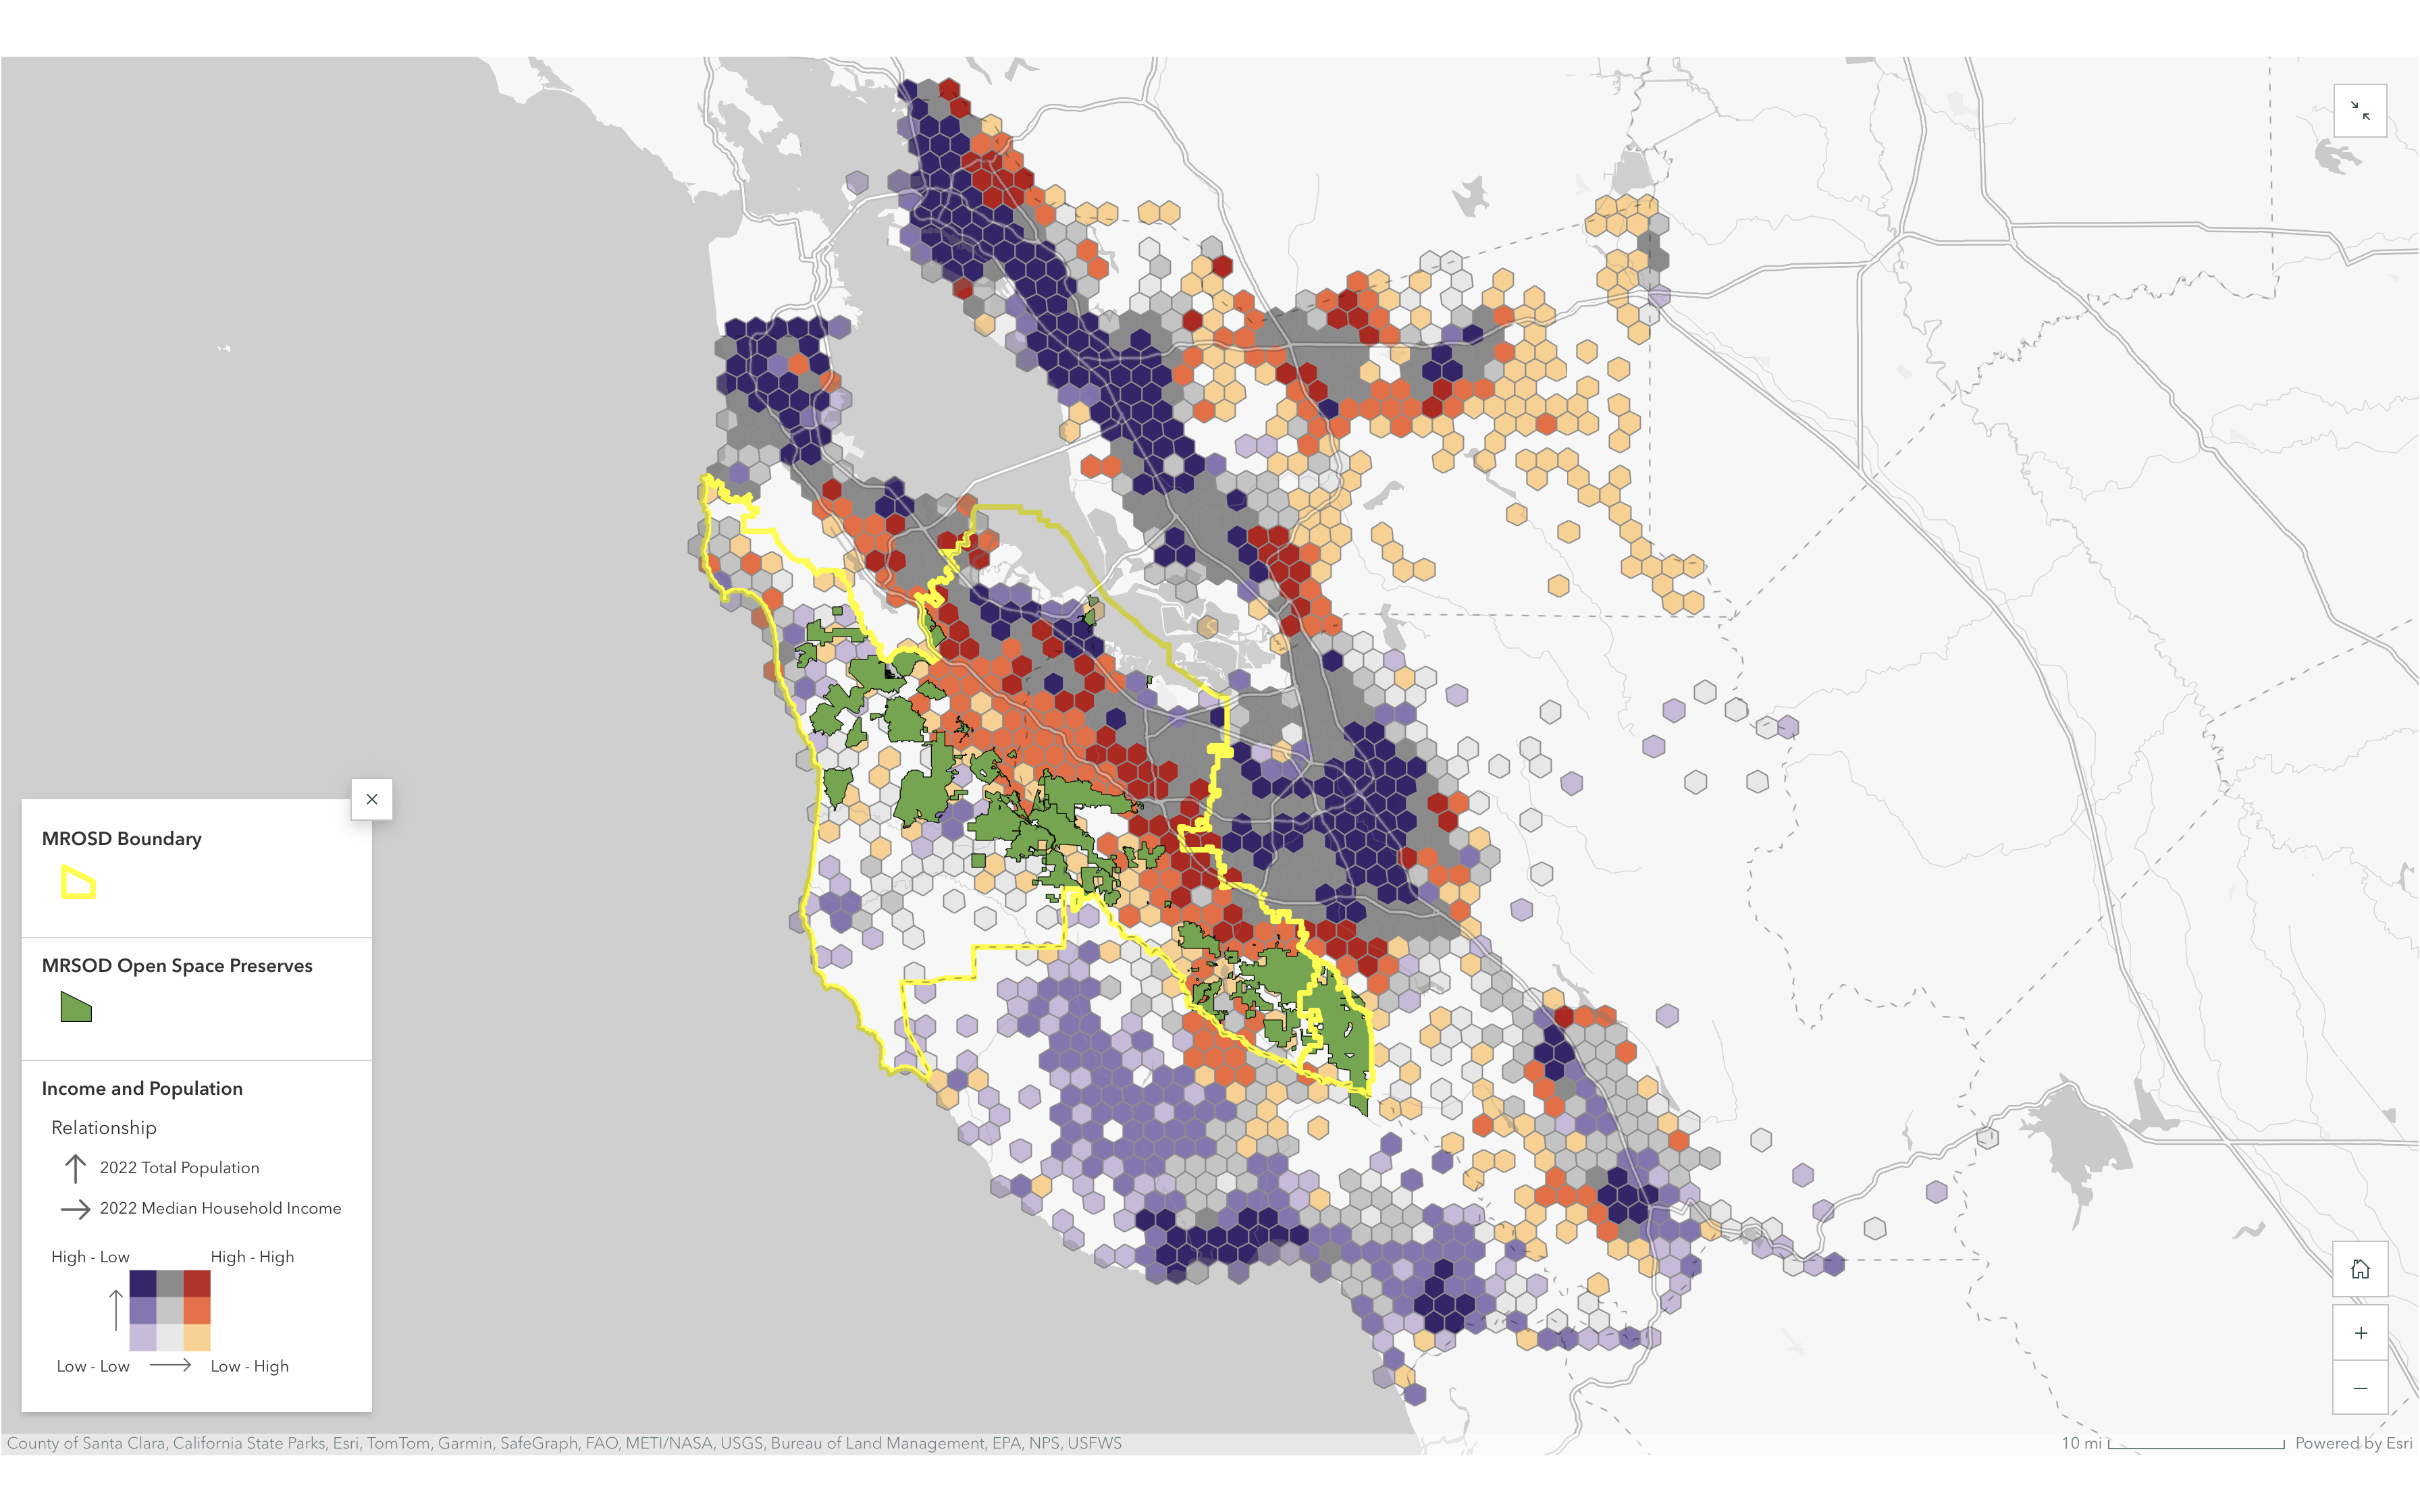
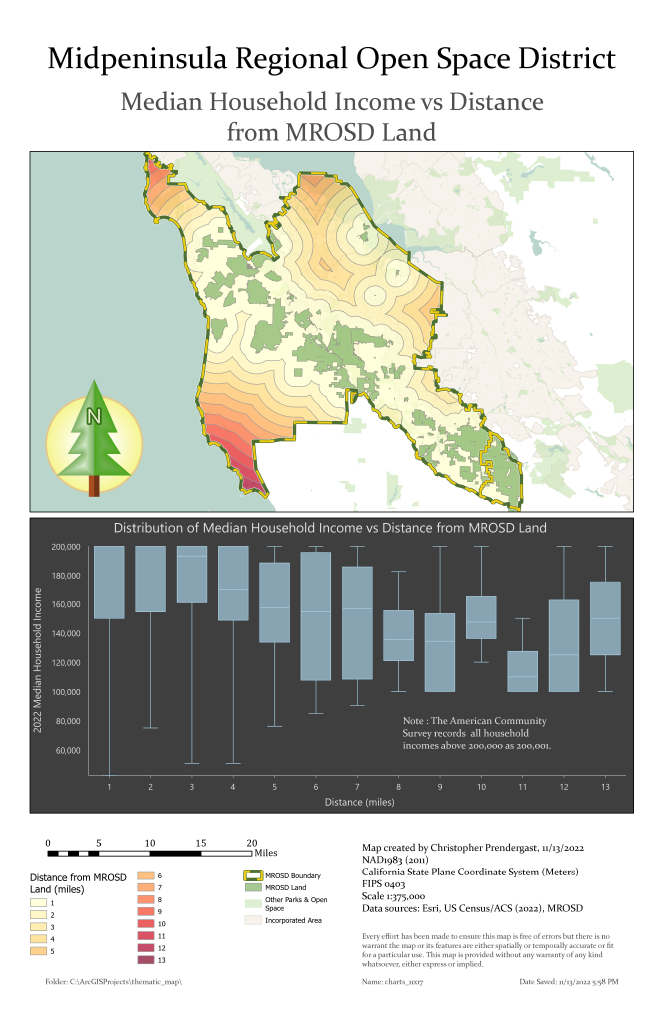
Midpeninsula Regional Open Space District Map Series
A series of maps for Midpeninsula Regional Open Space District.
Go to article | Return to overview
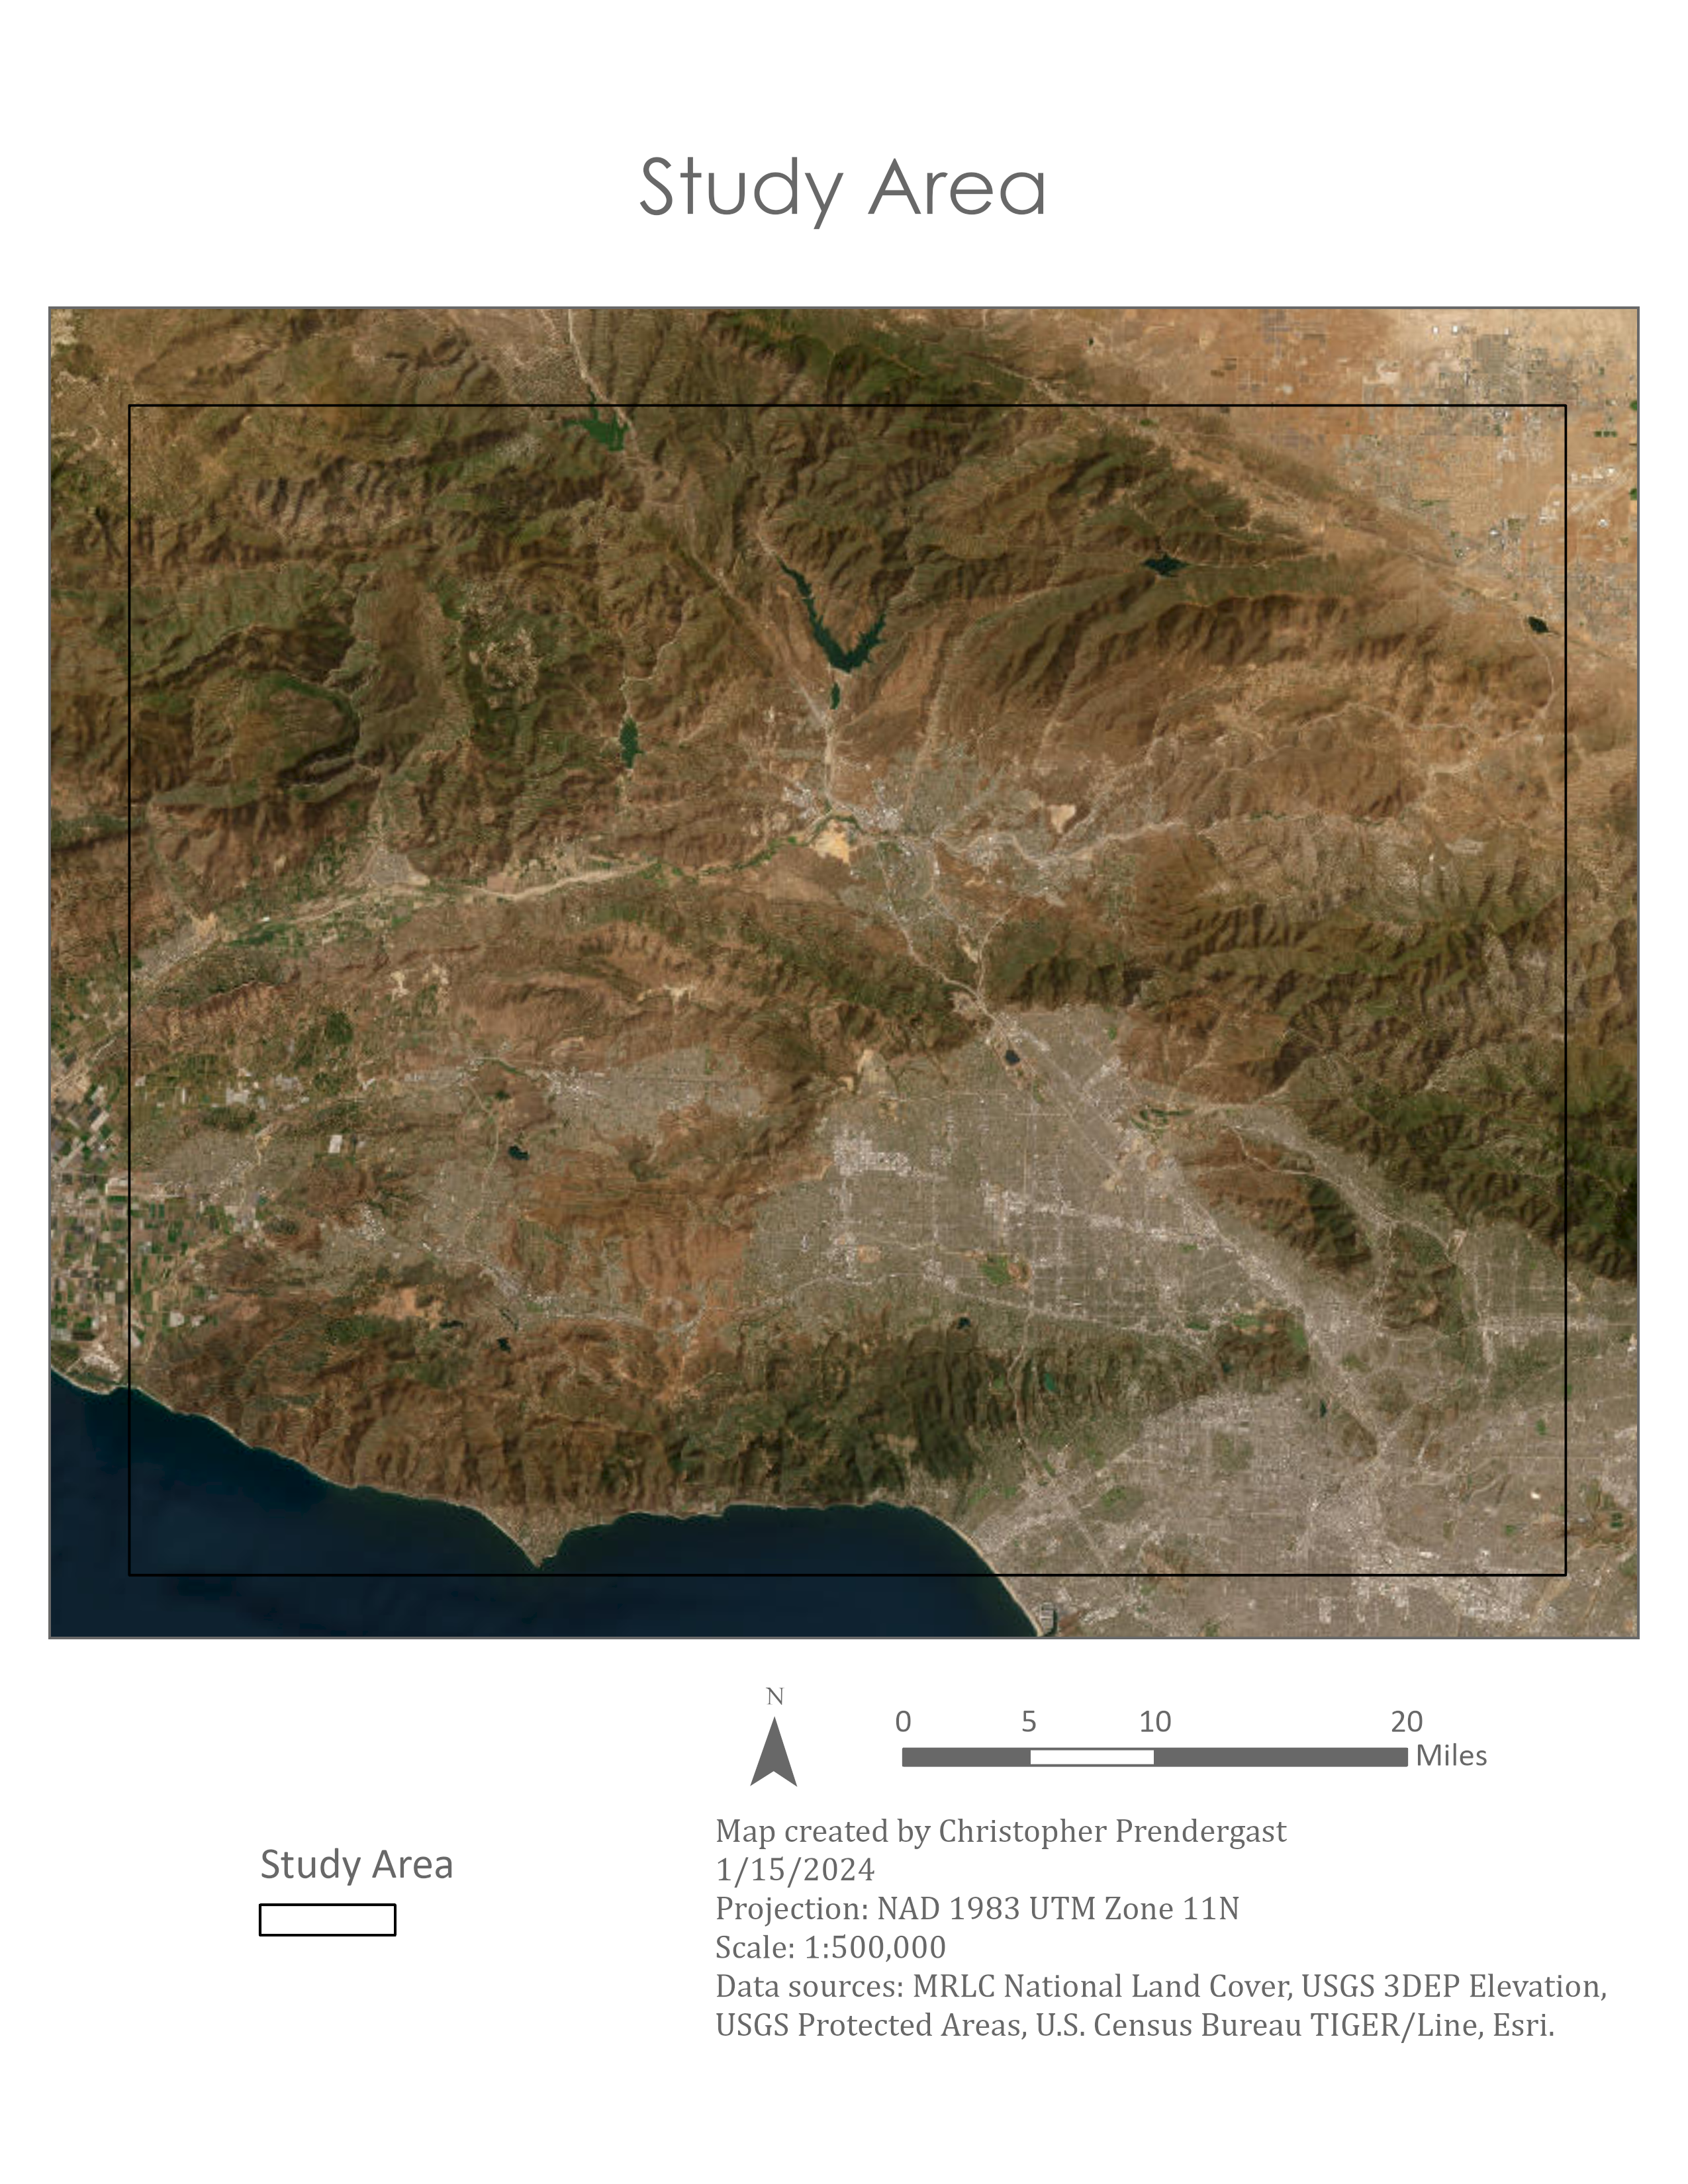
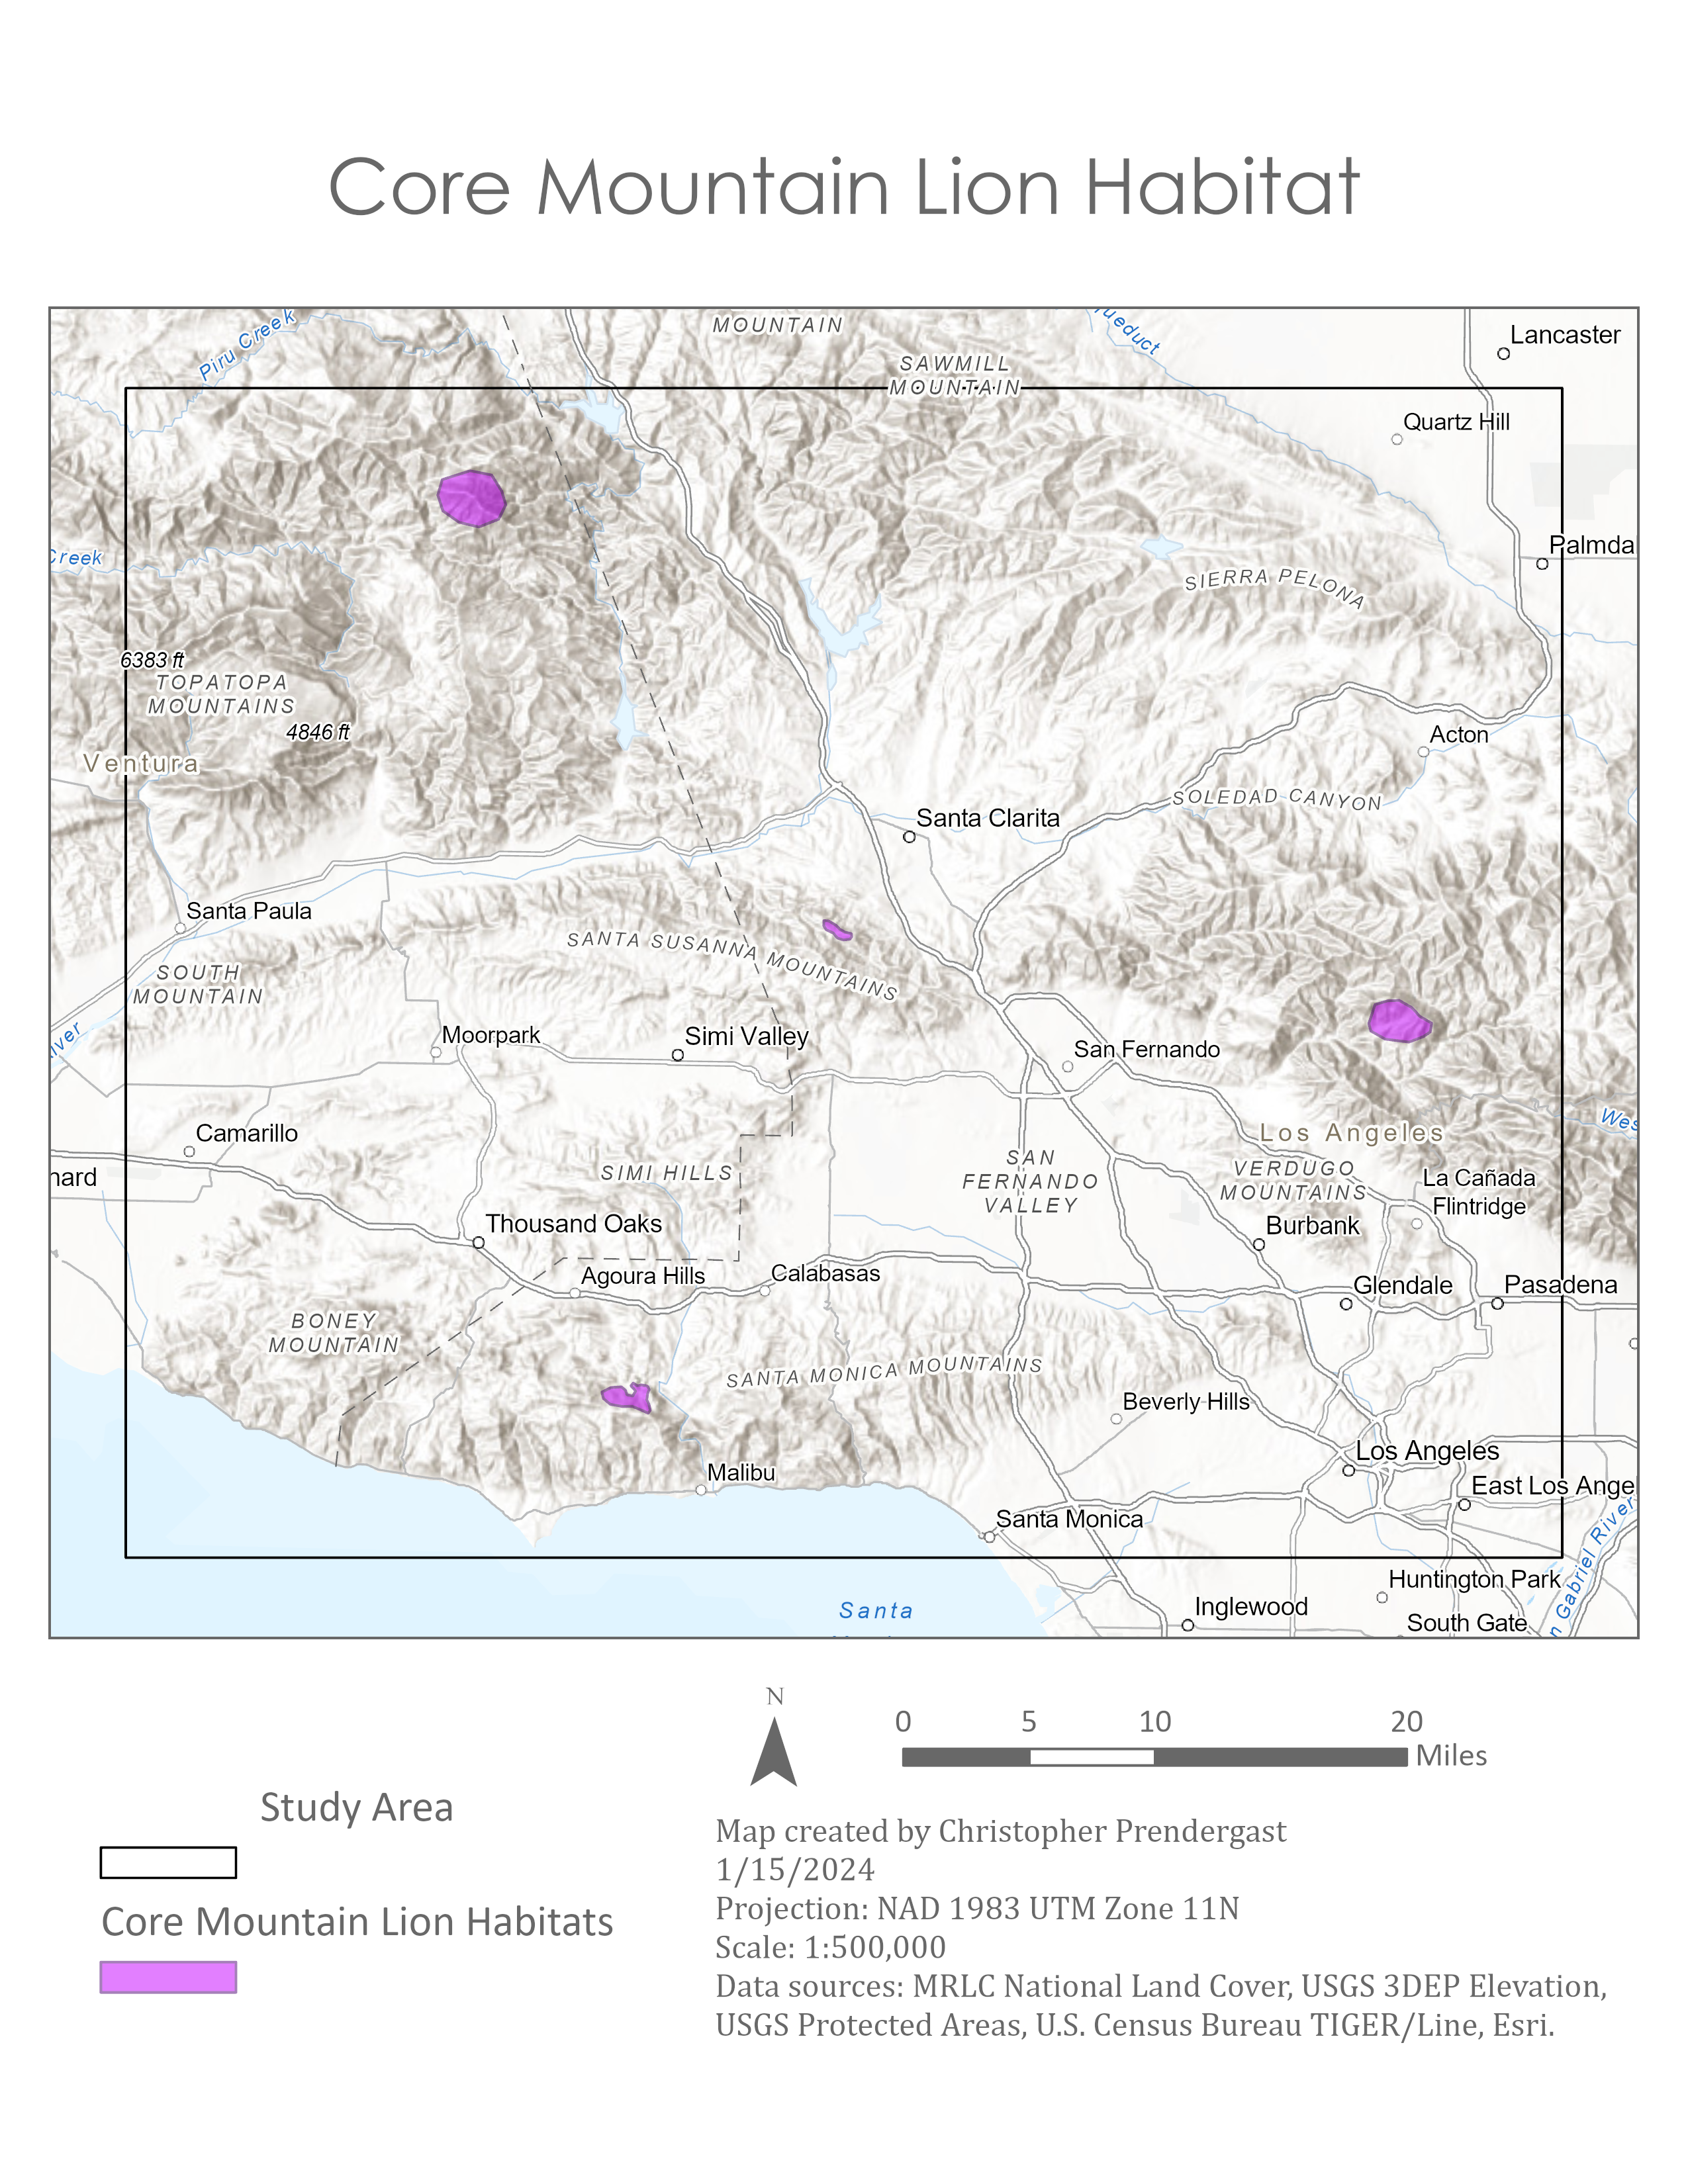
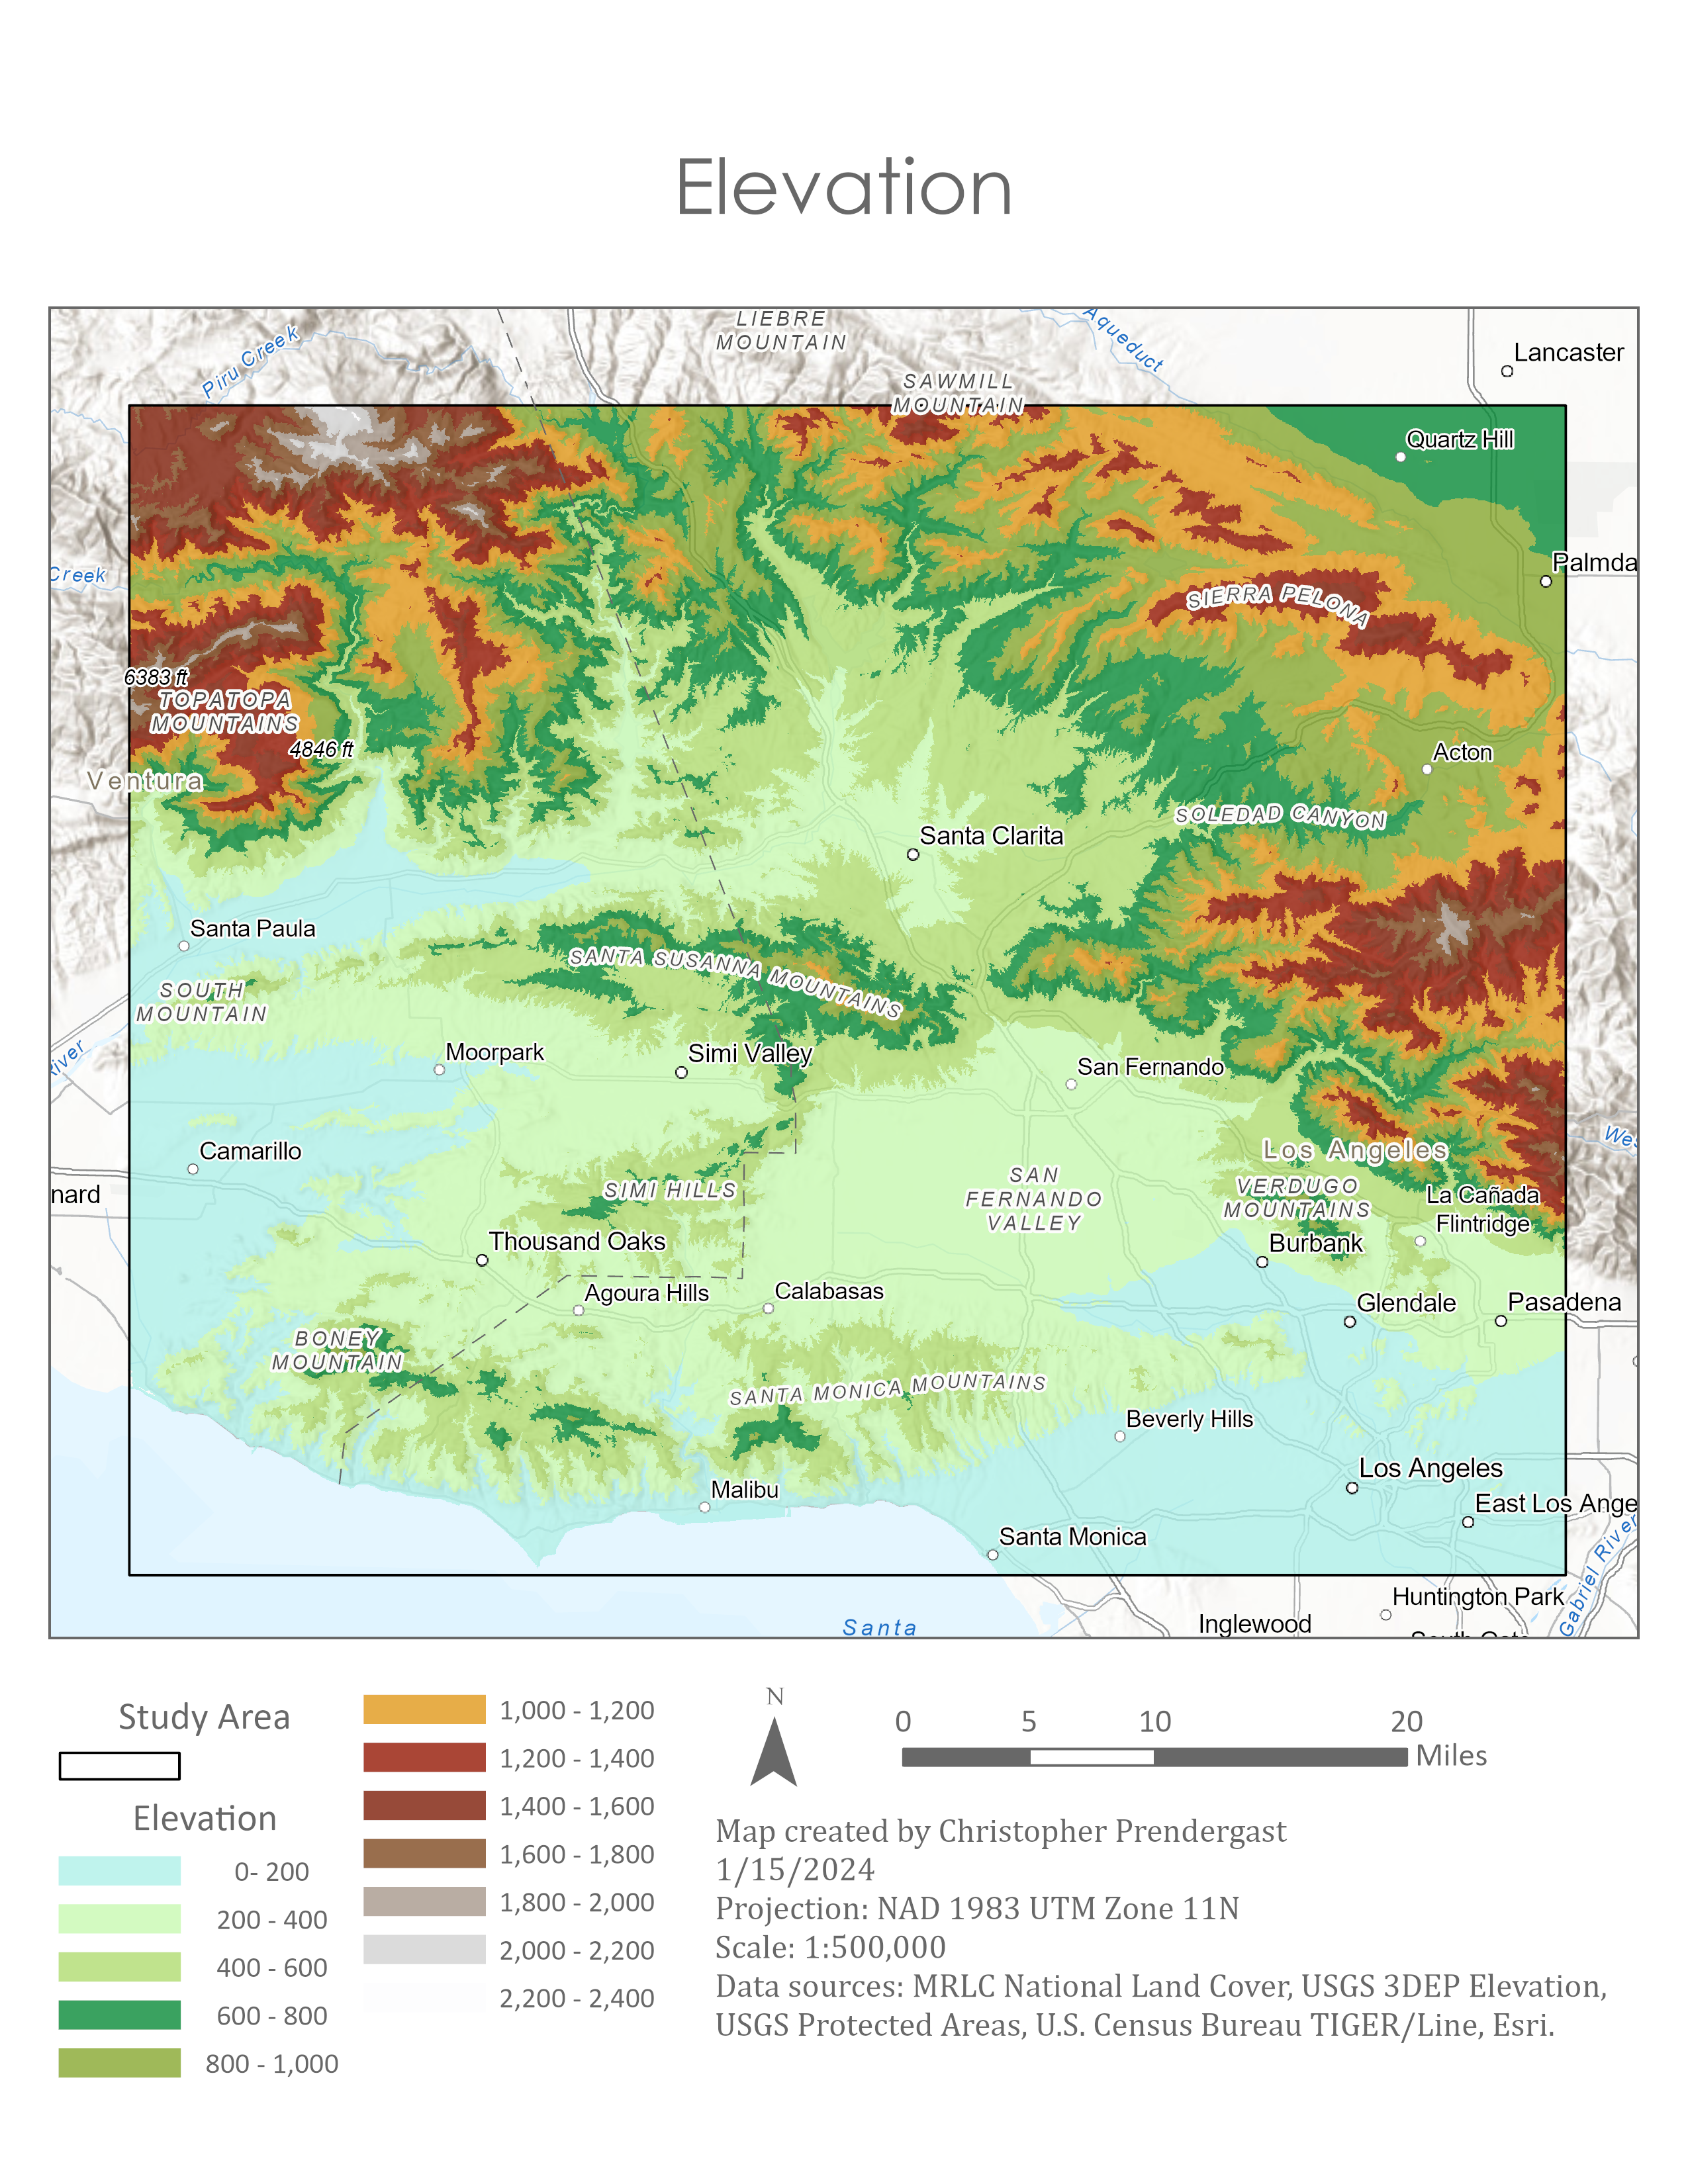
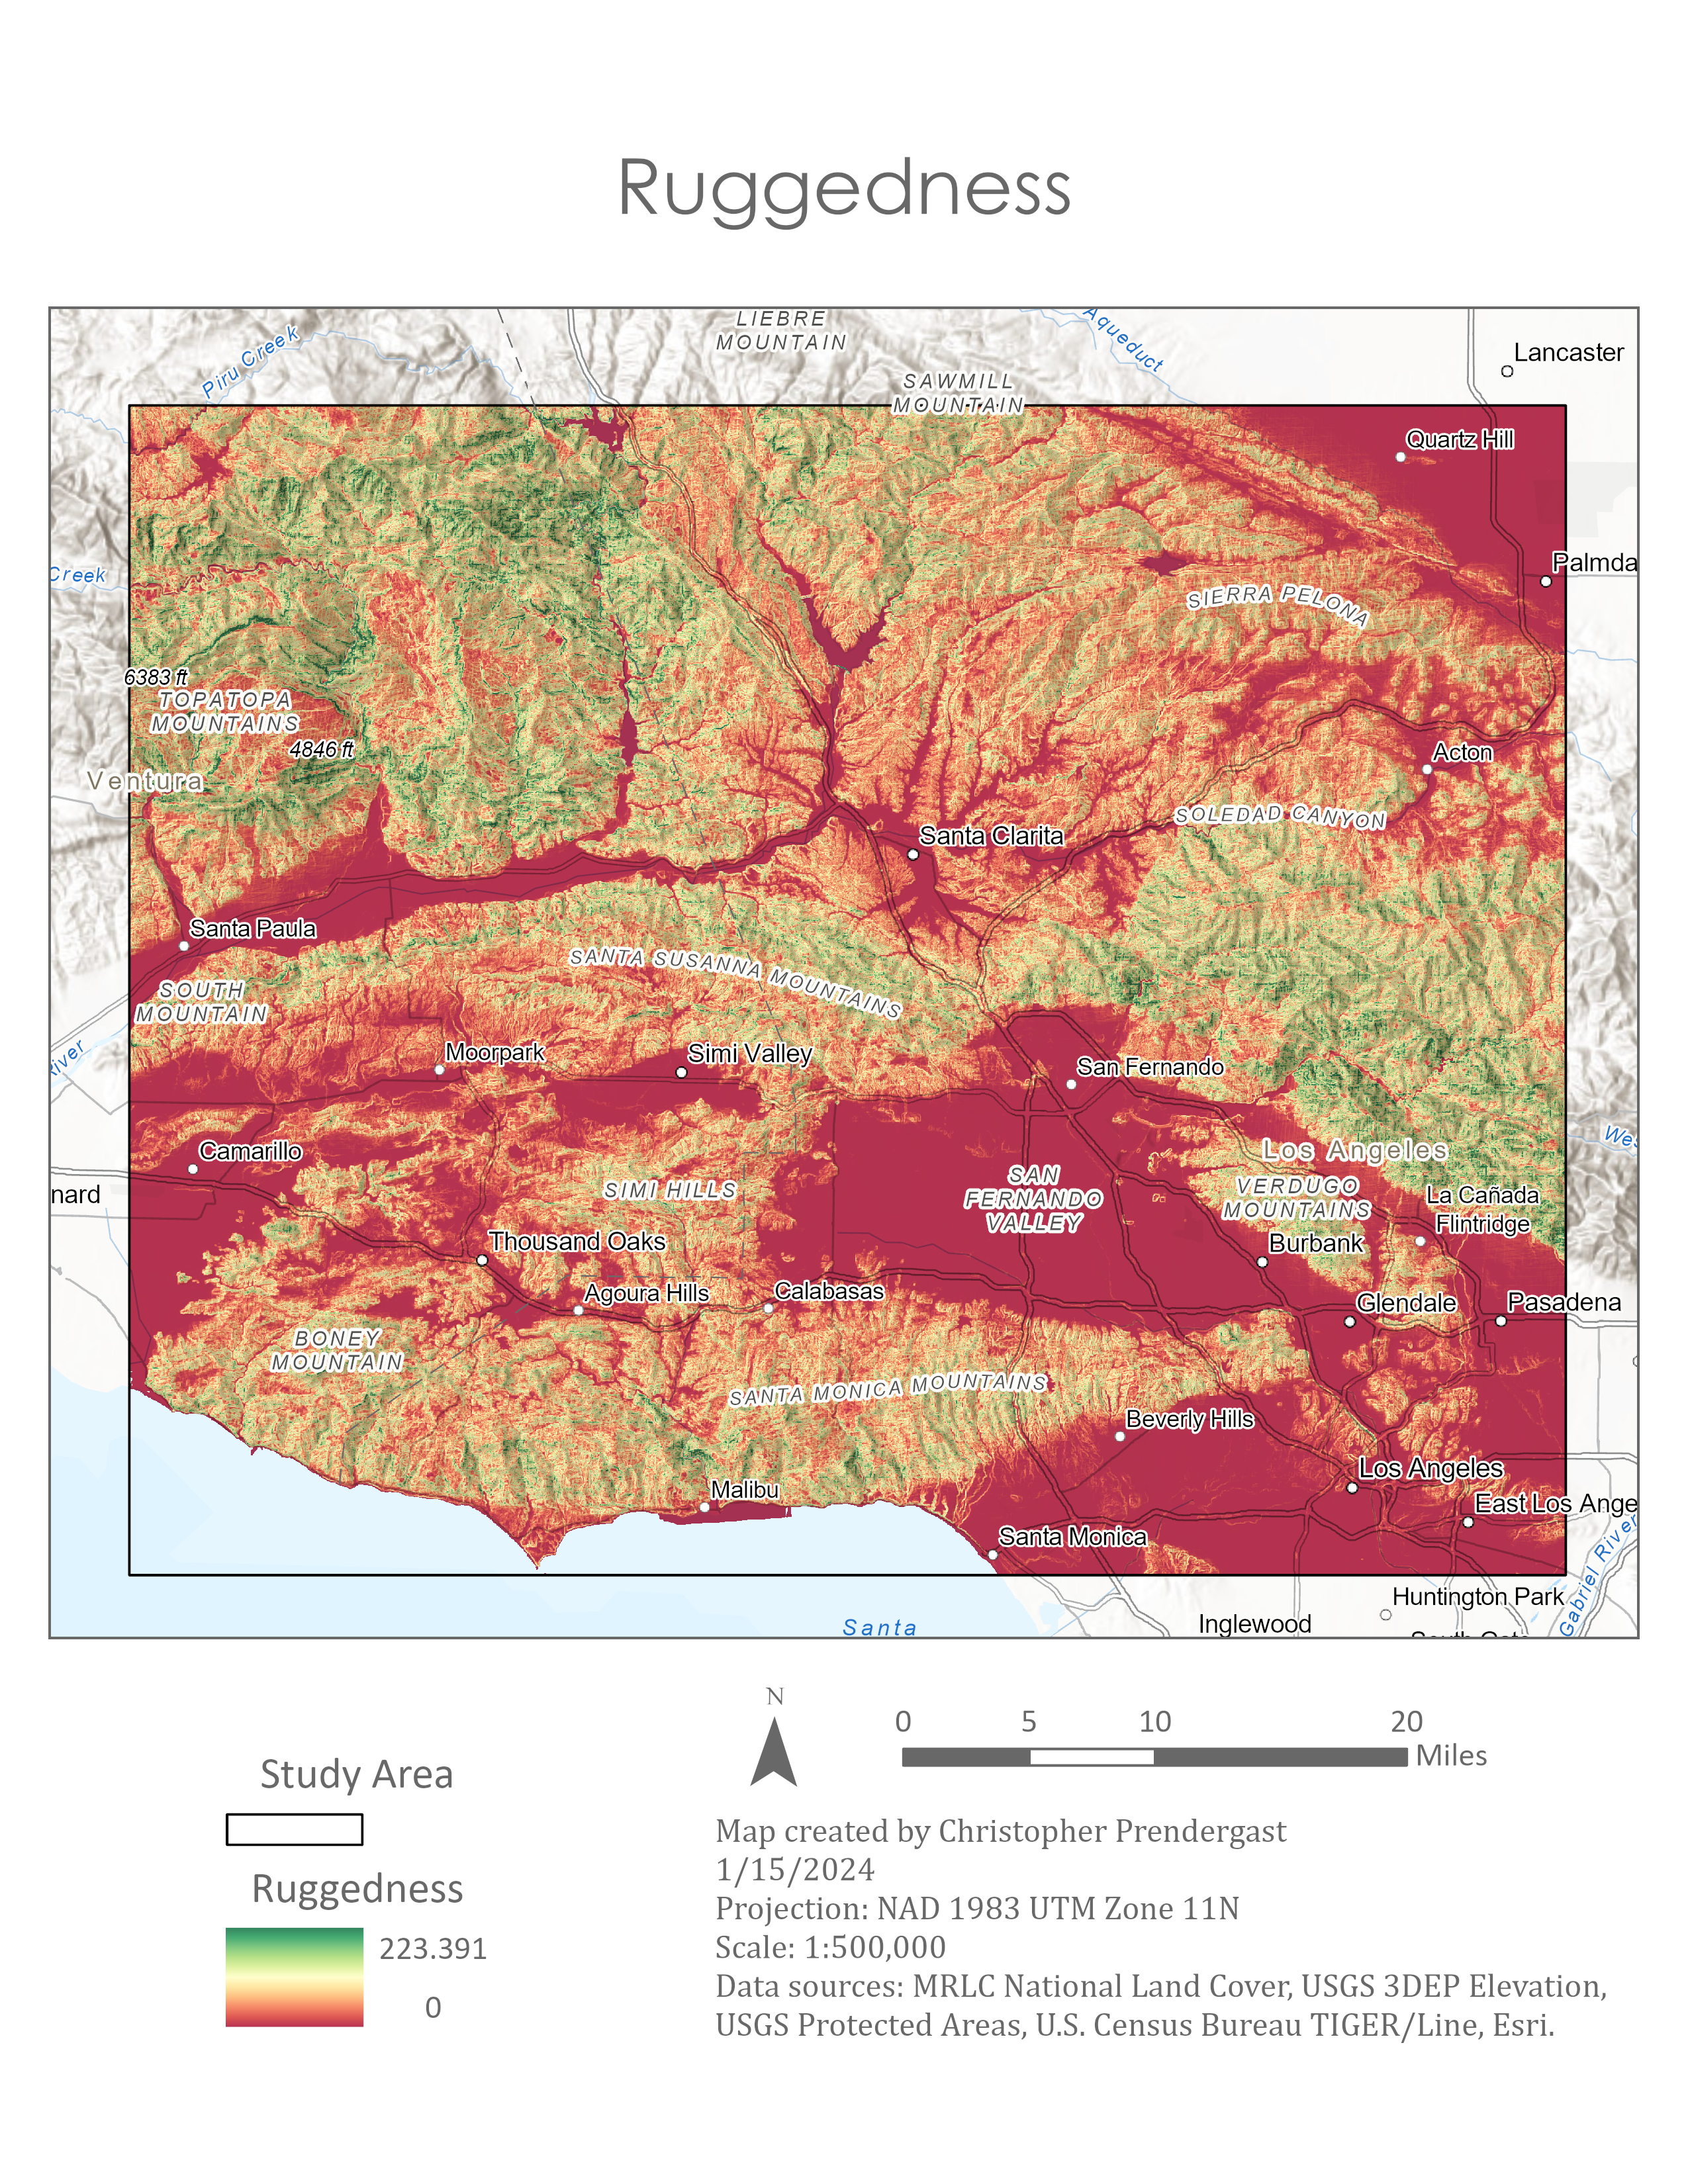
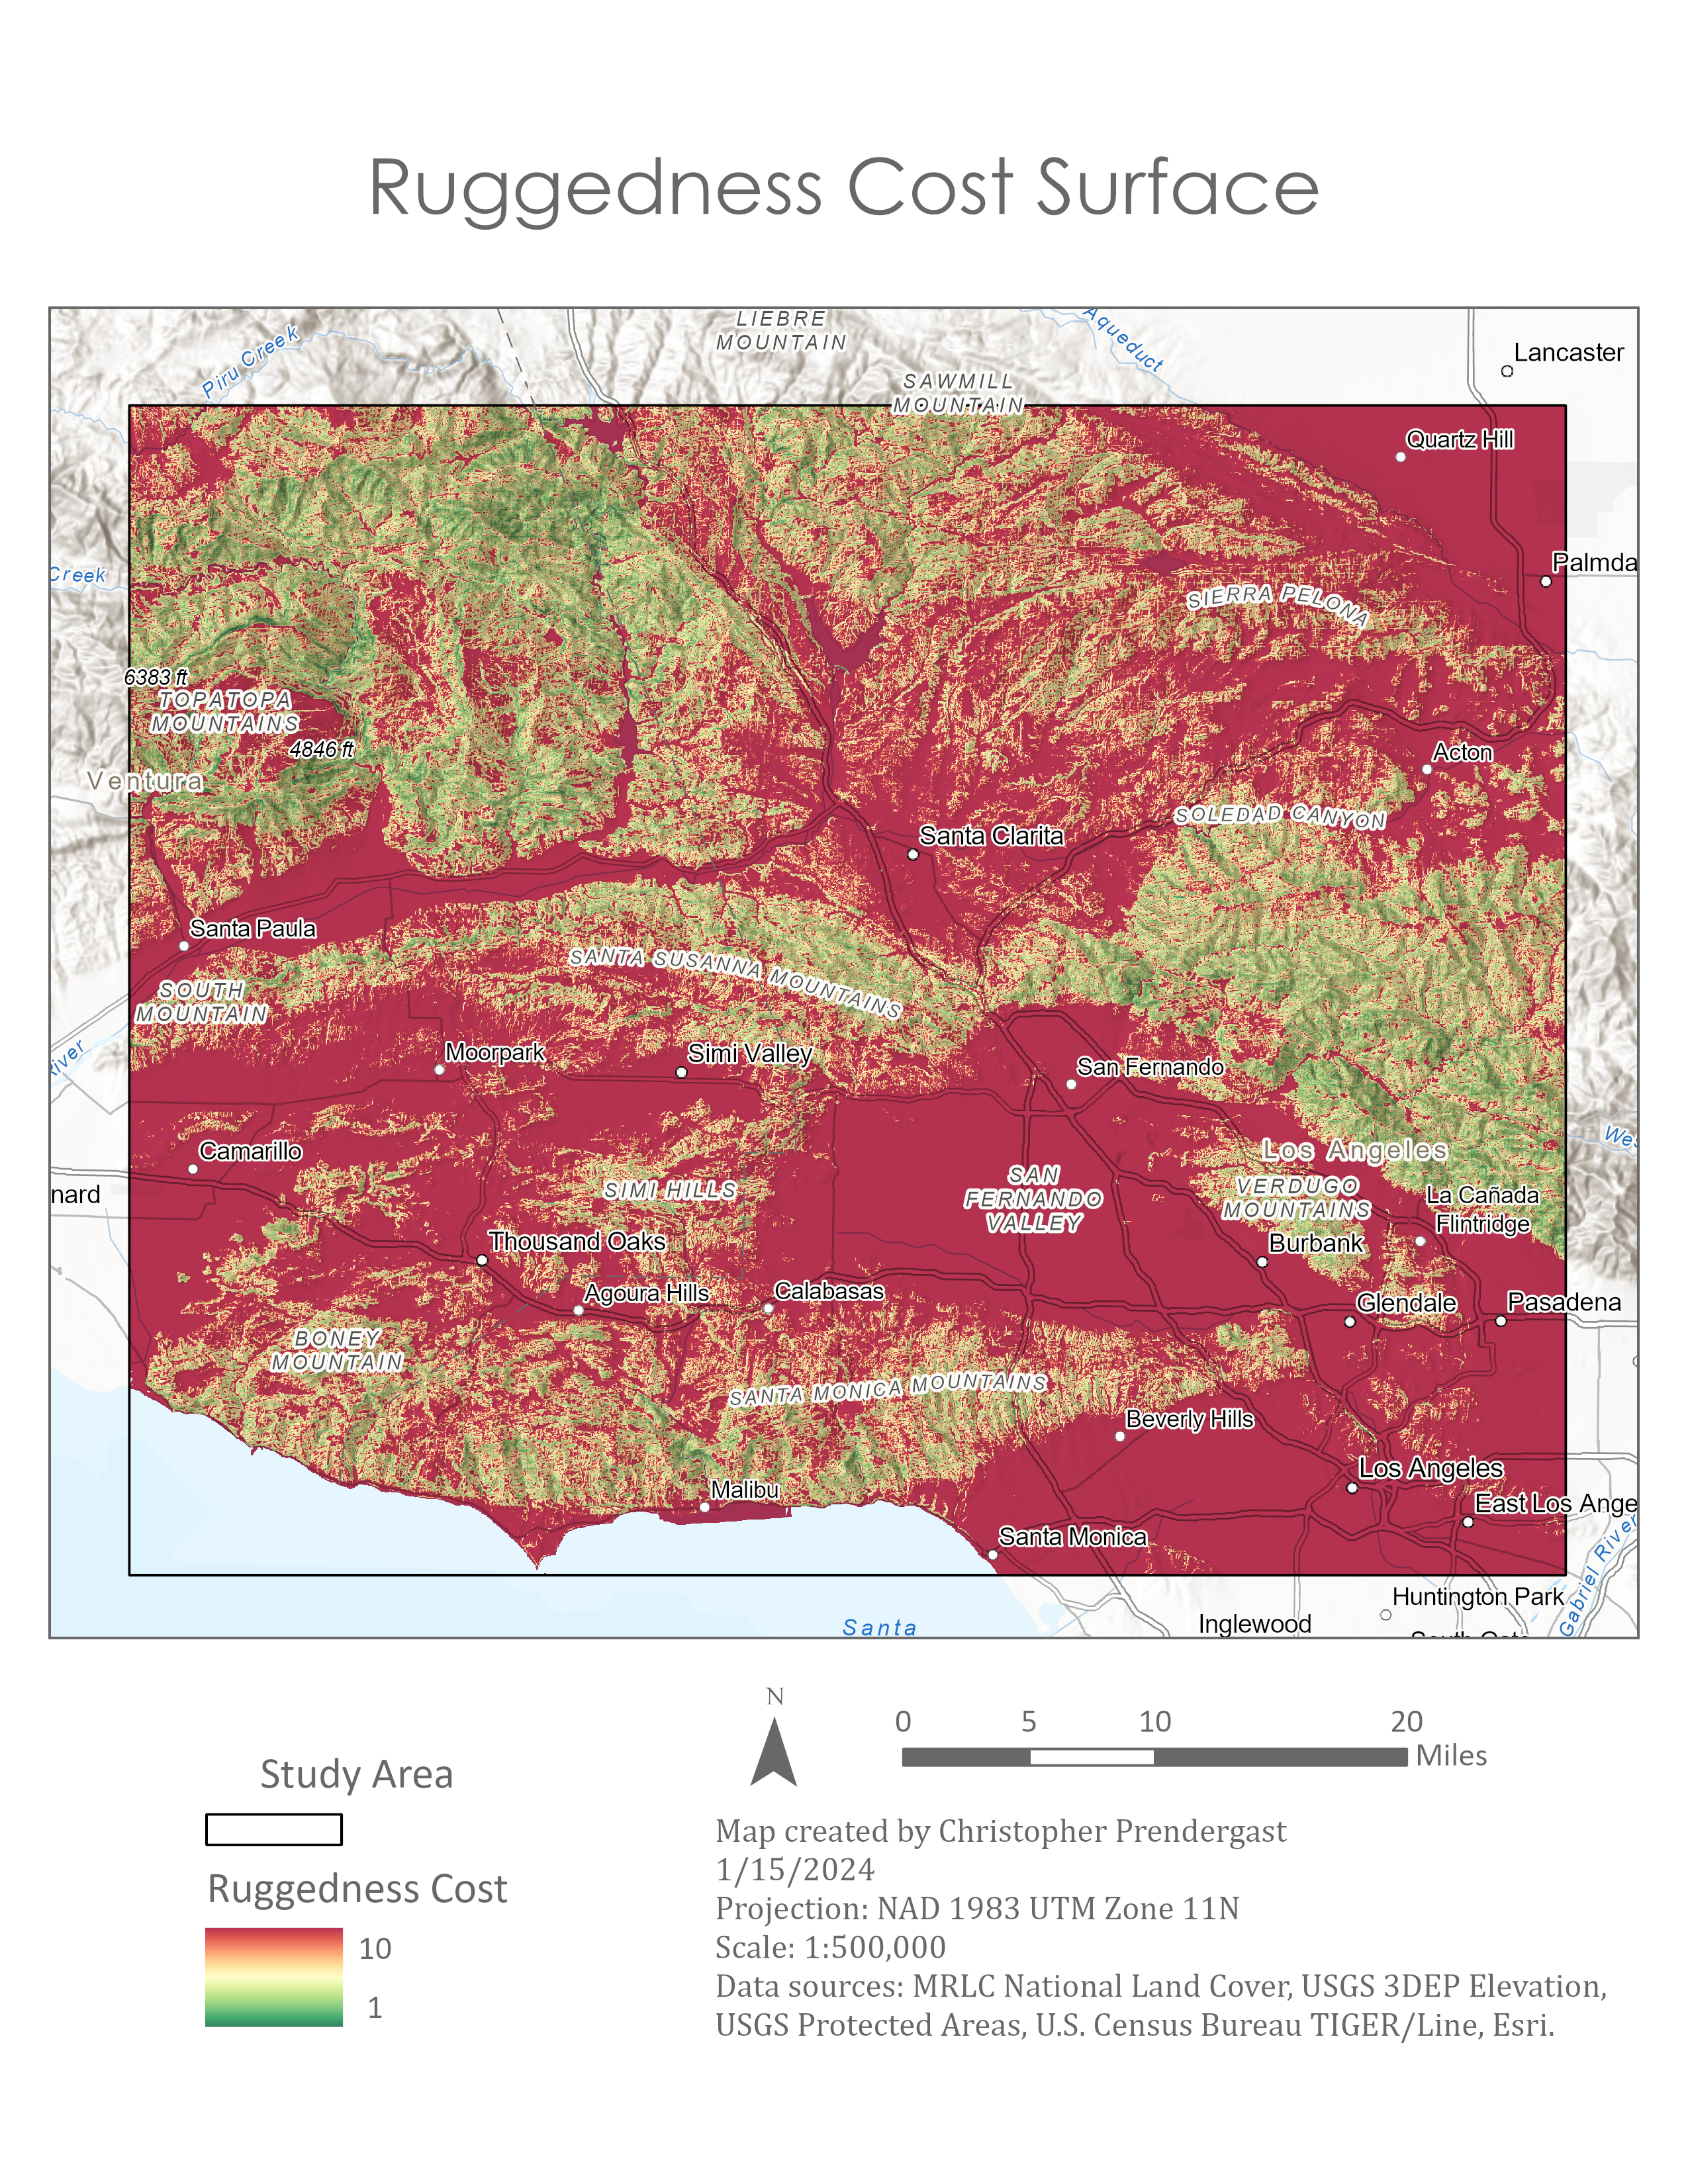
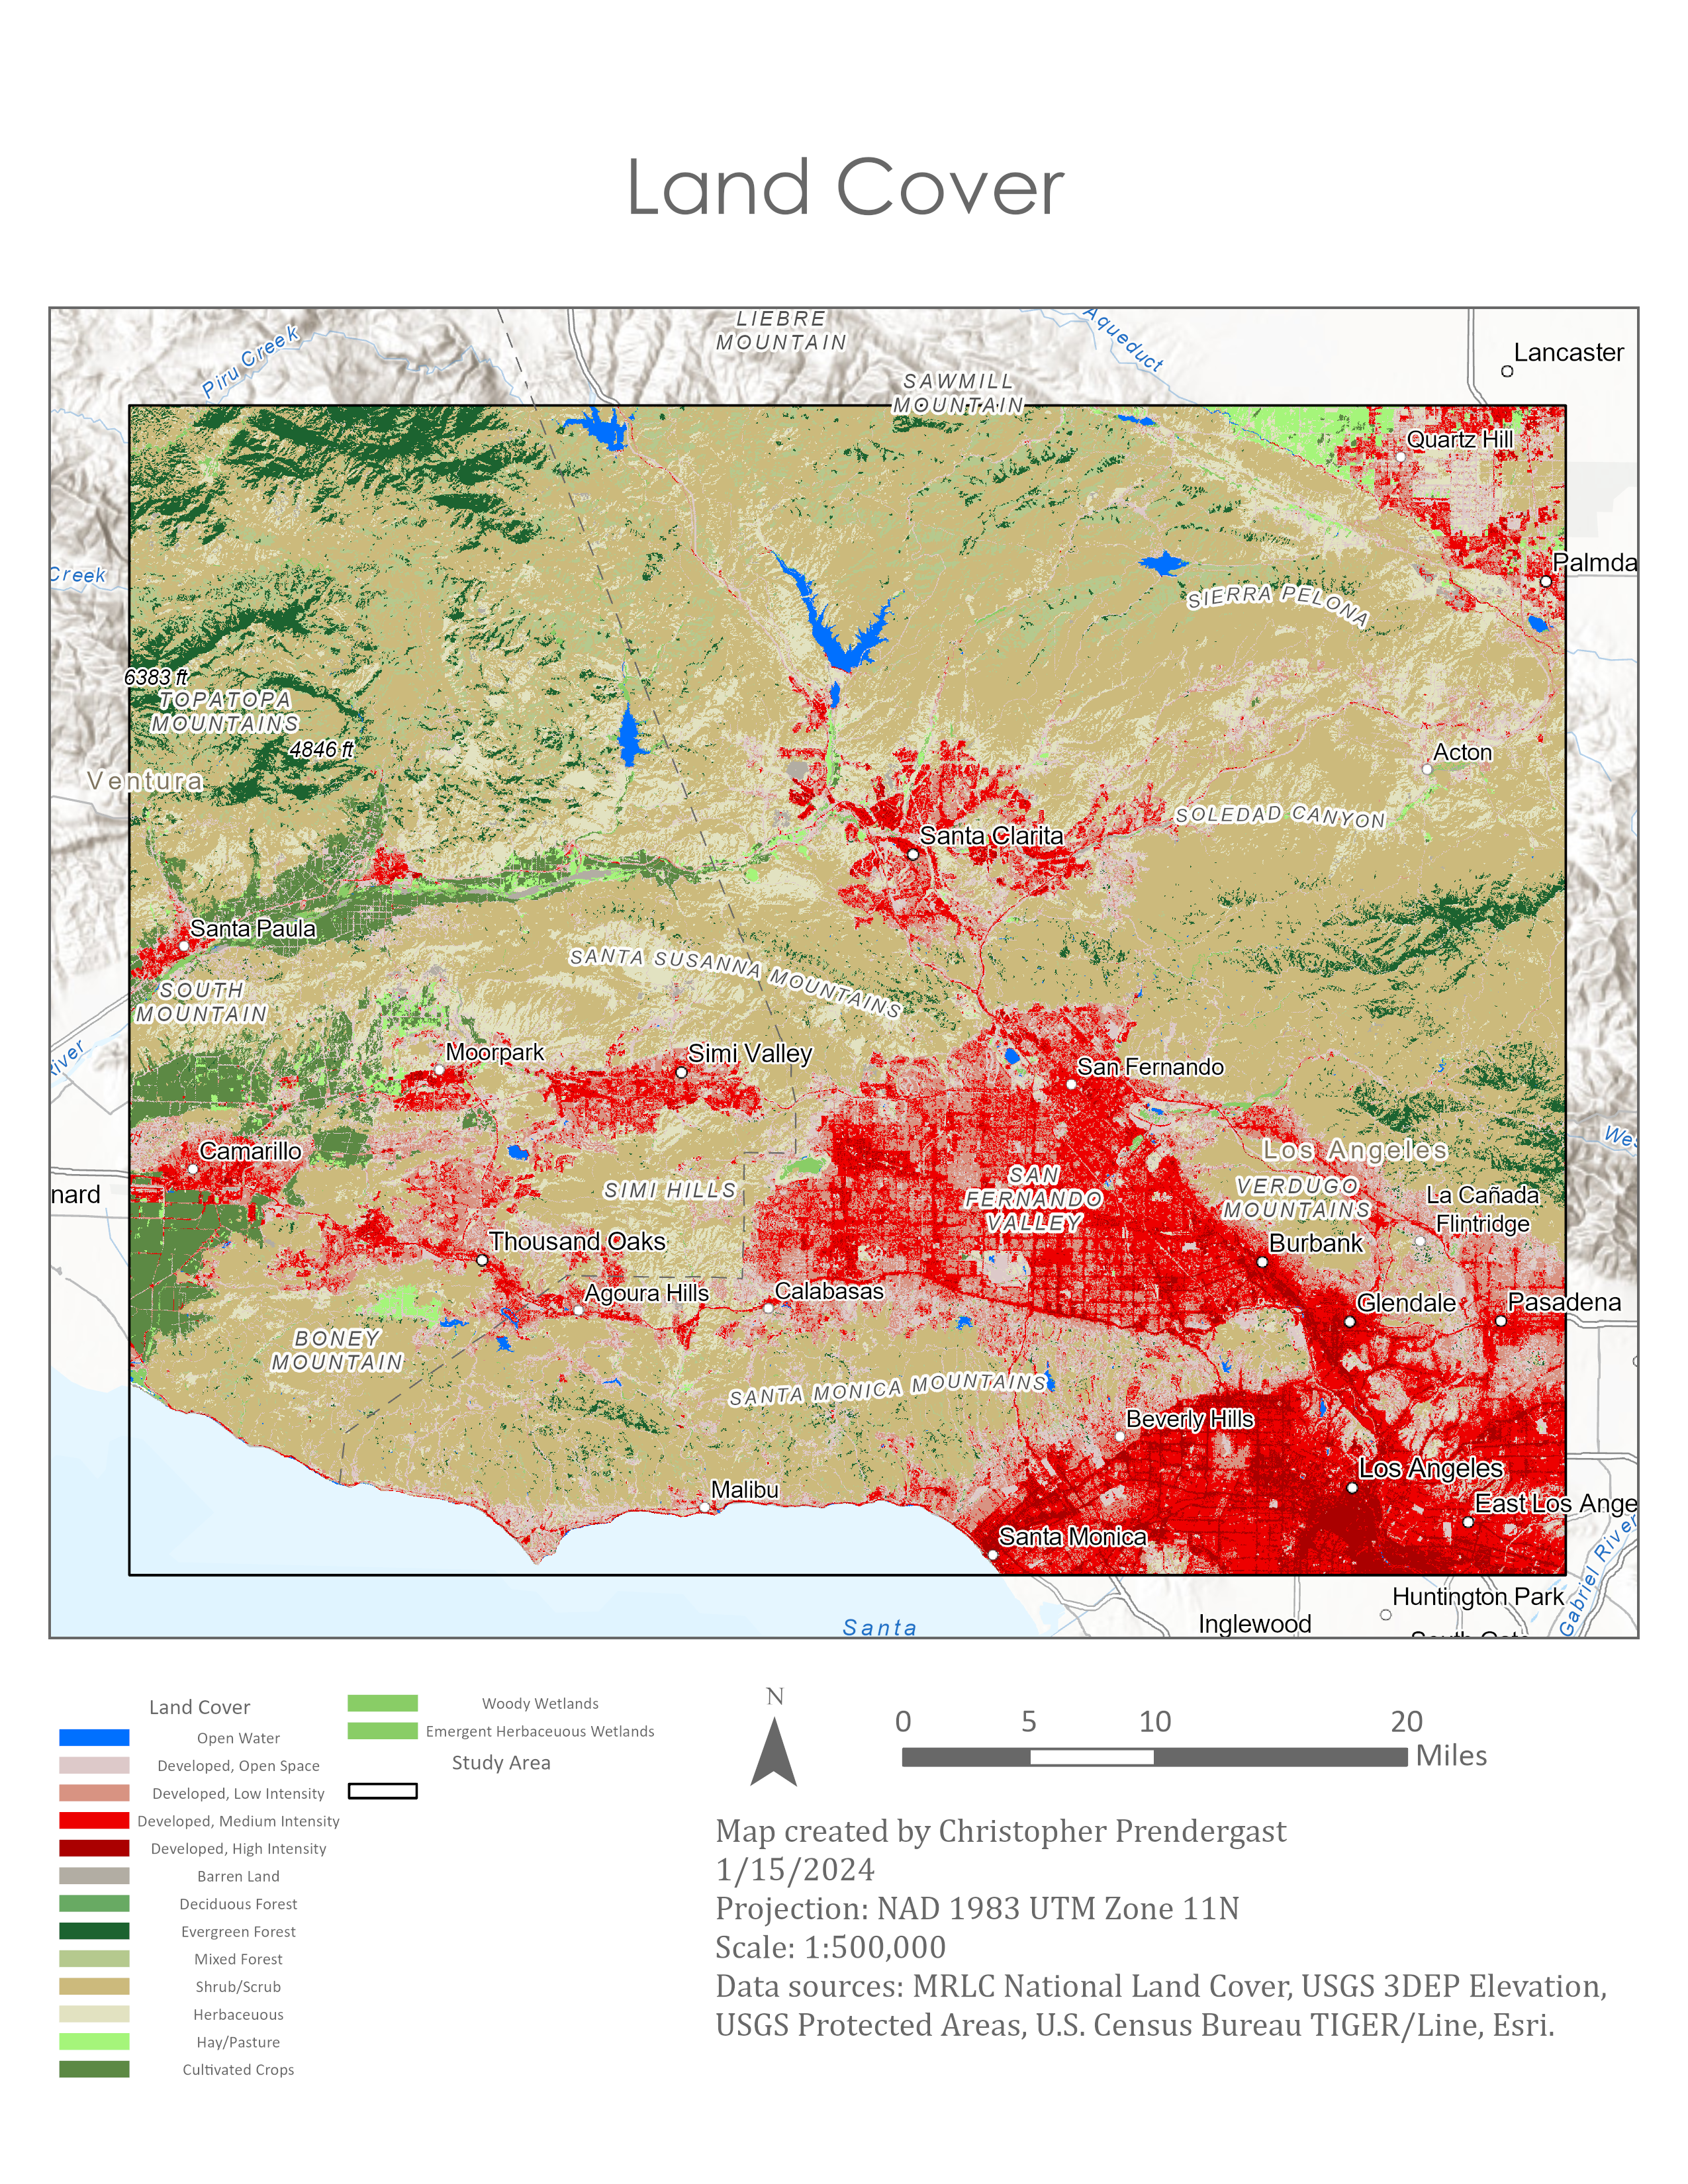
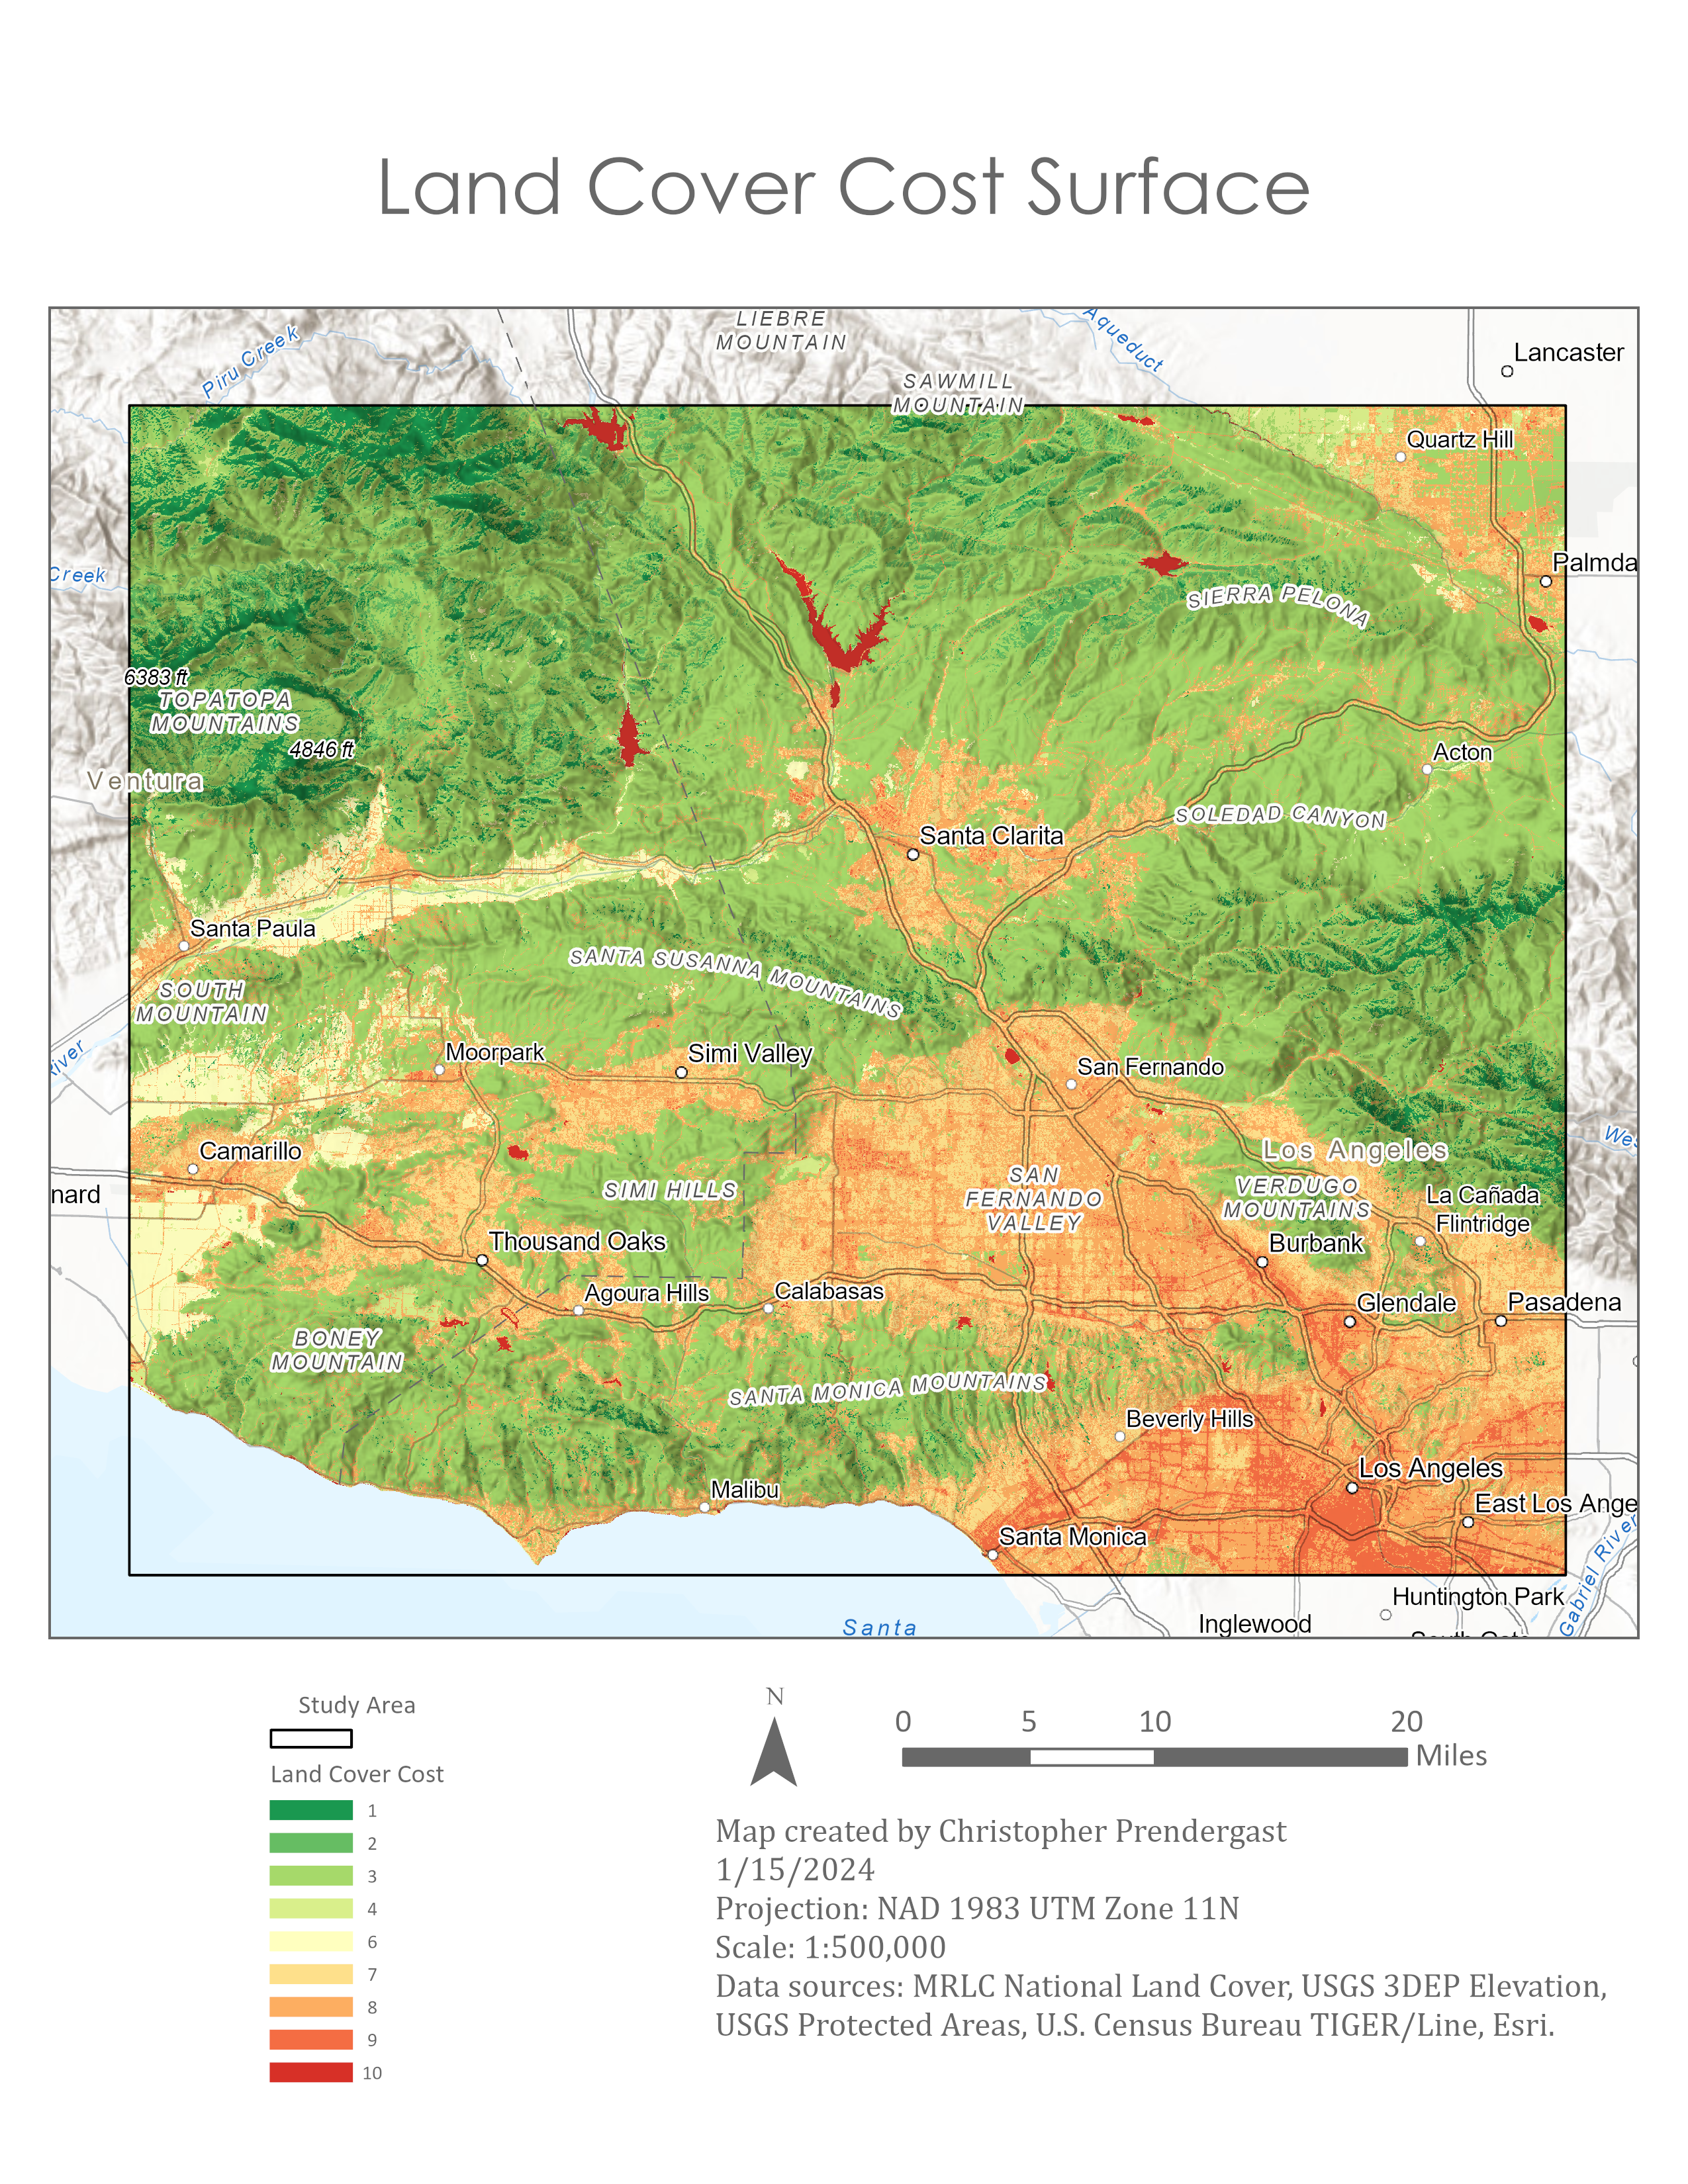
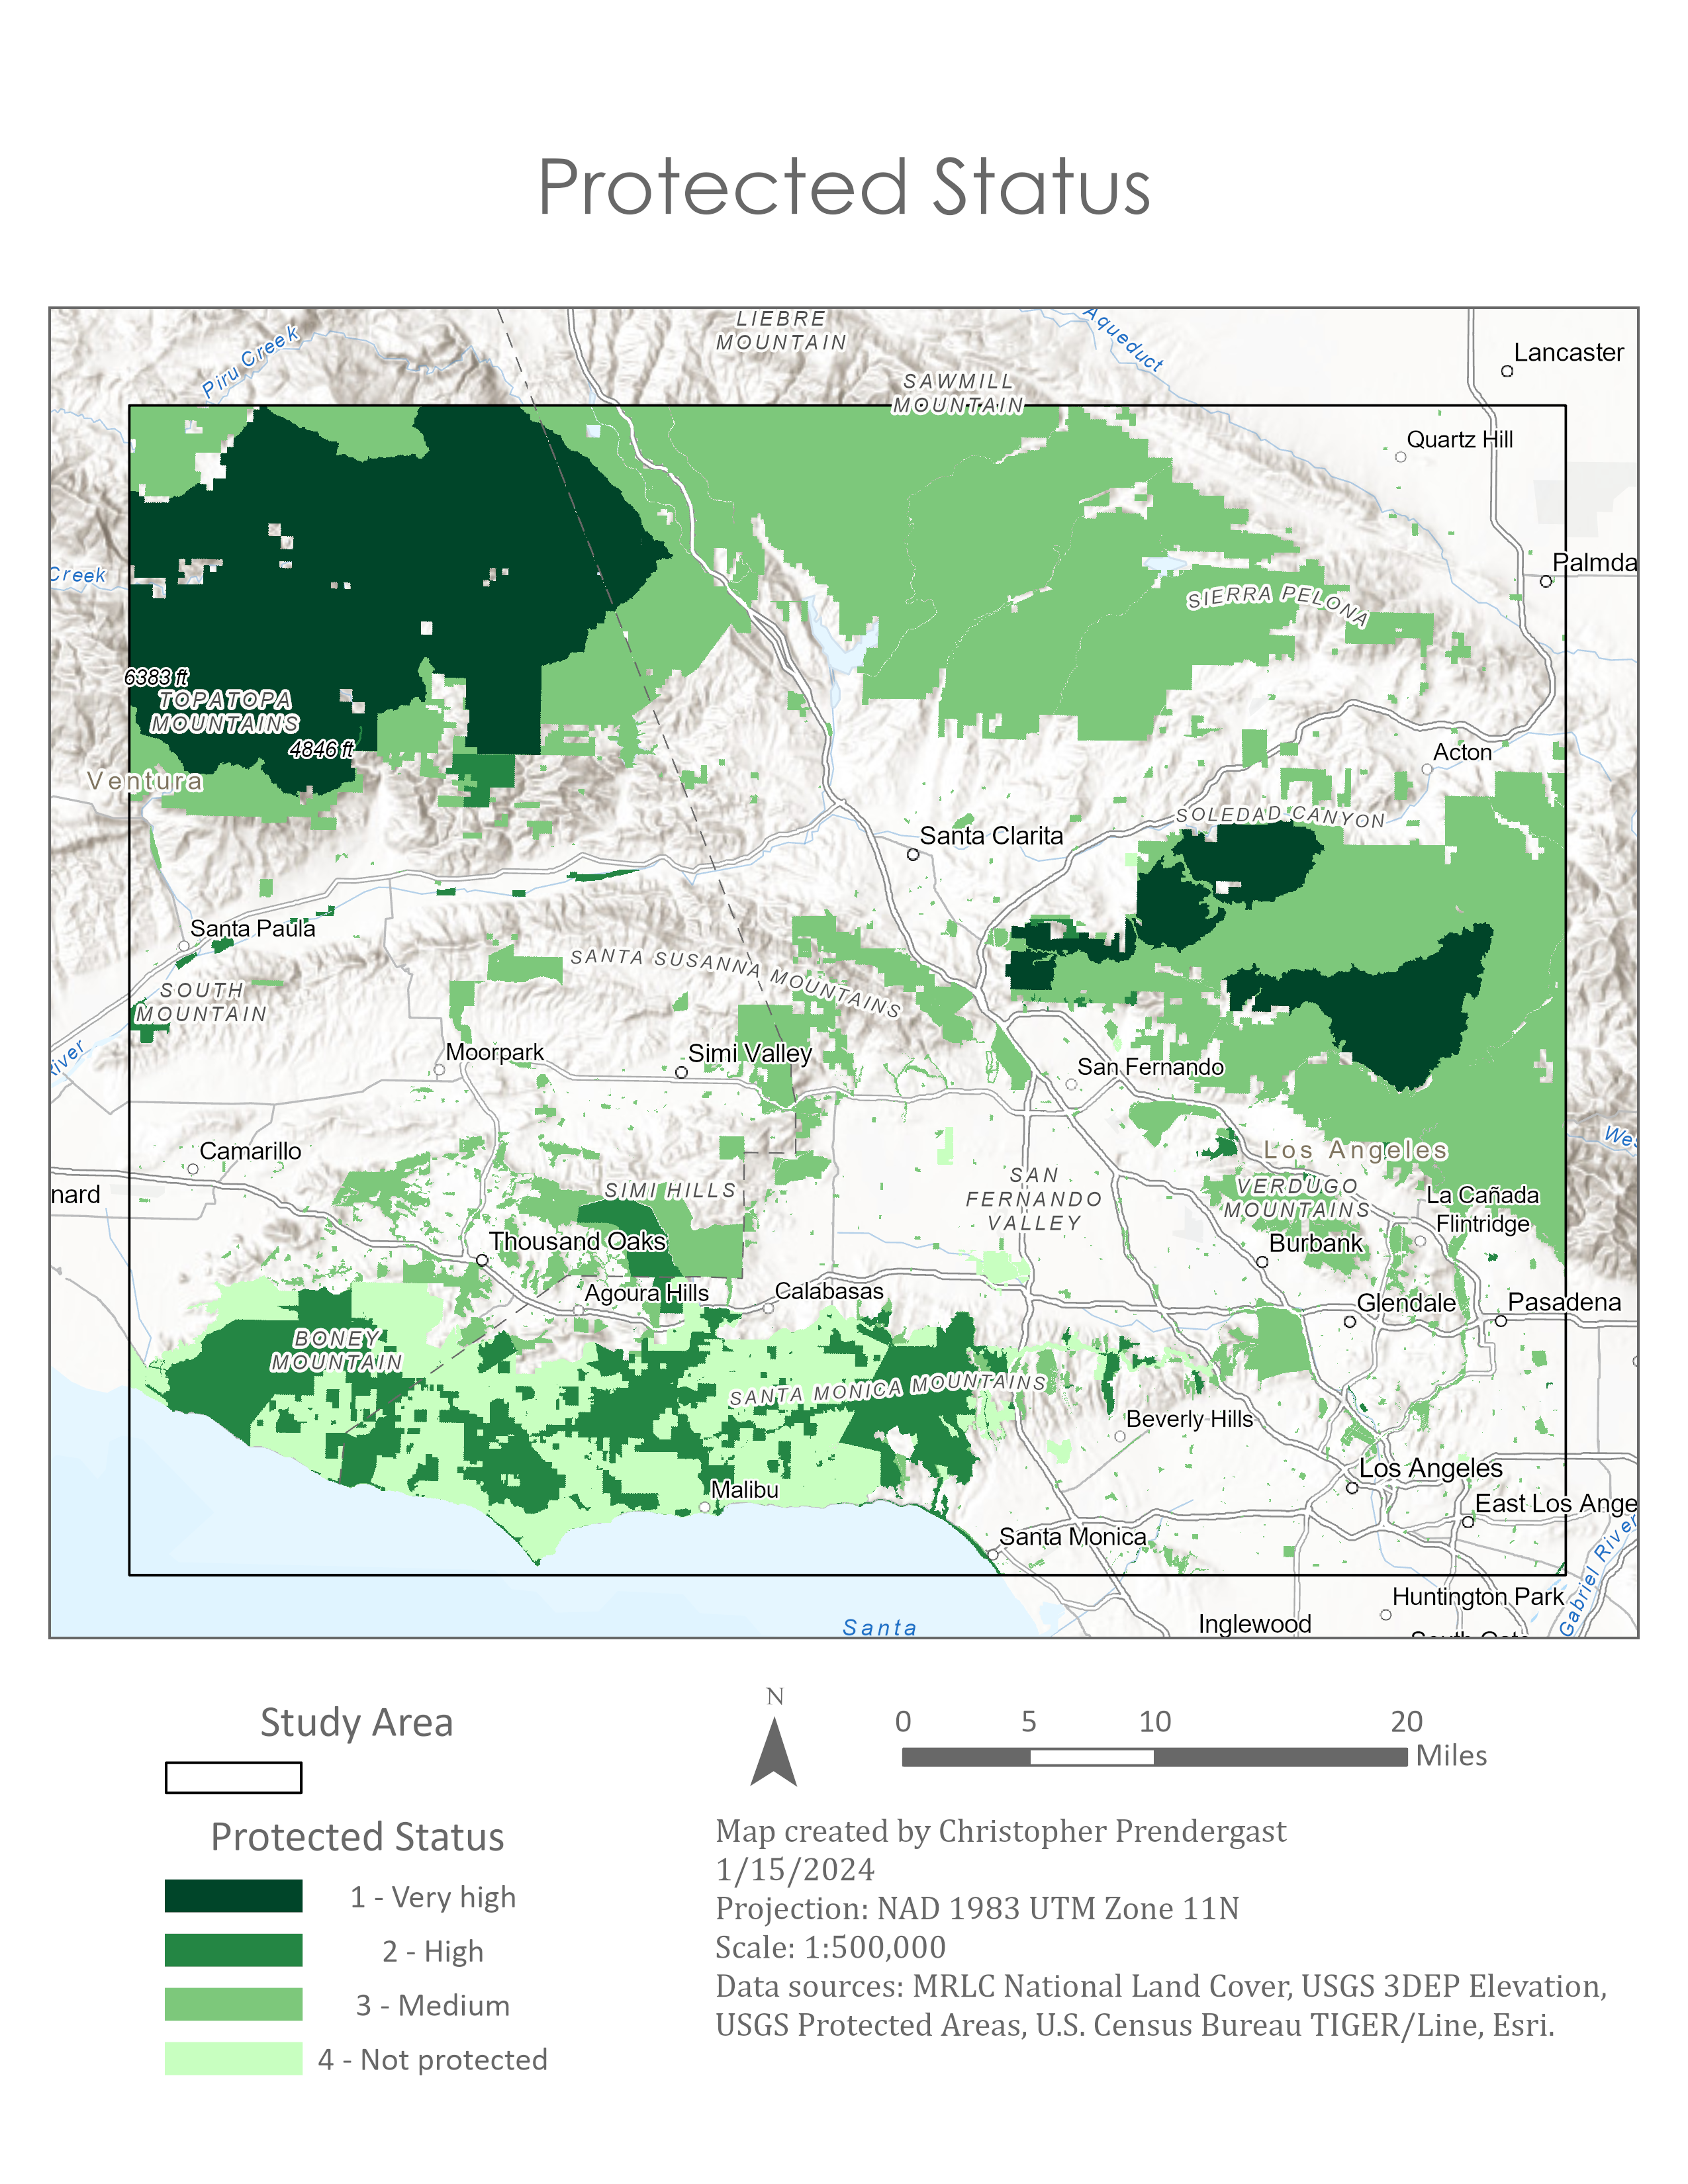
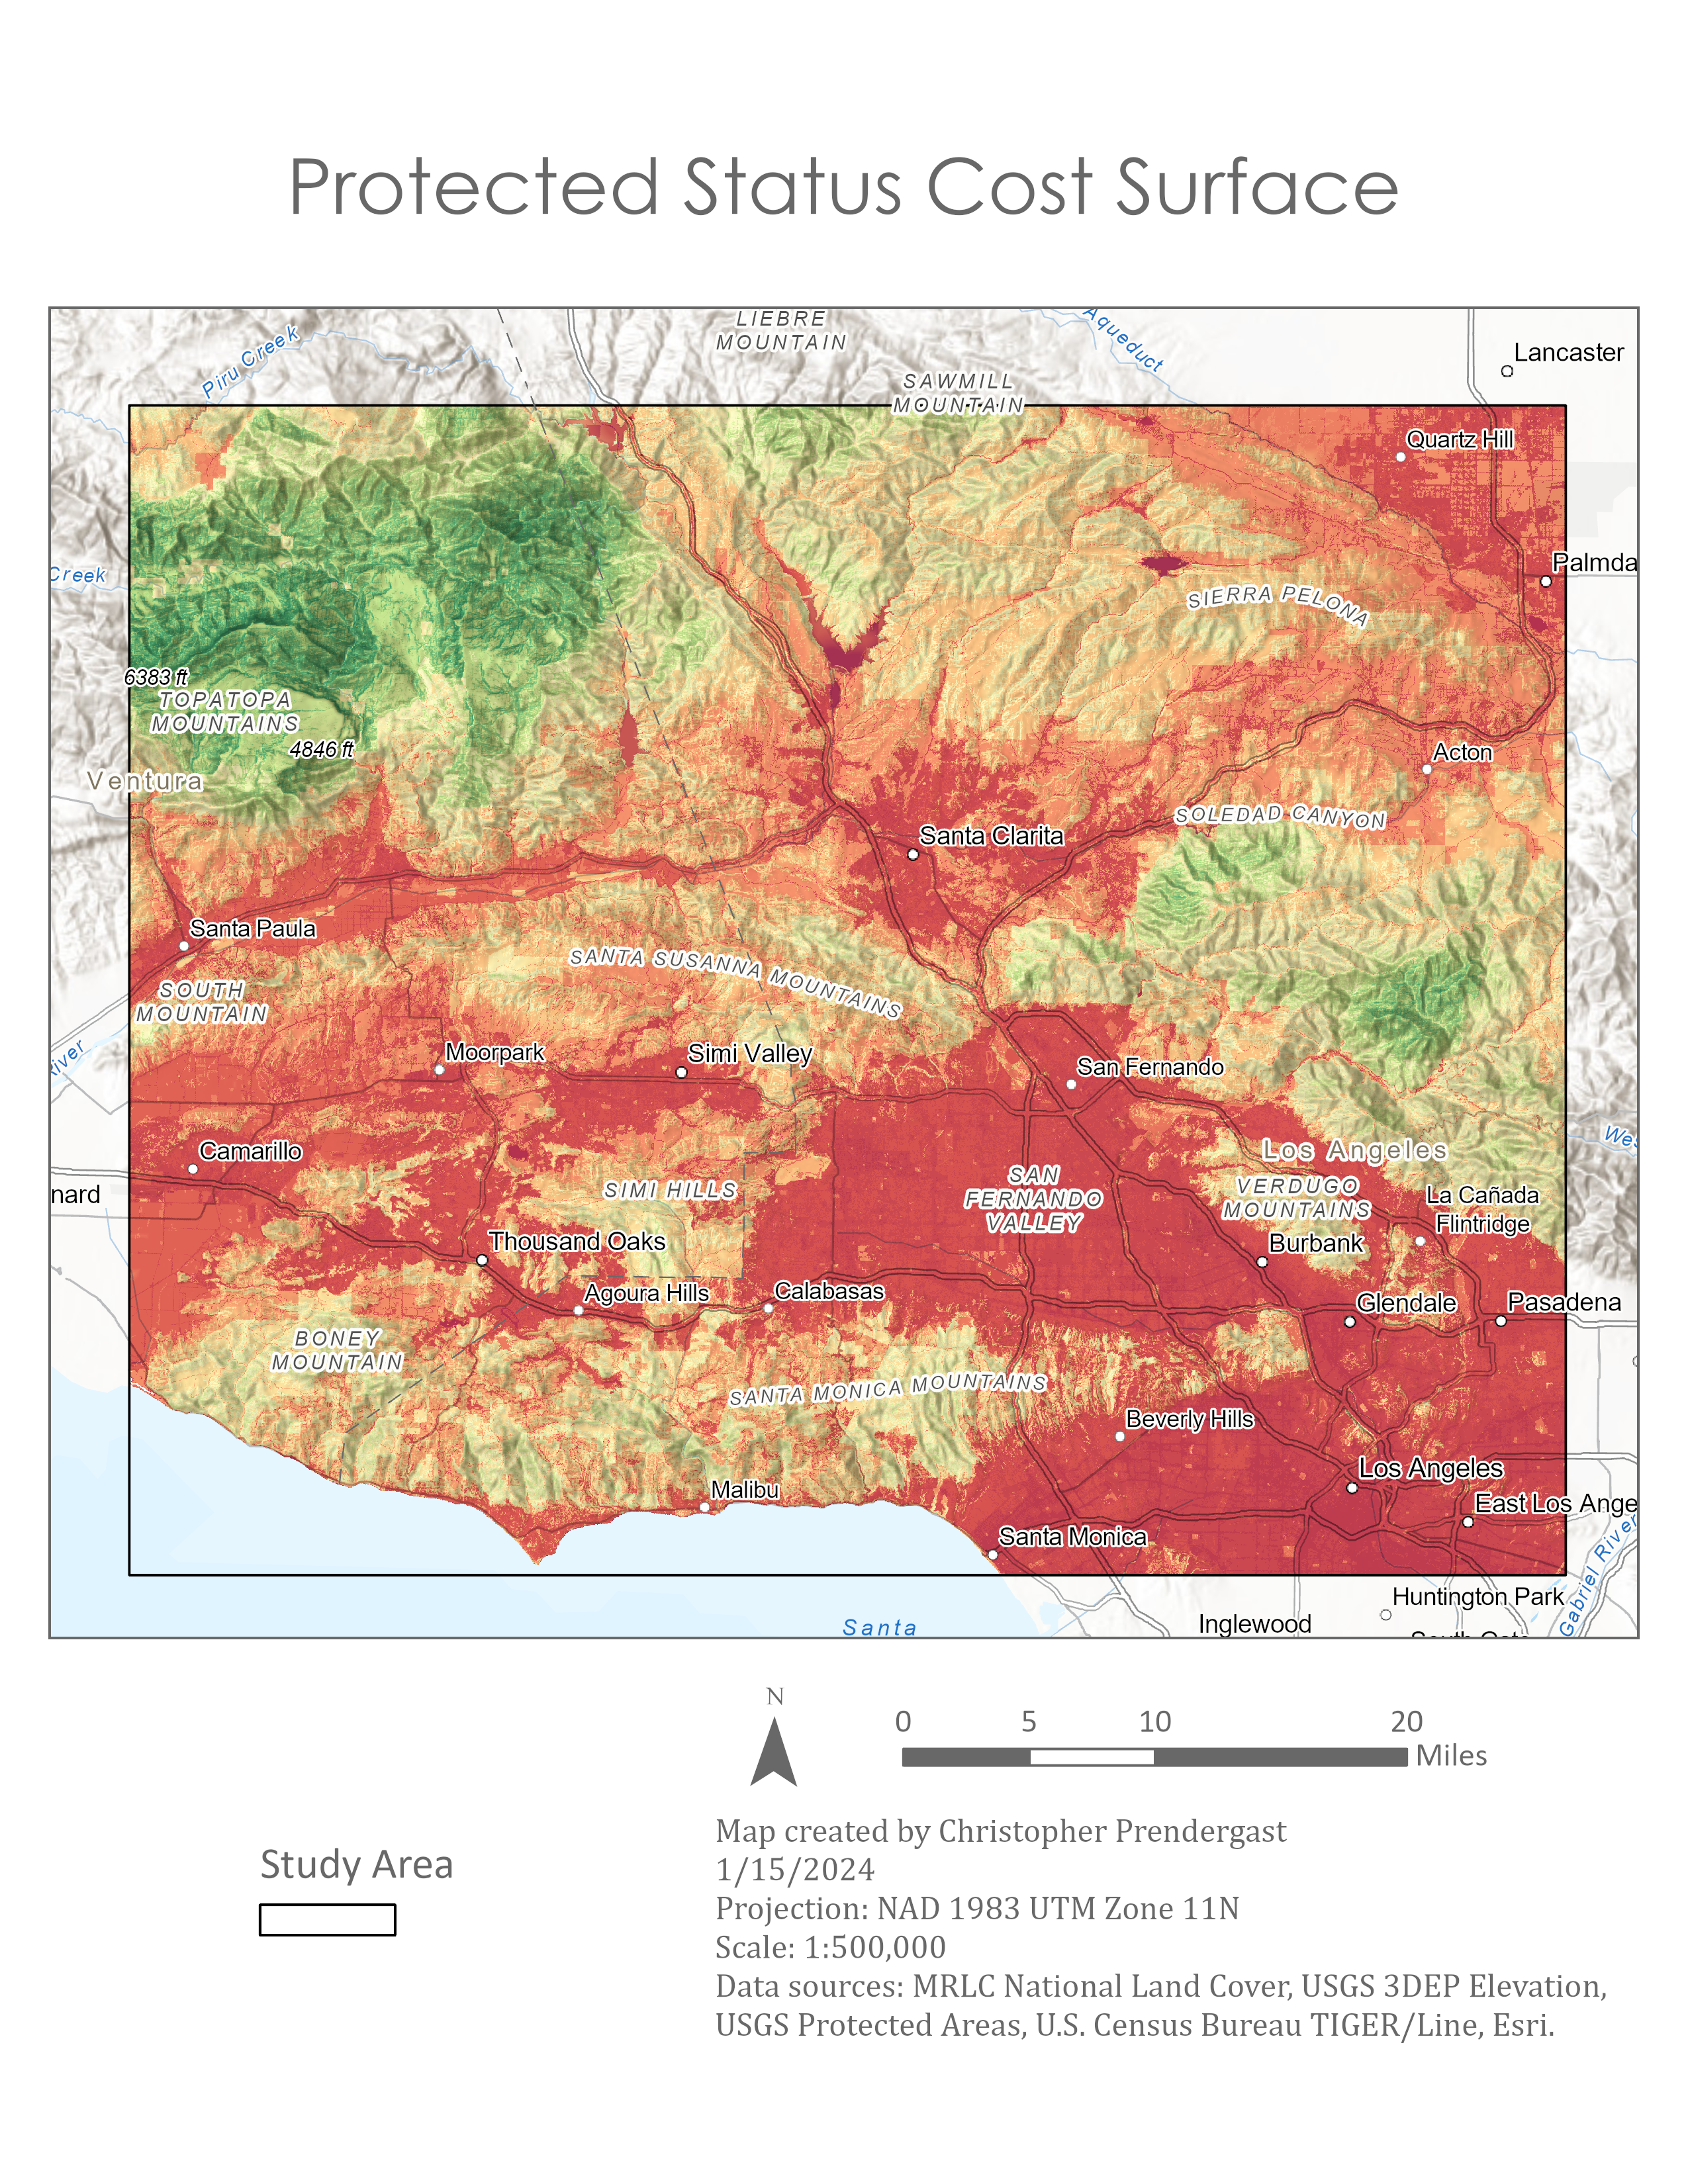
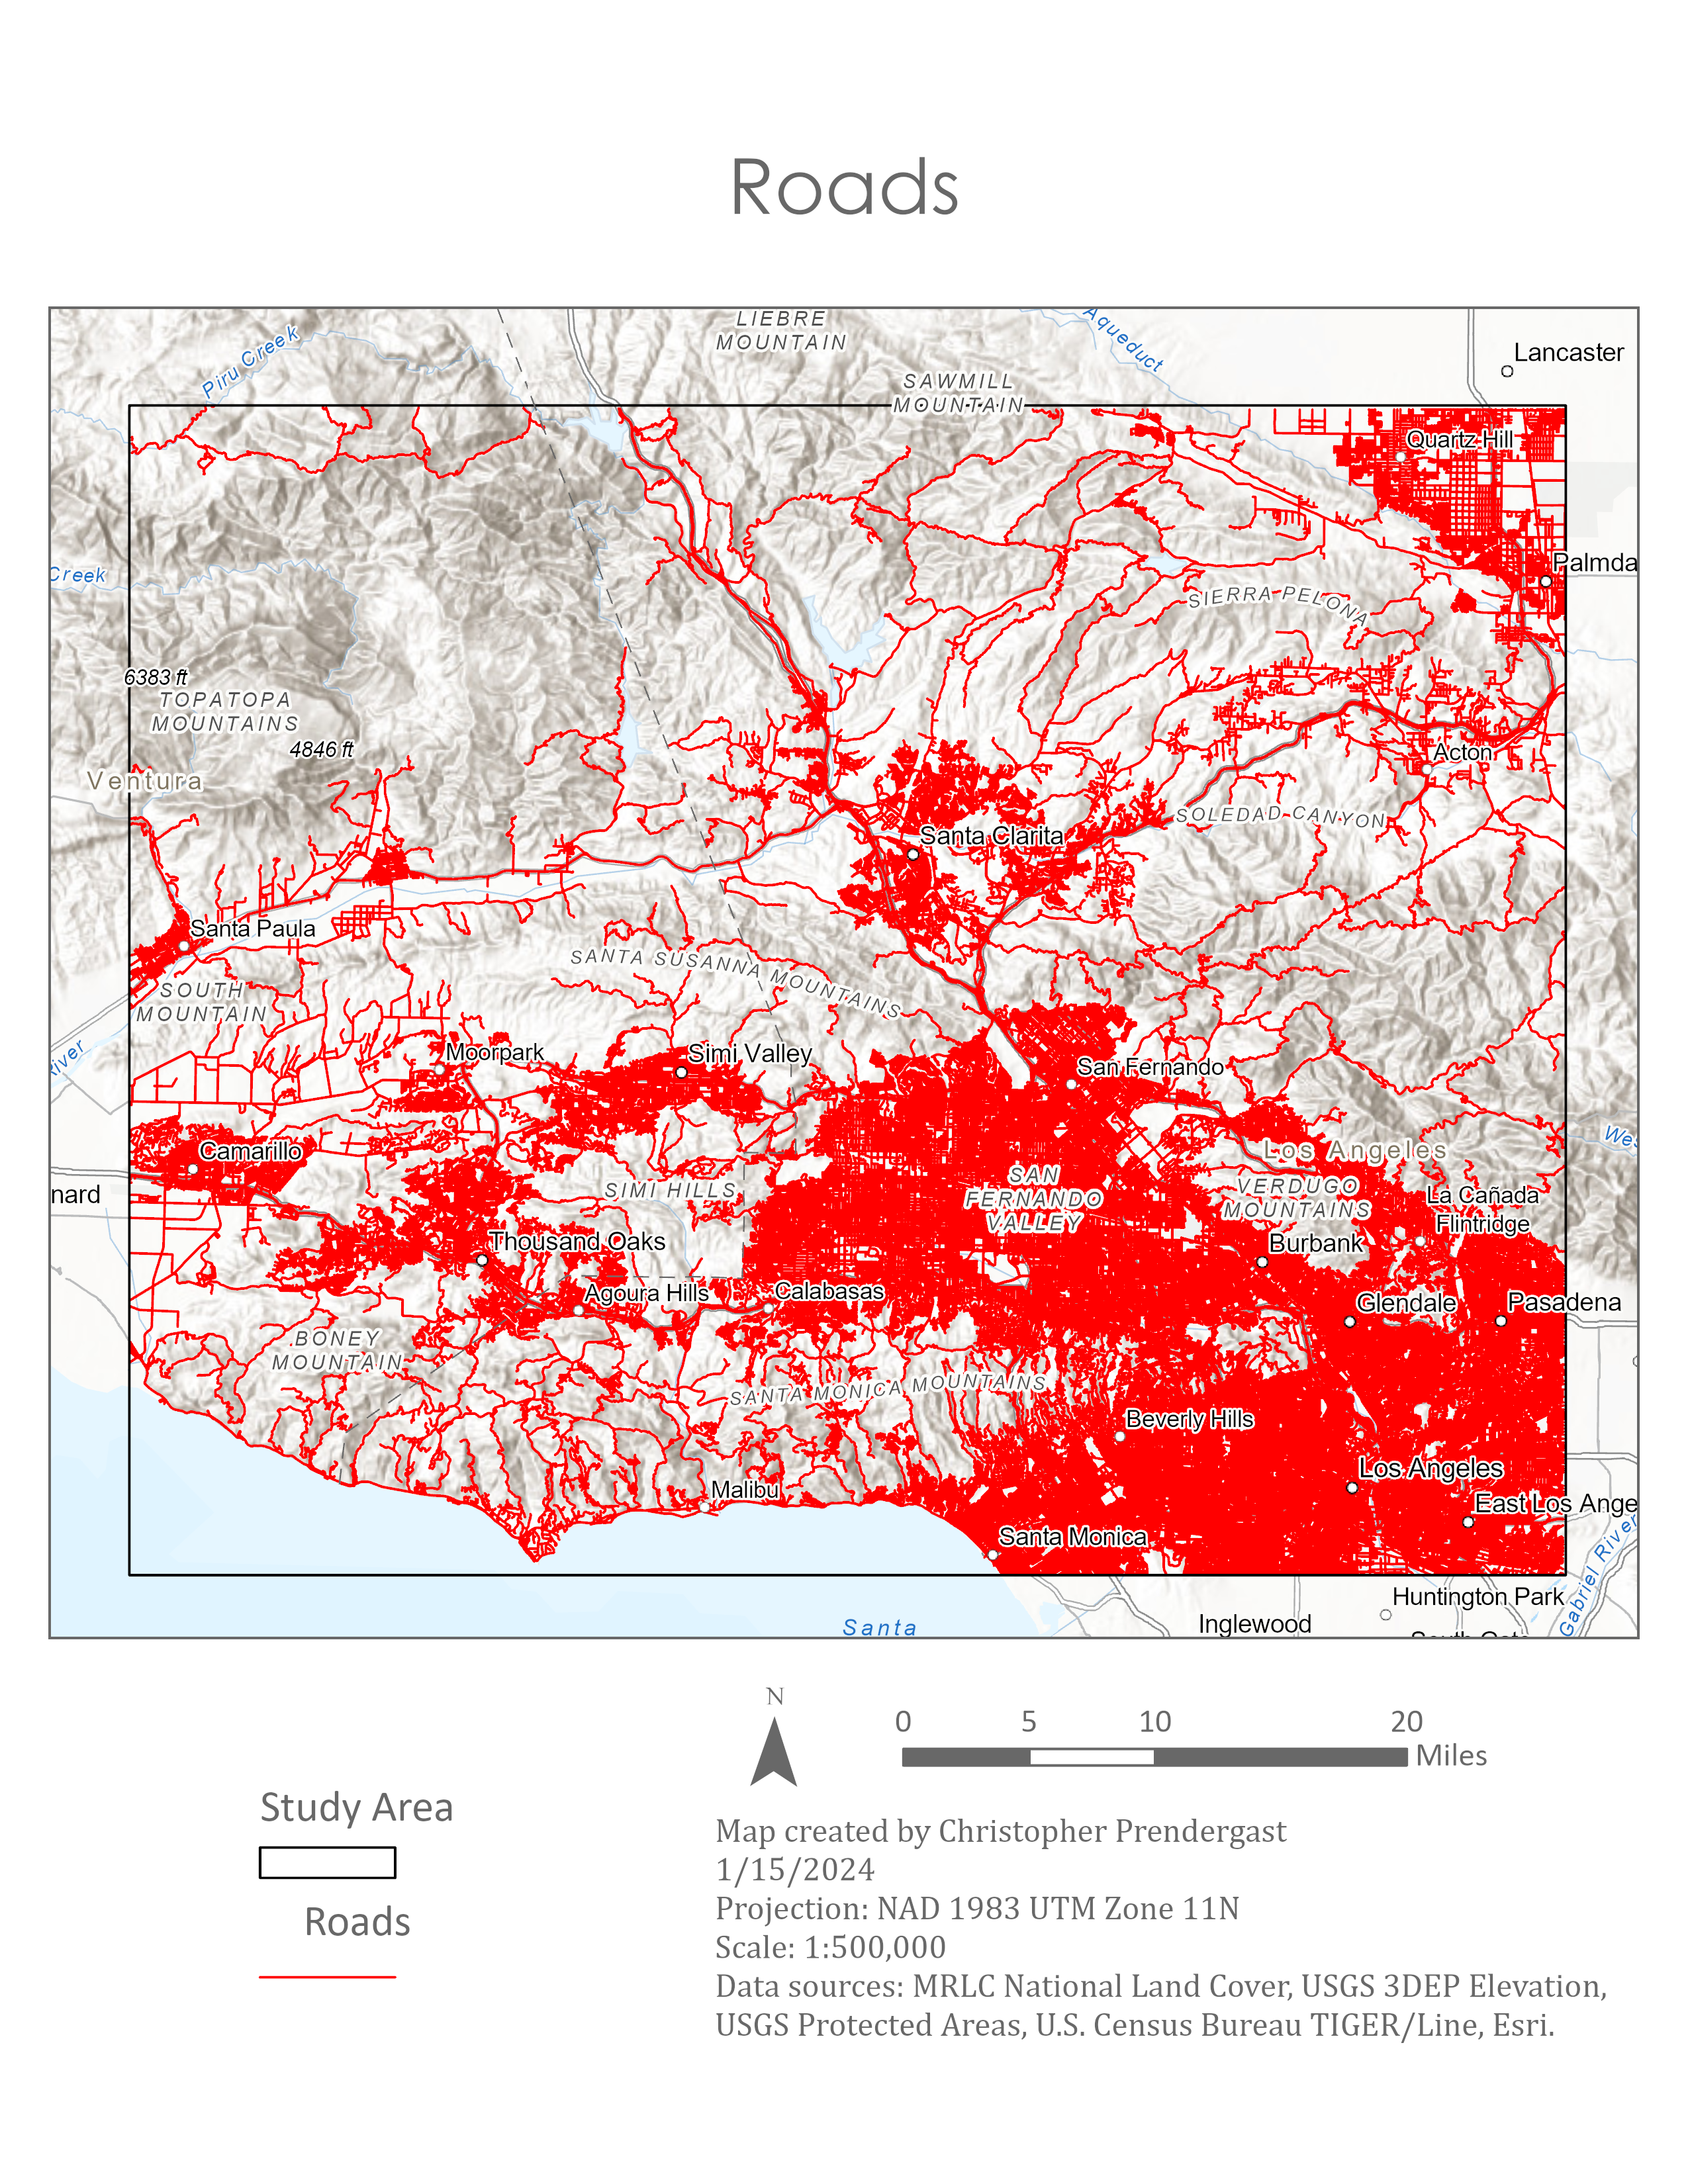
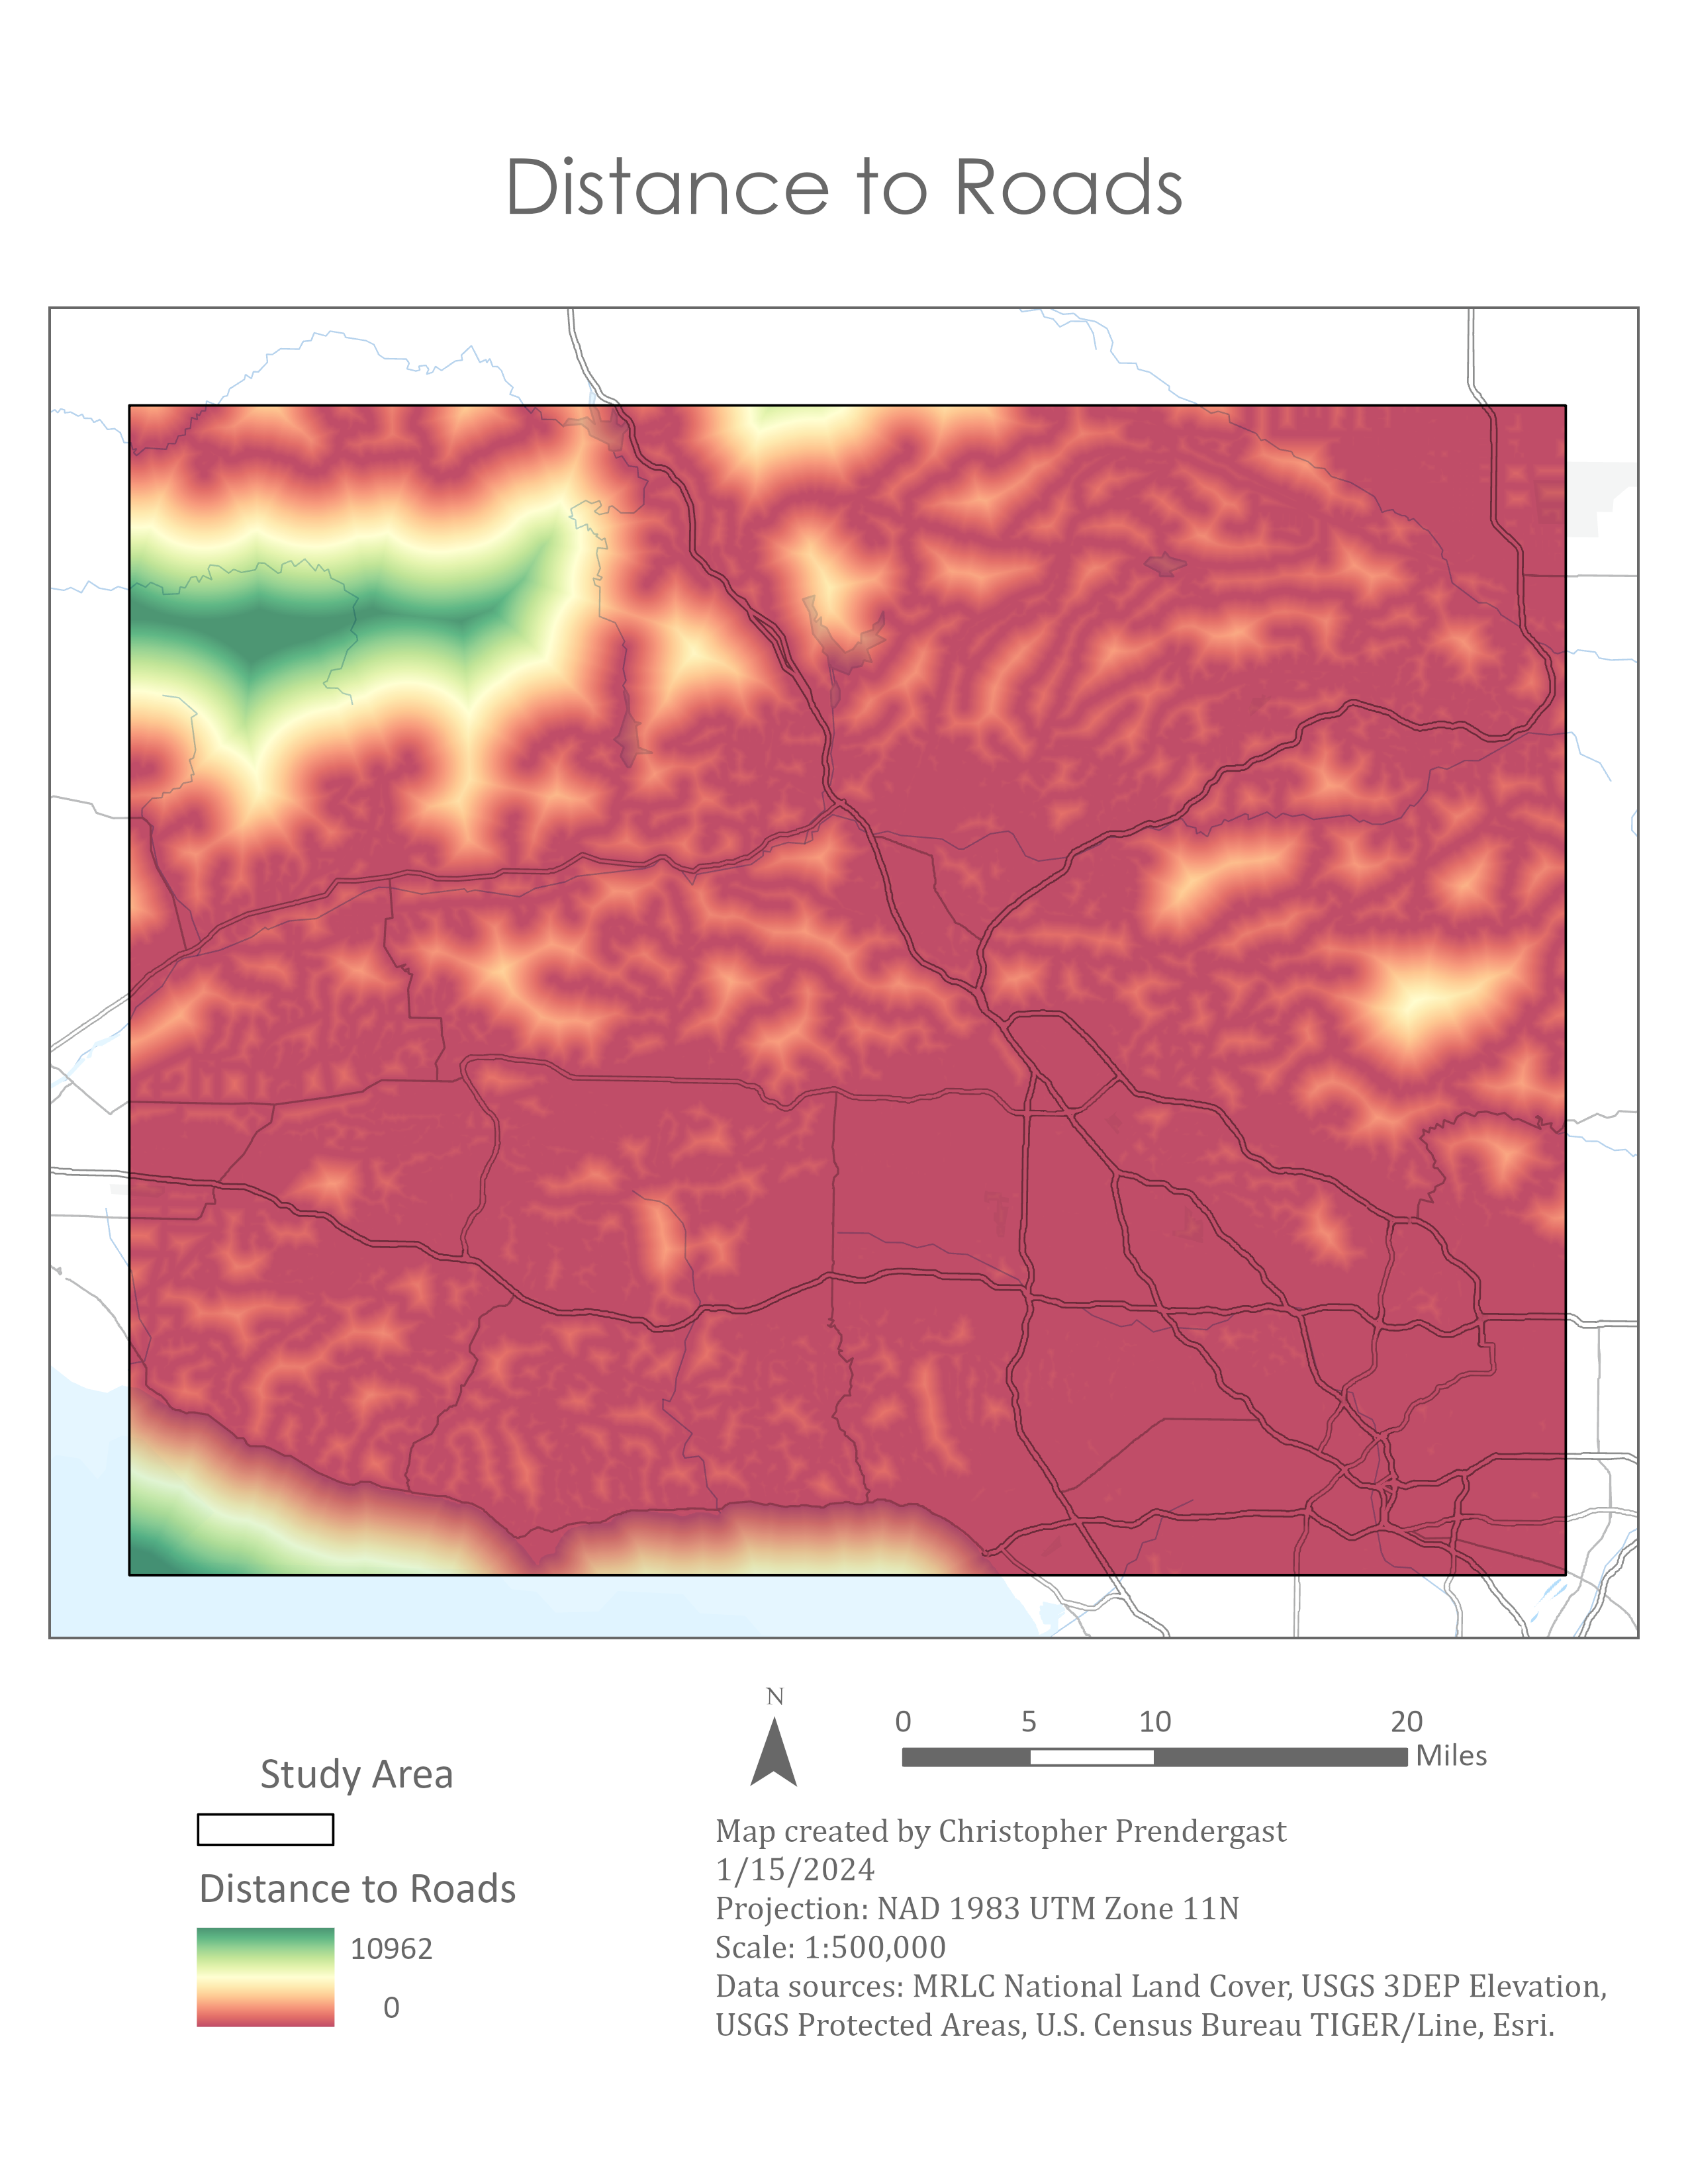
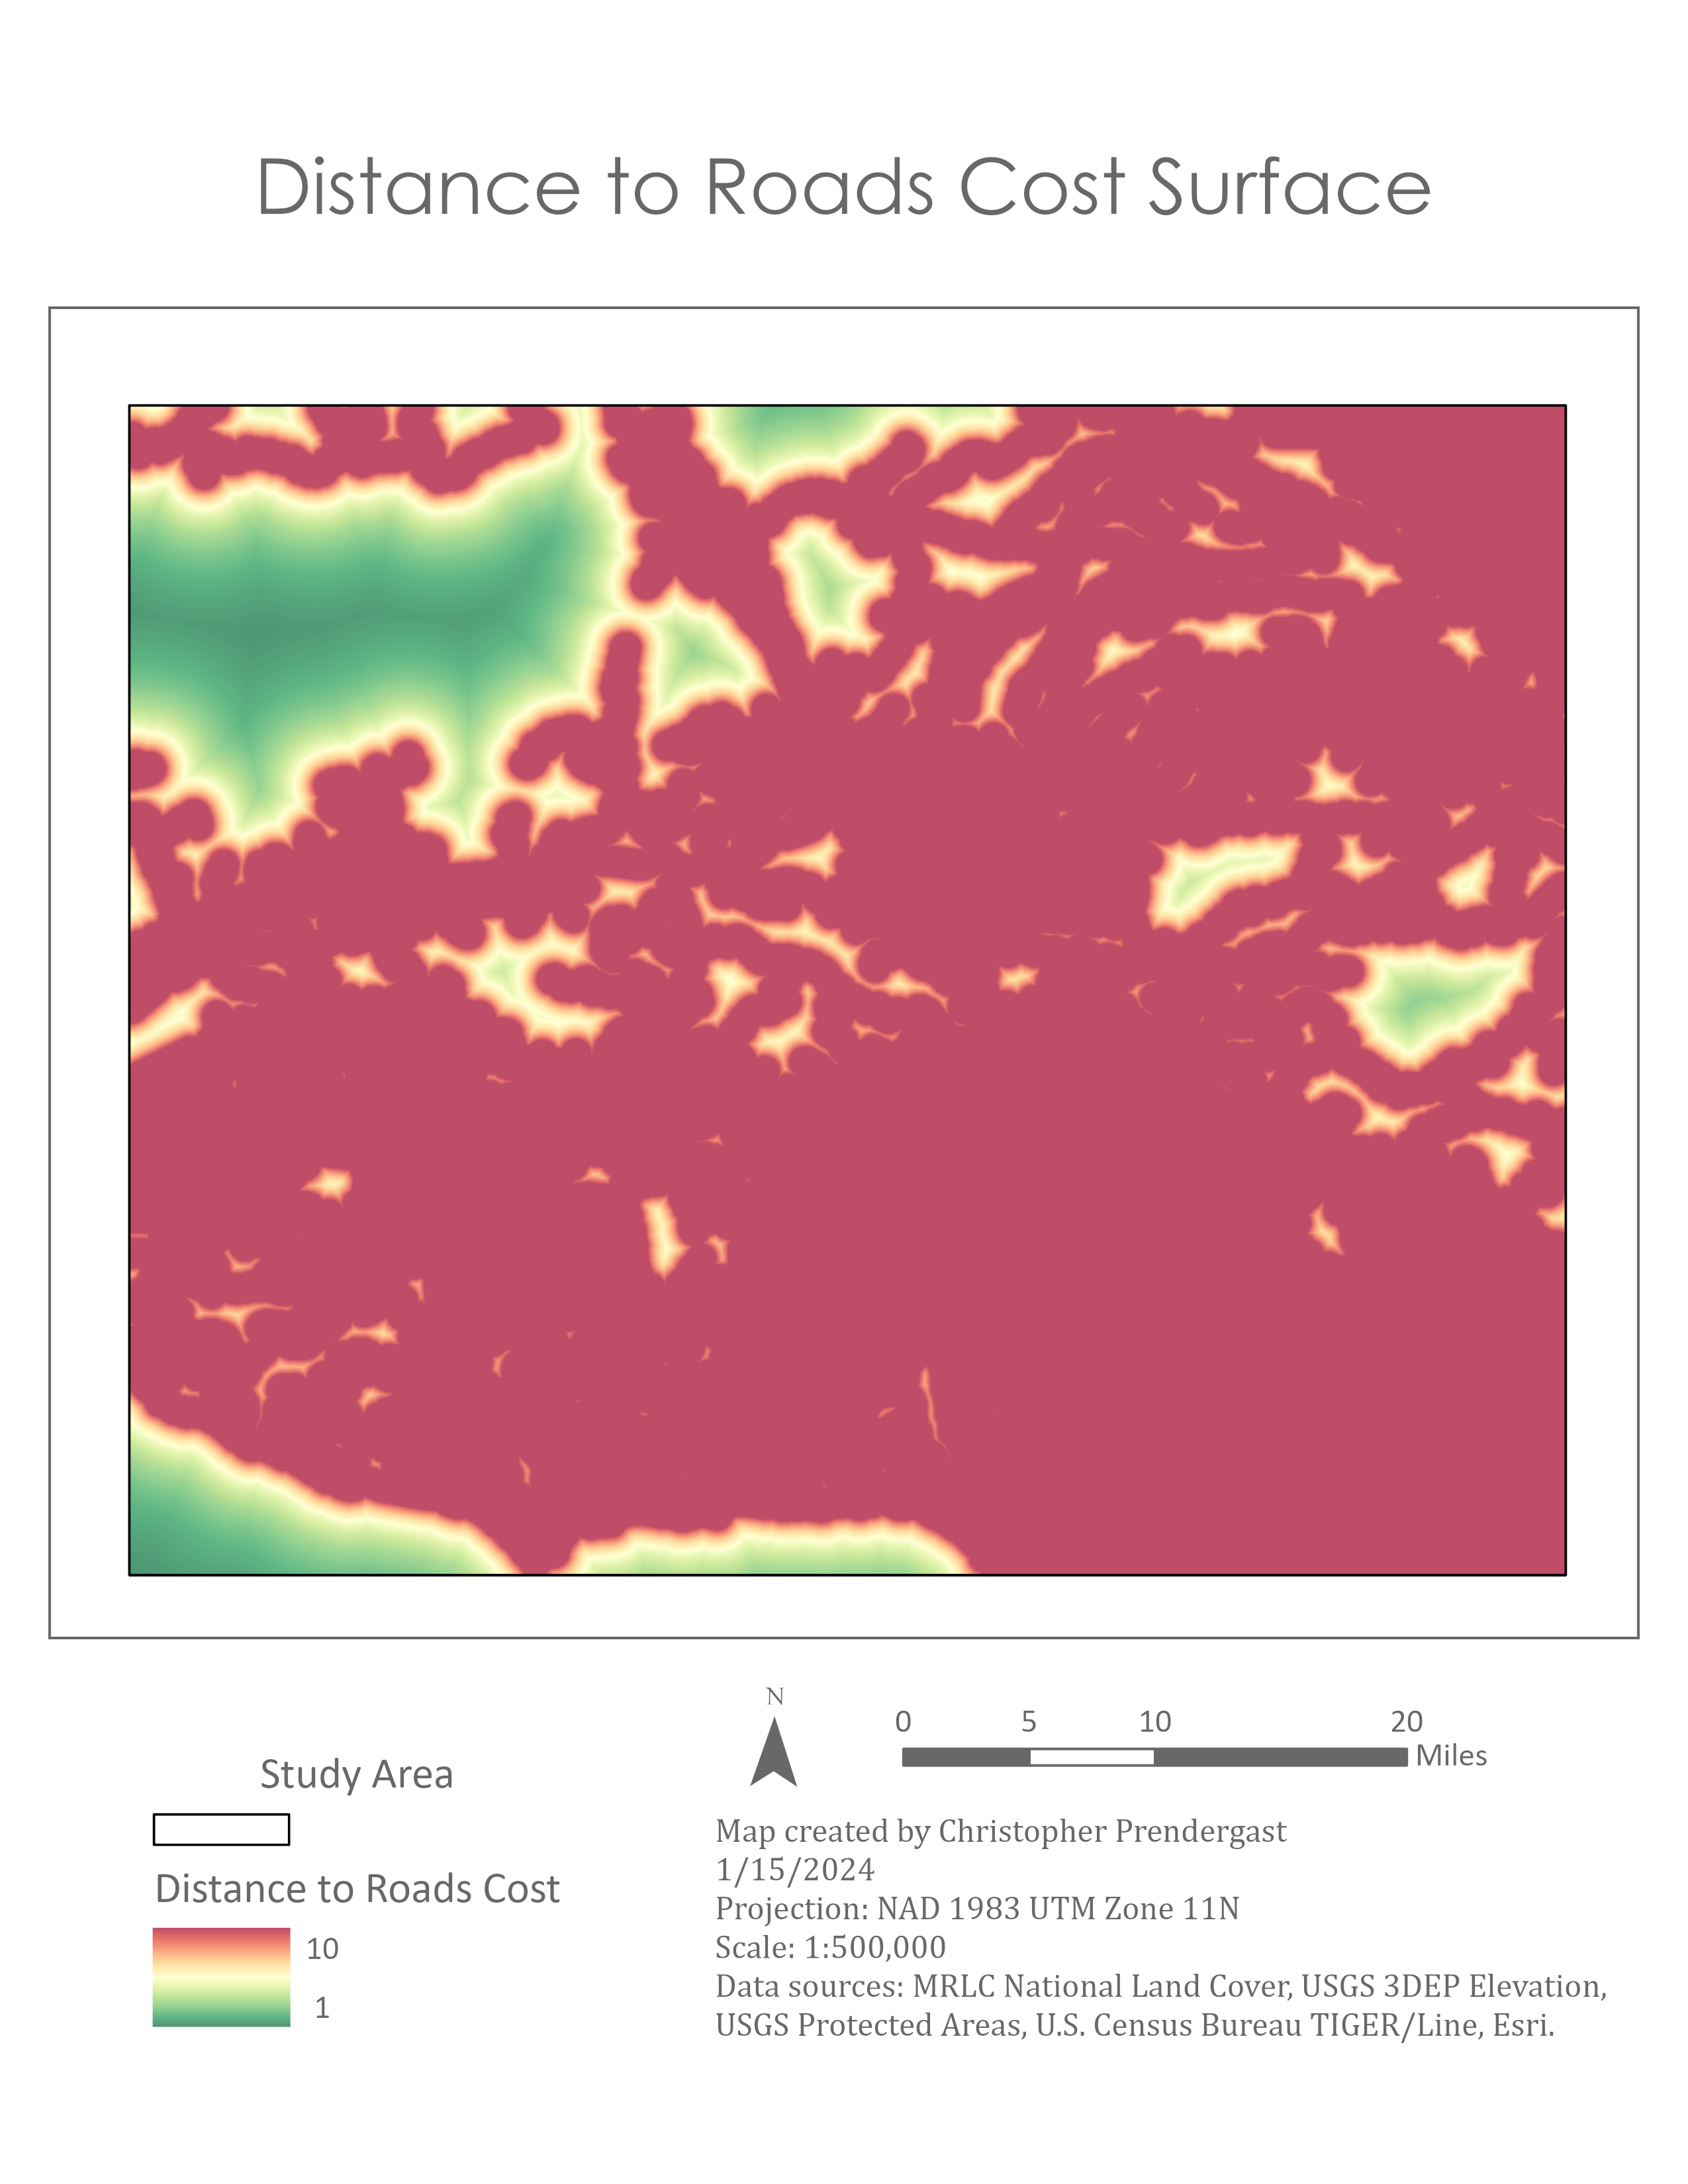
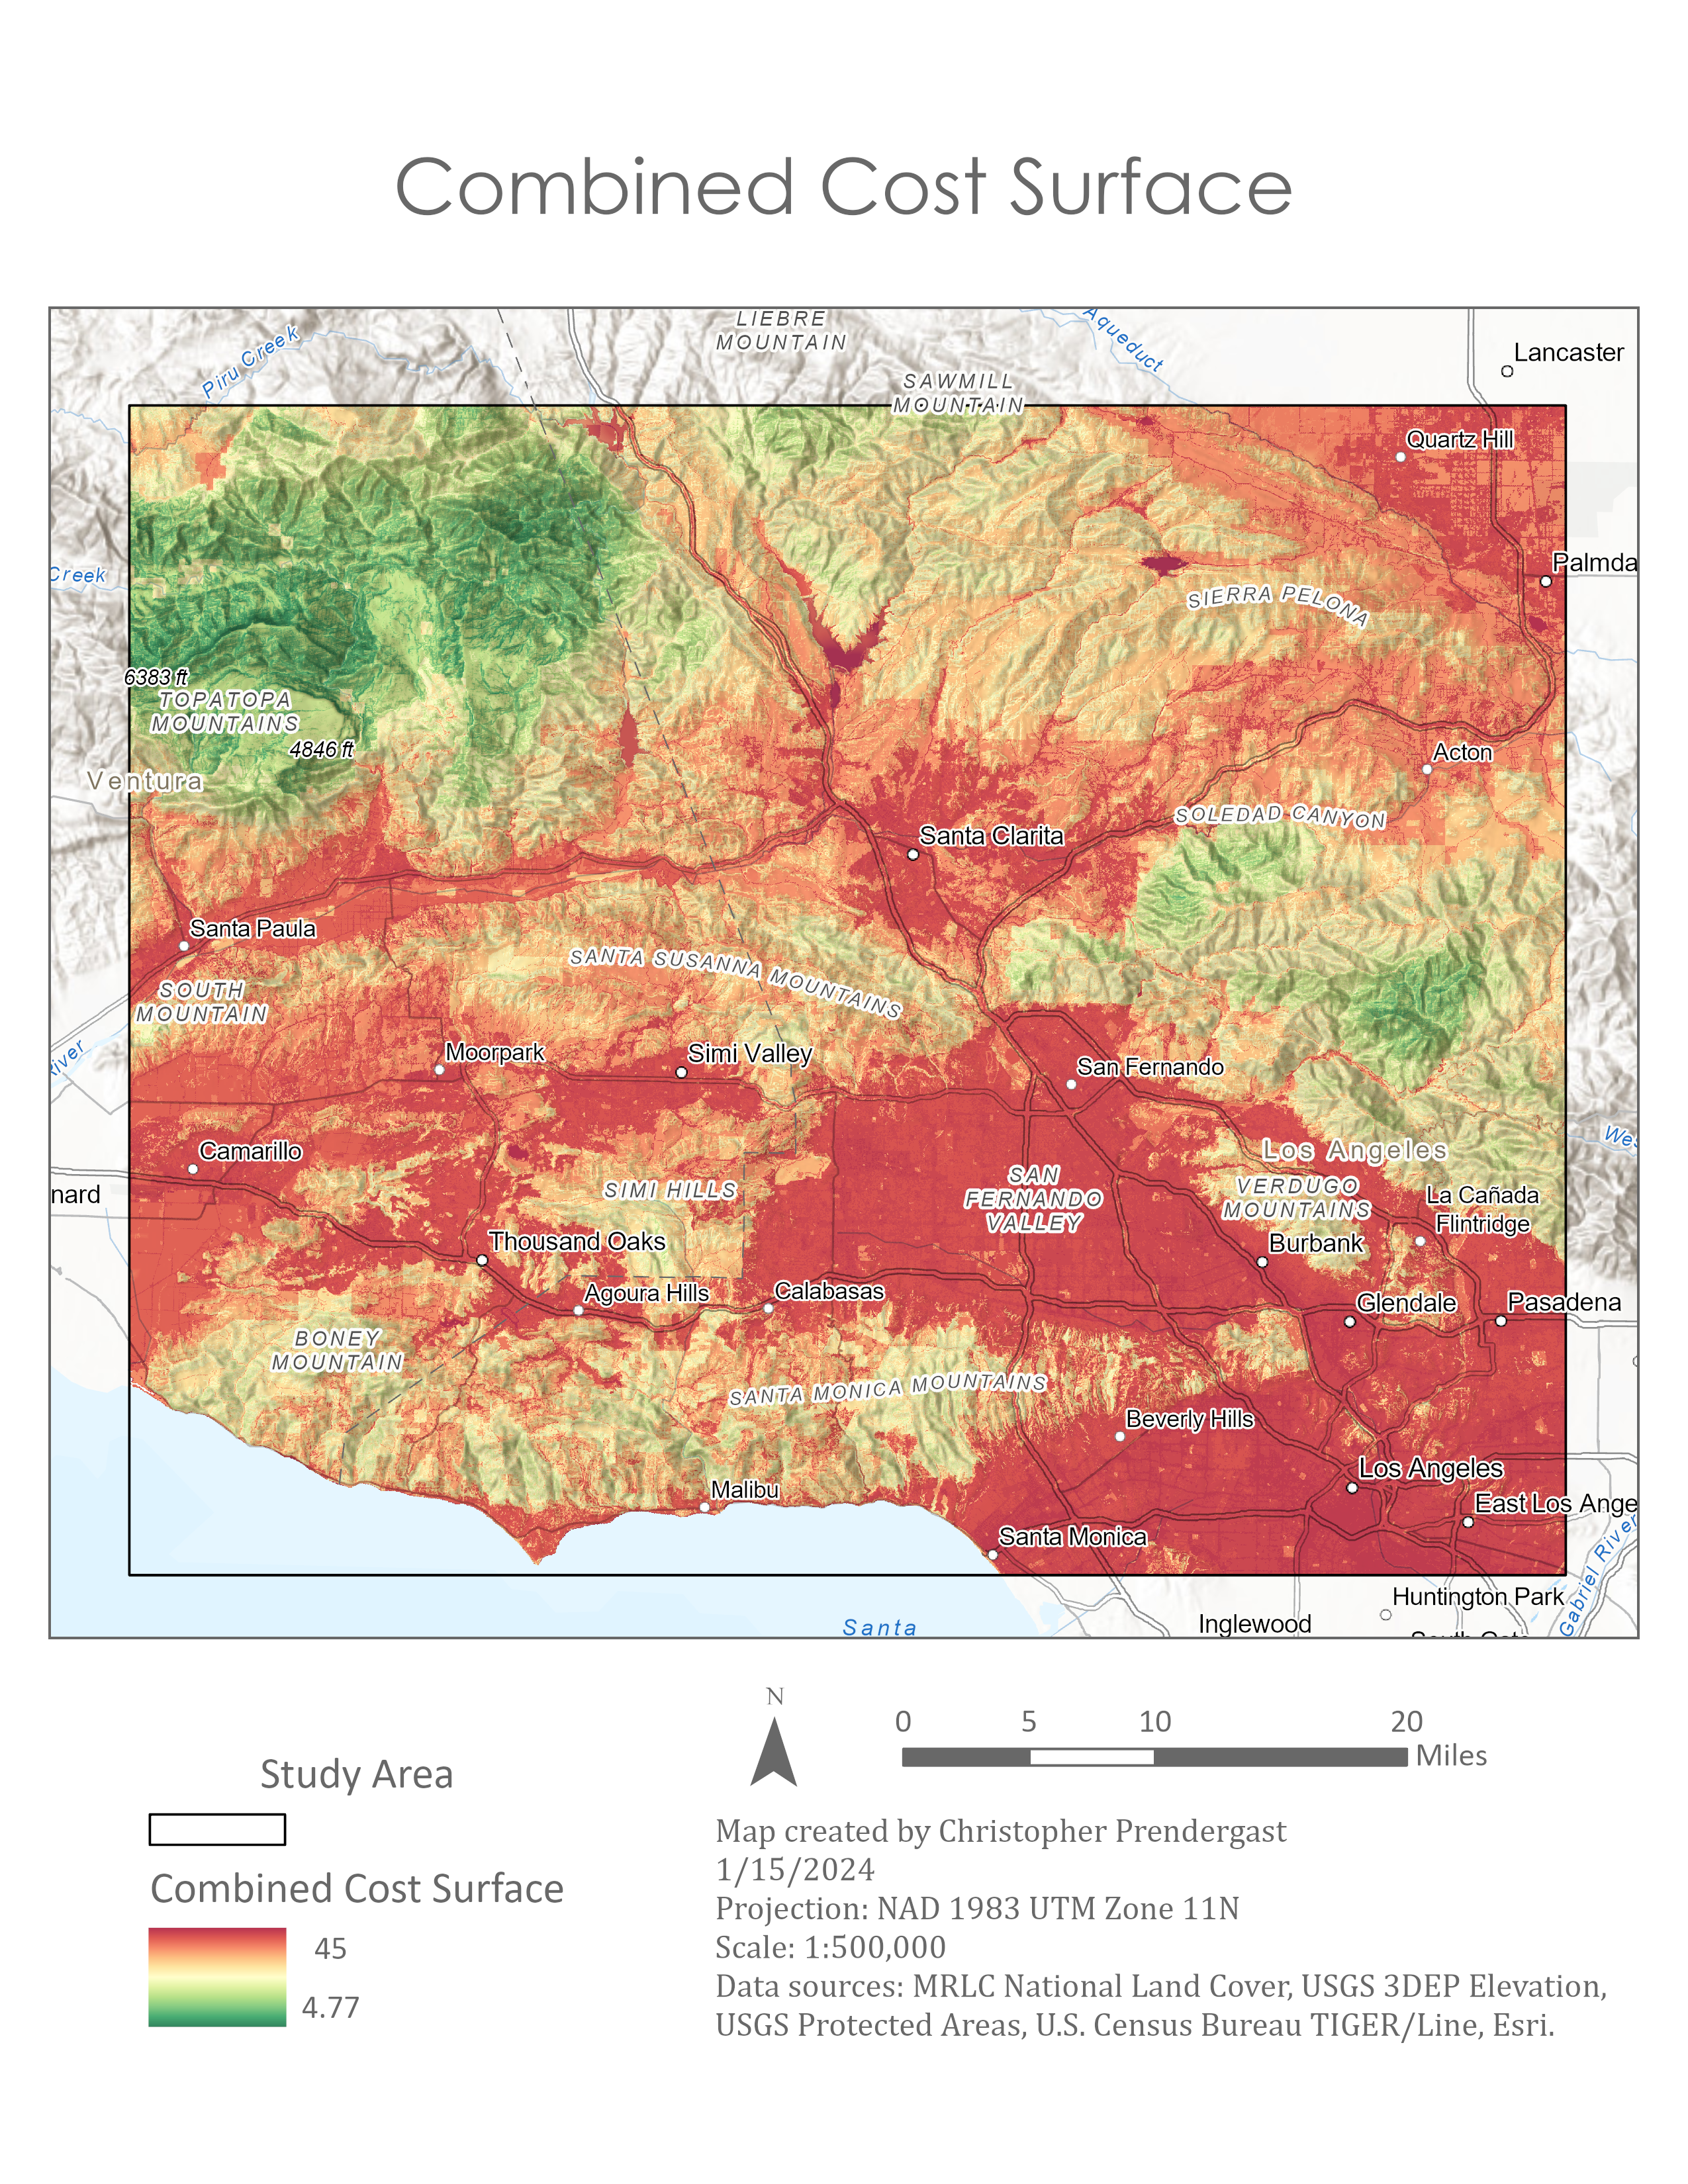
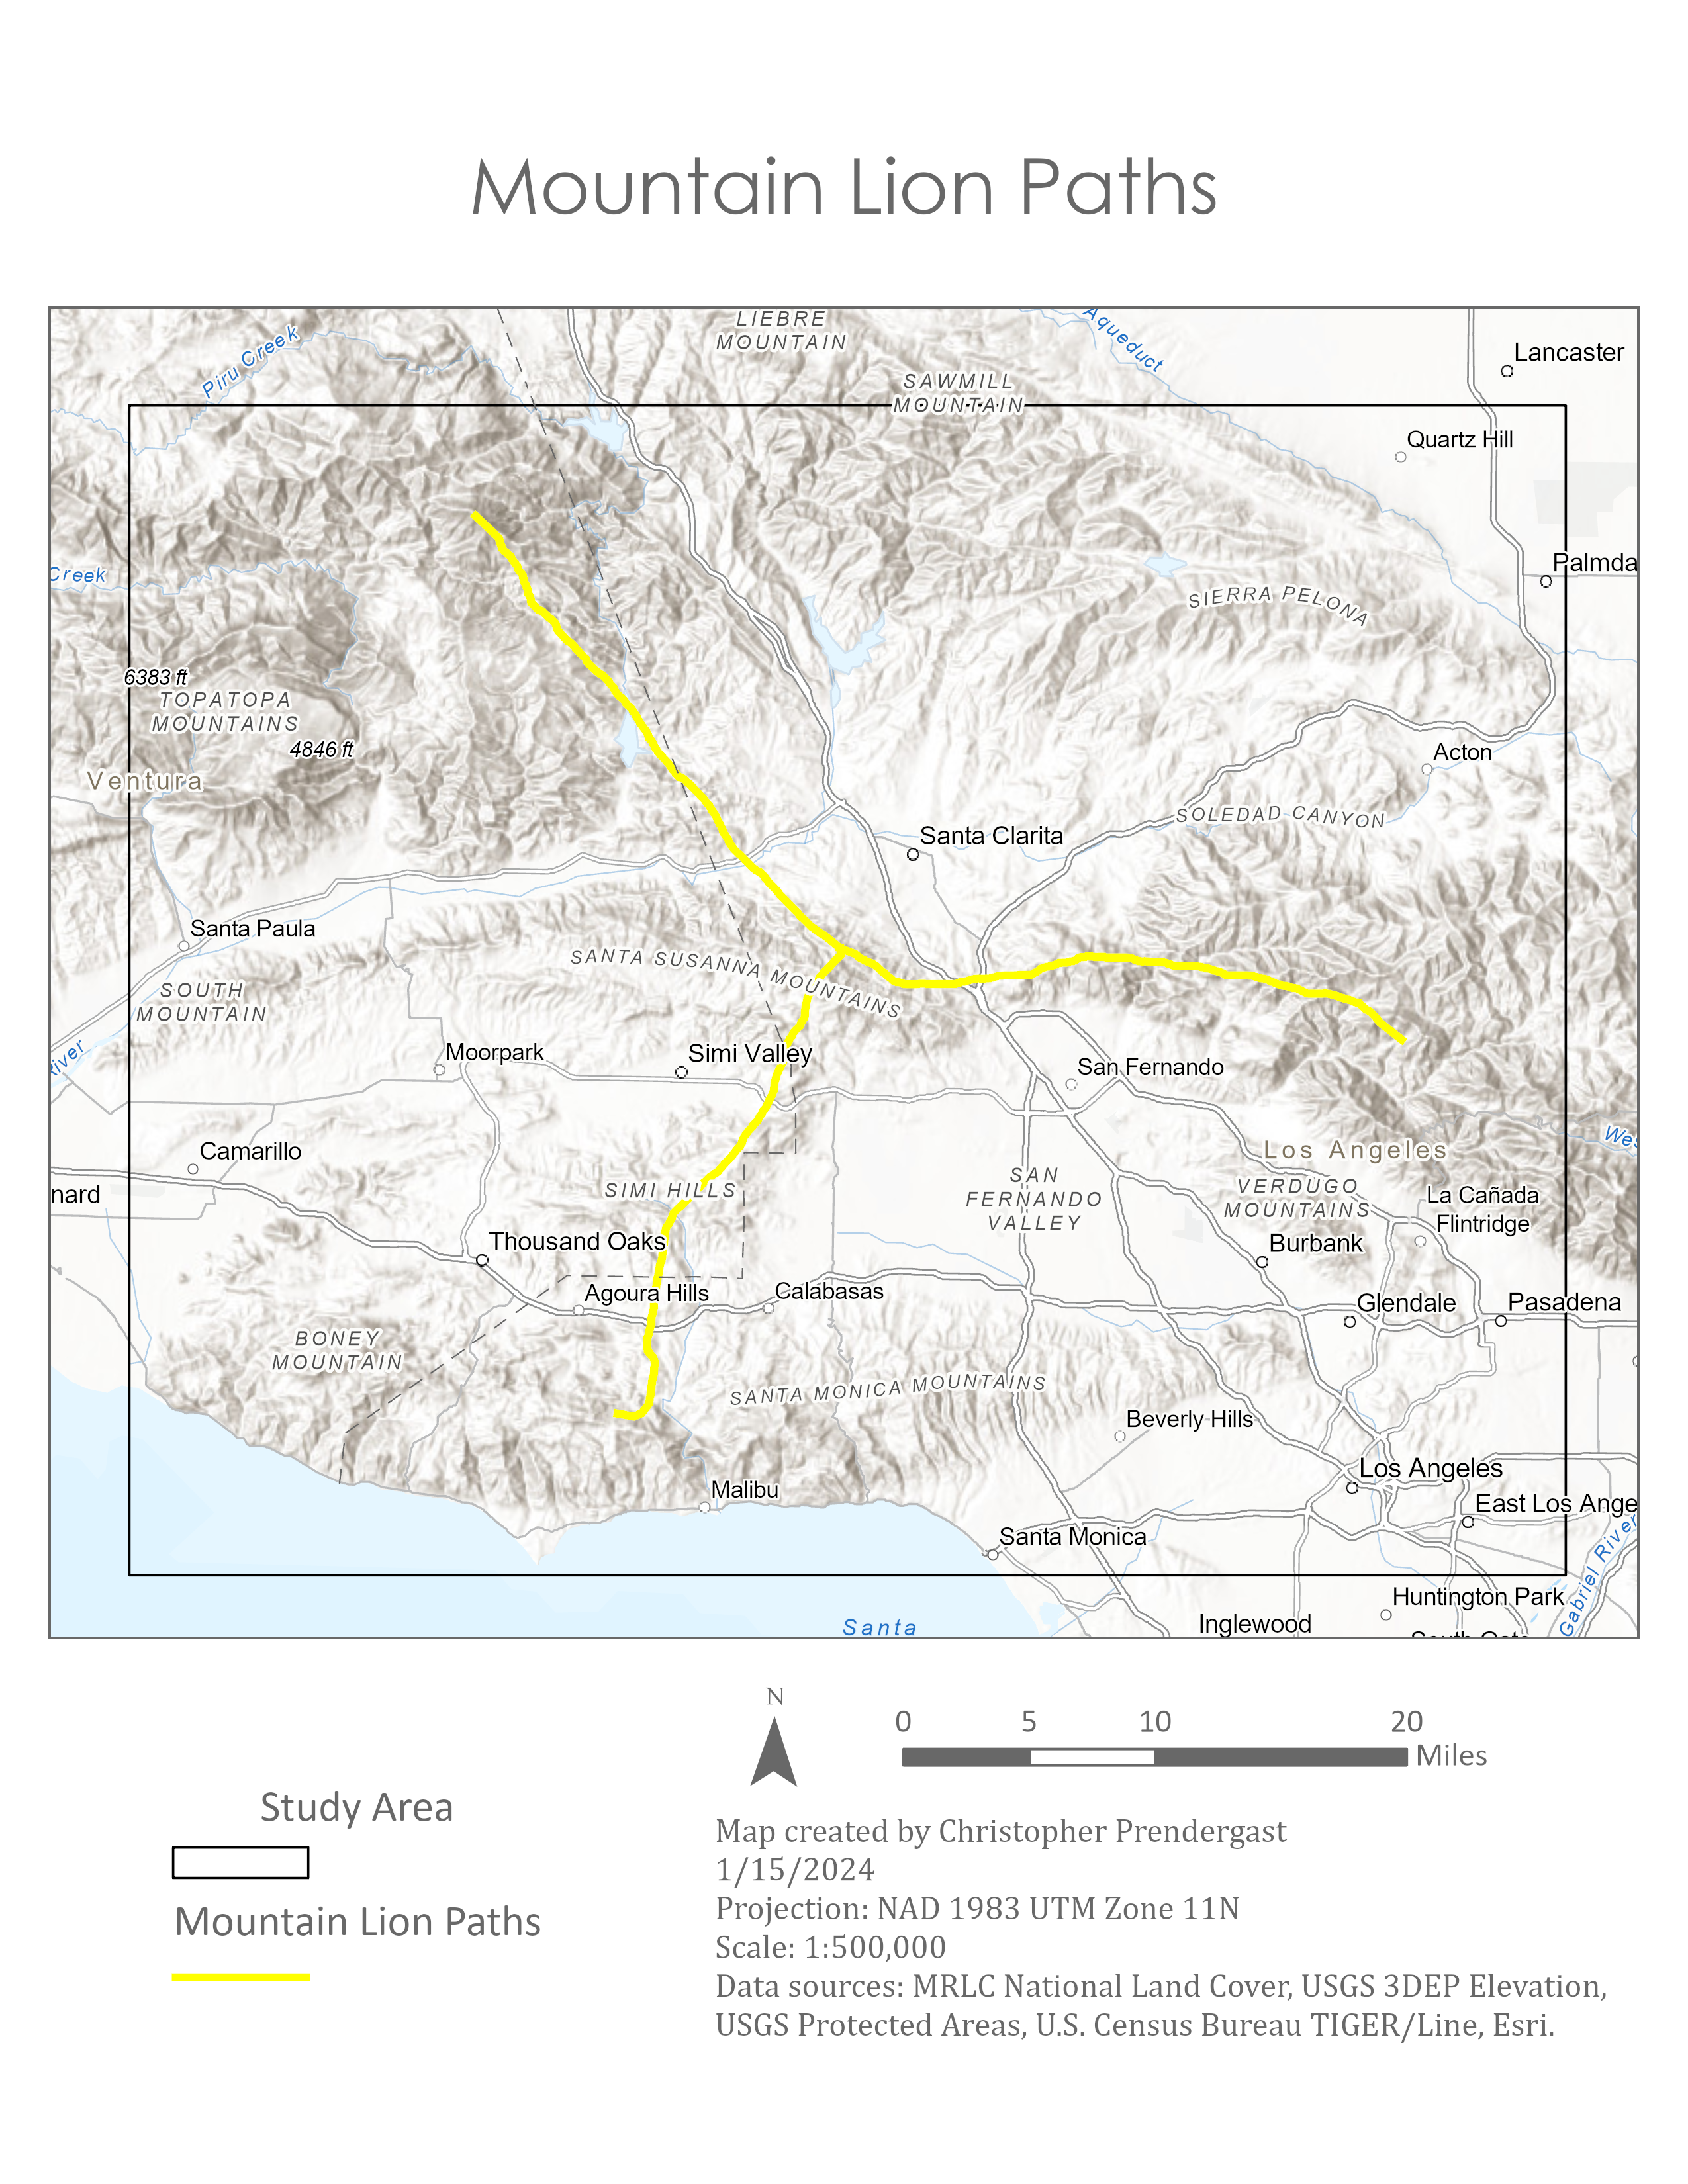
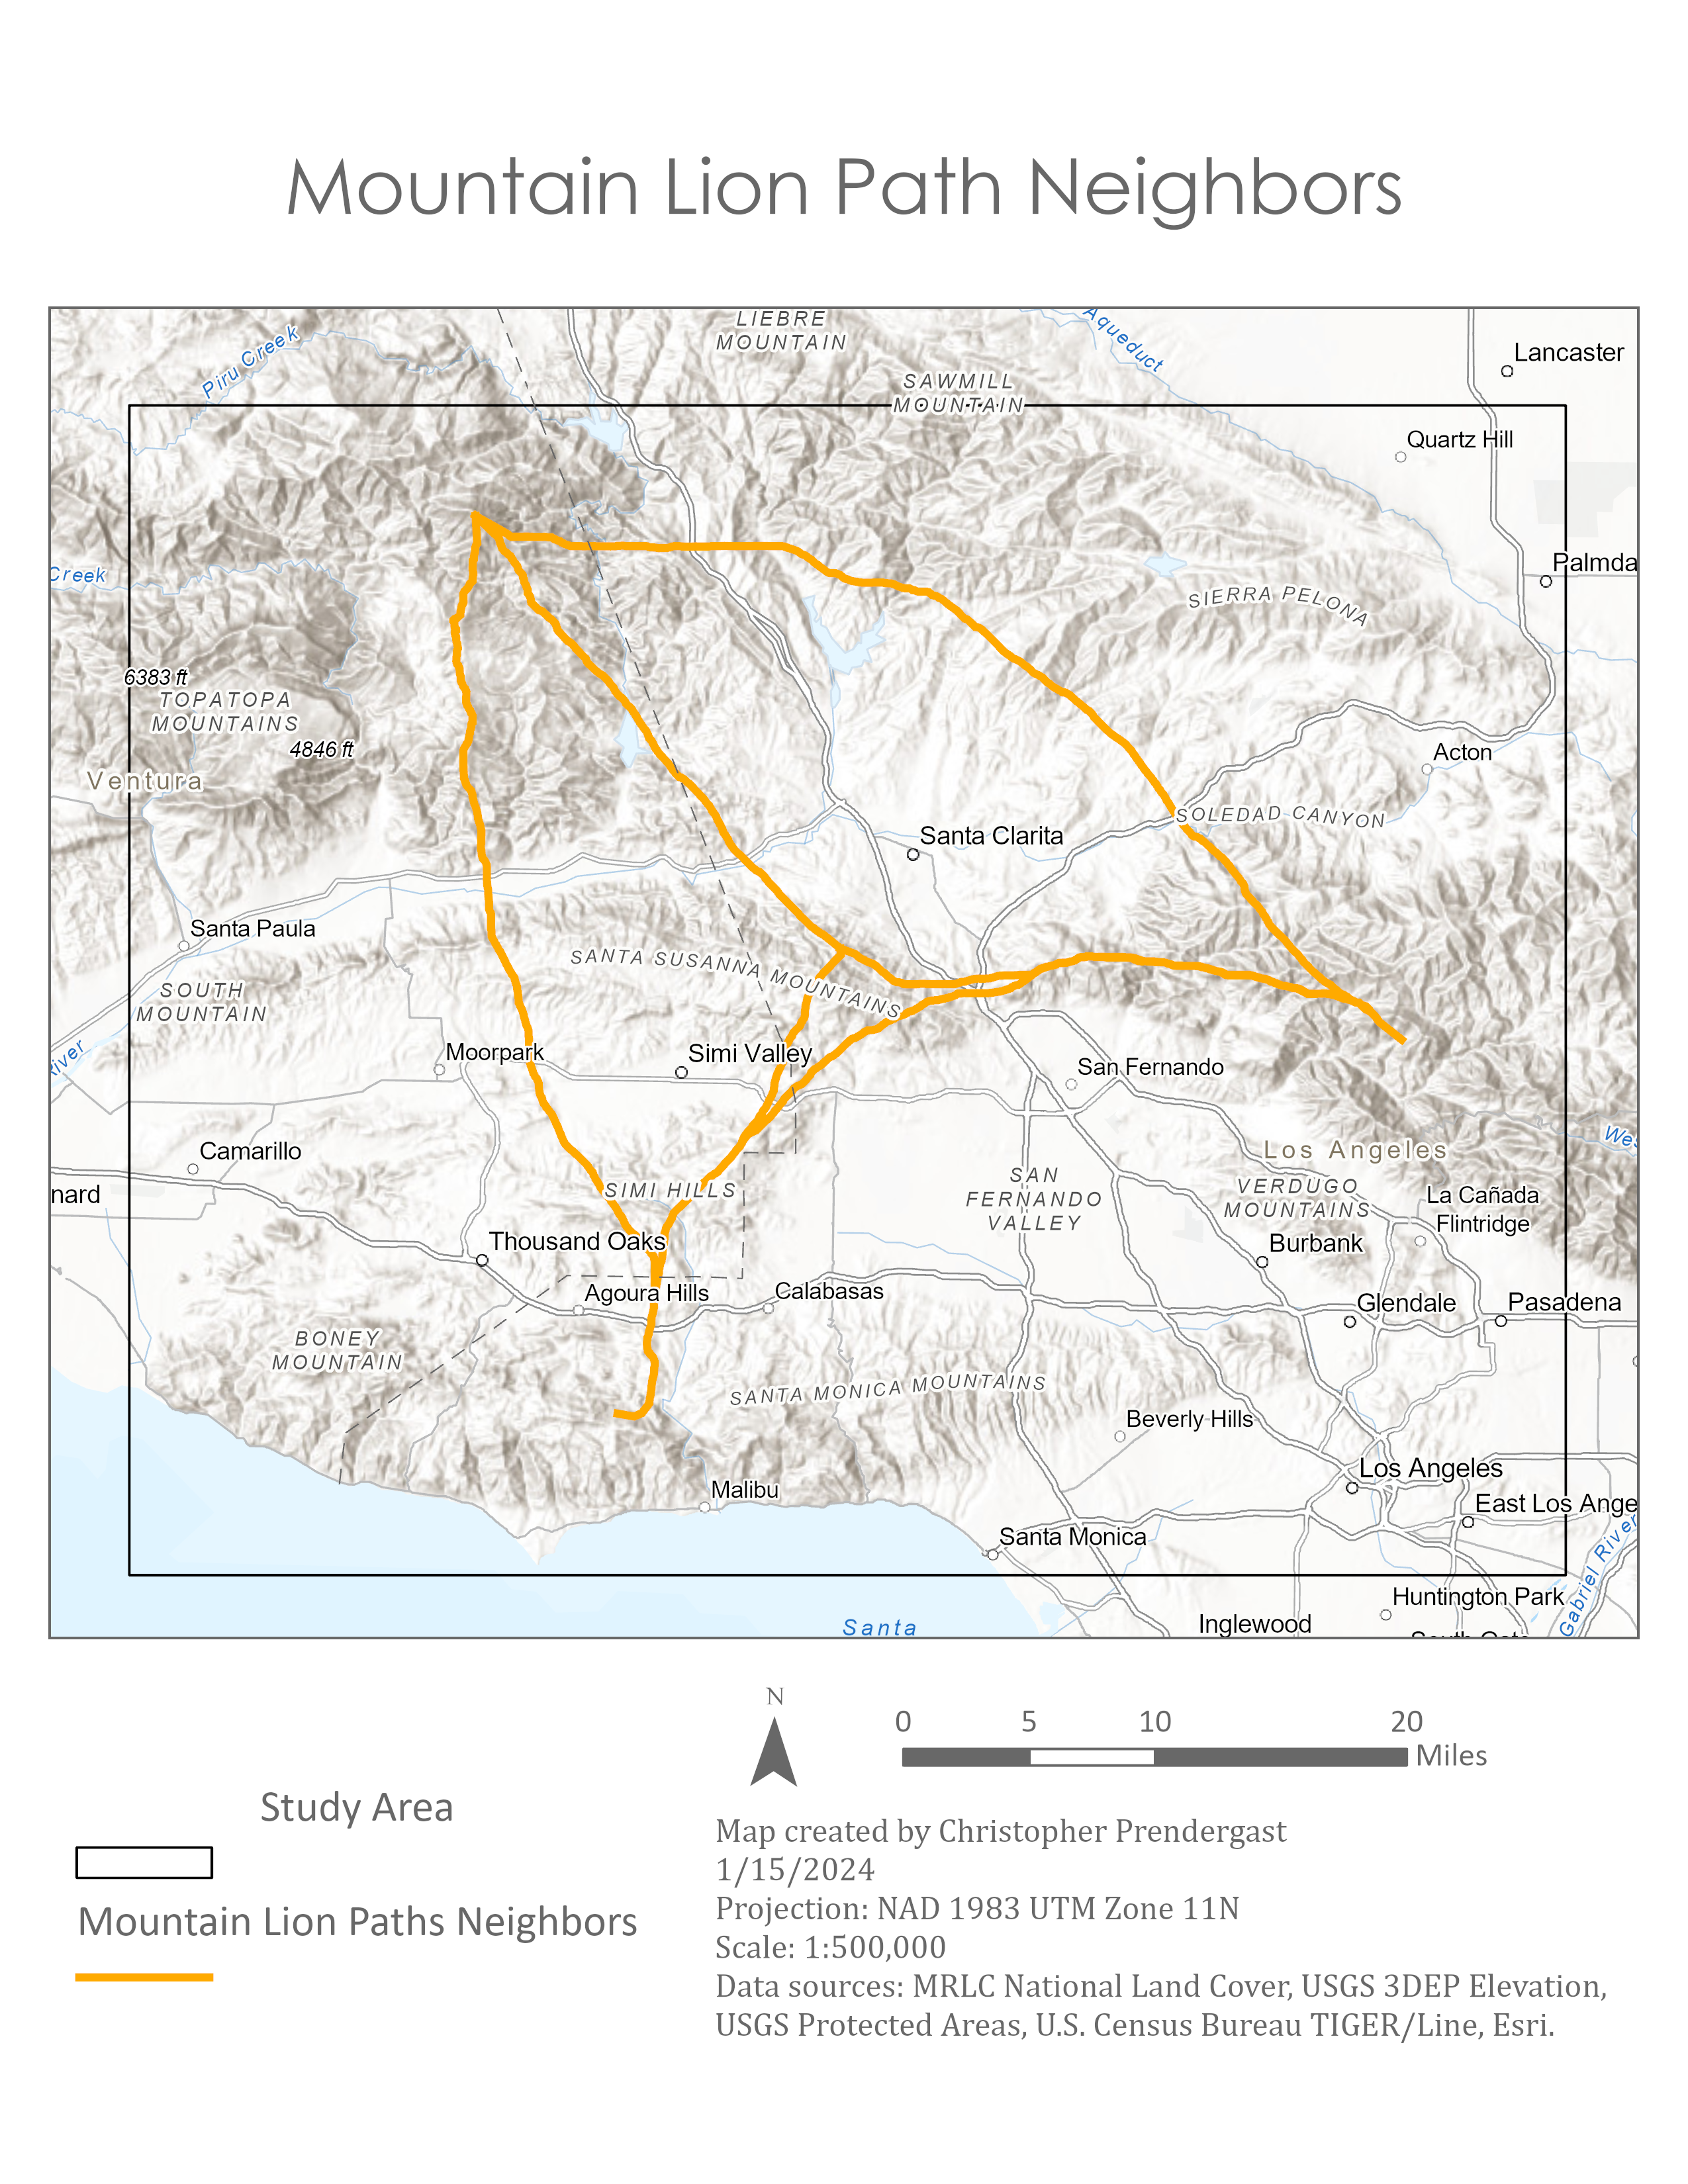
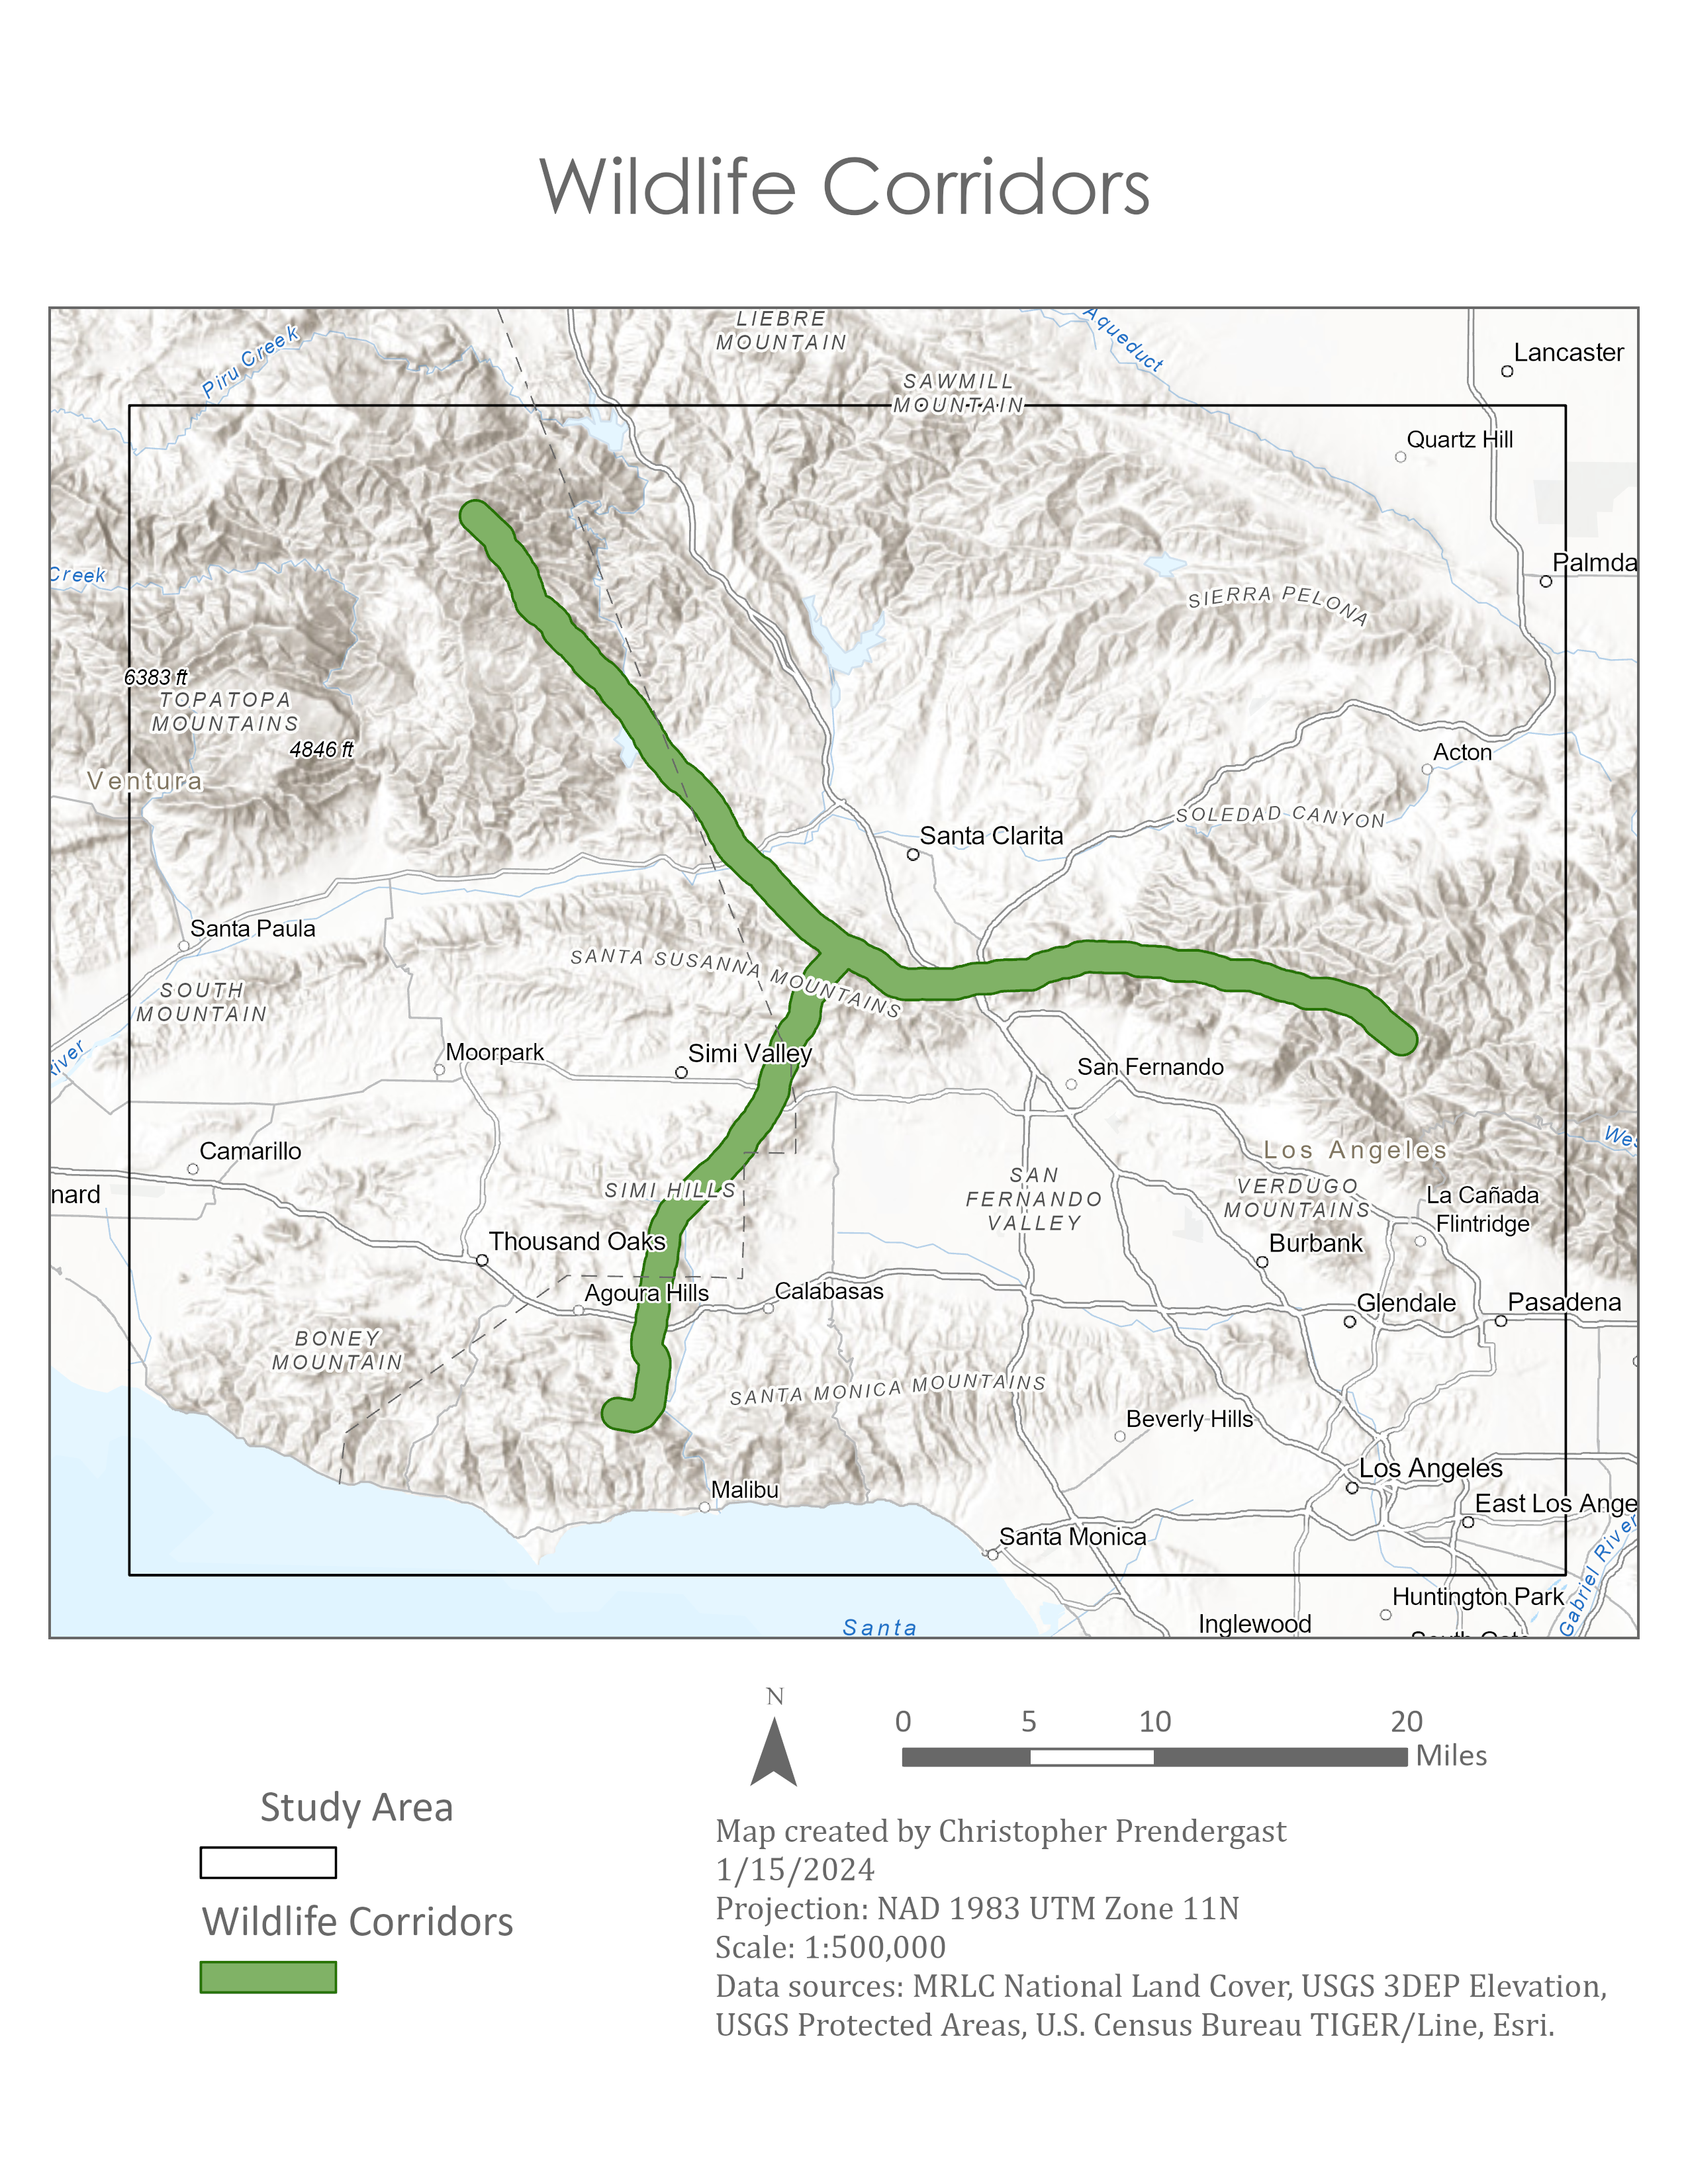
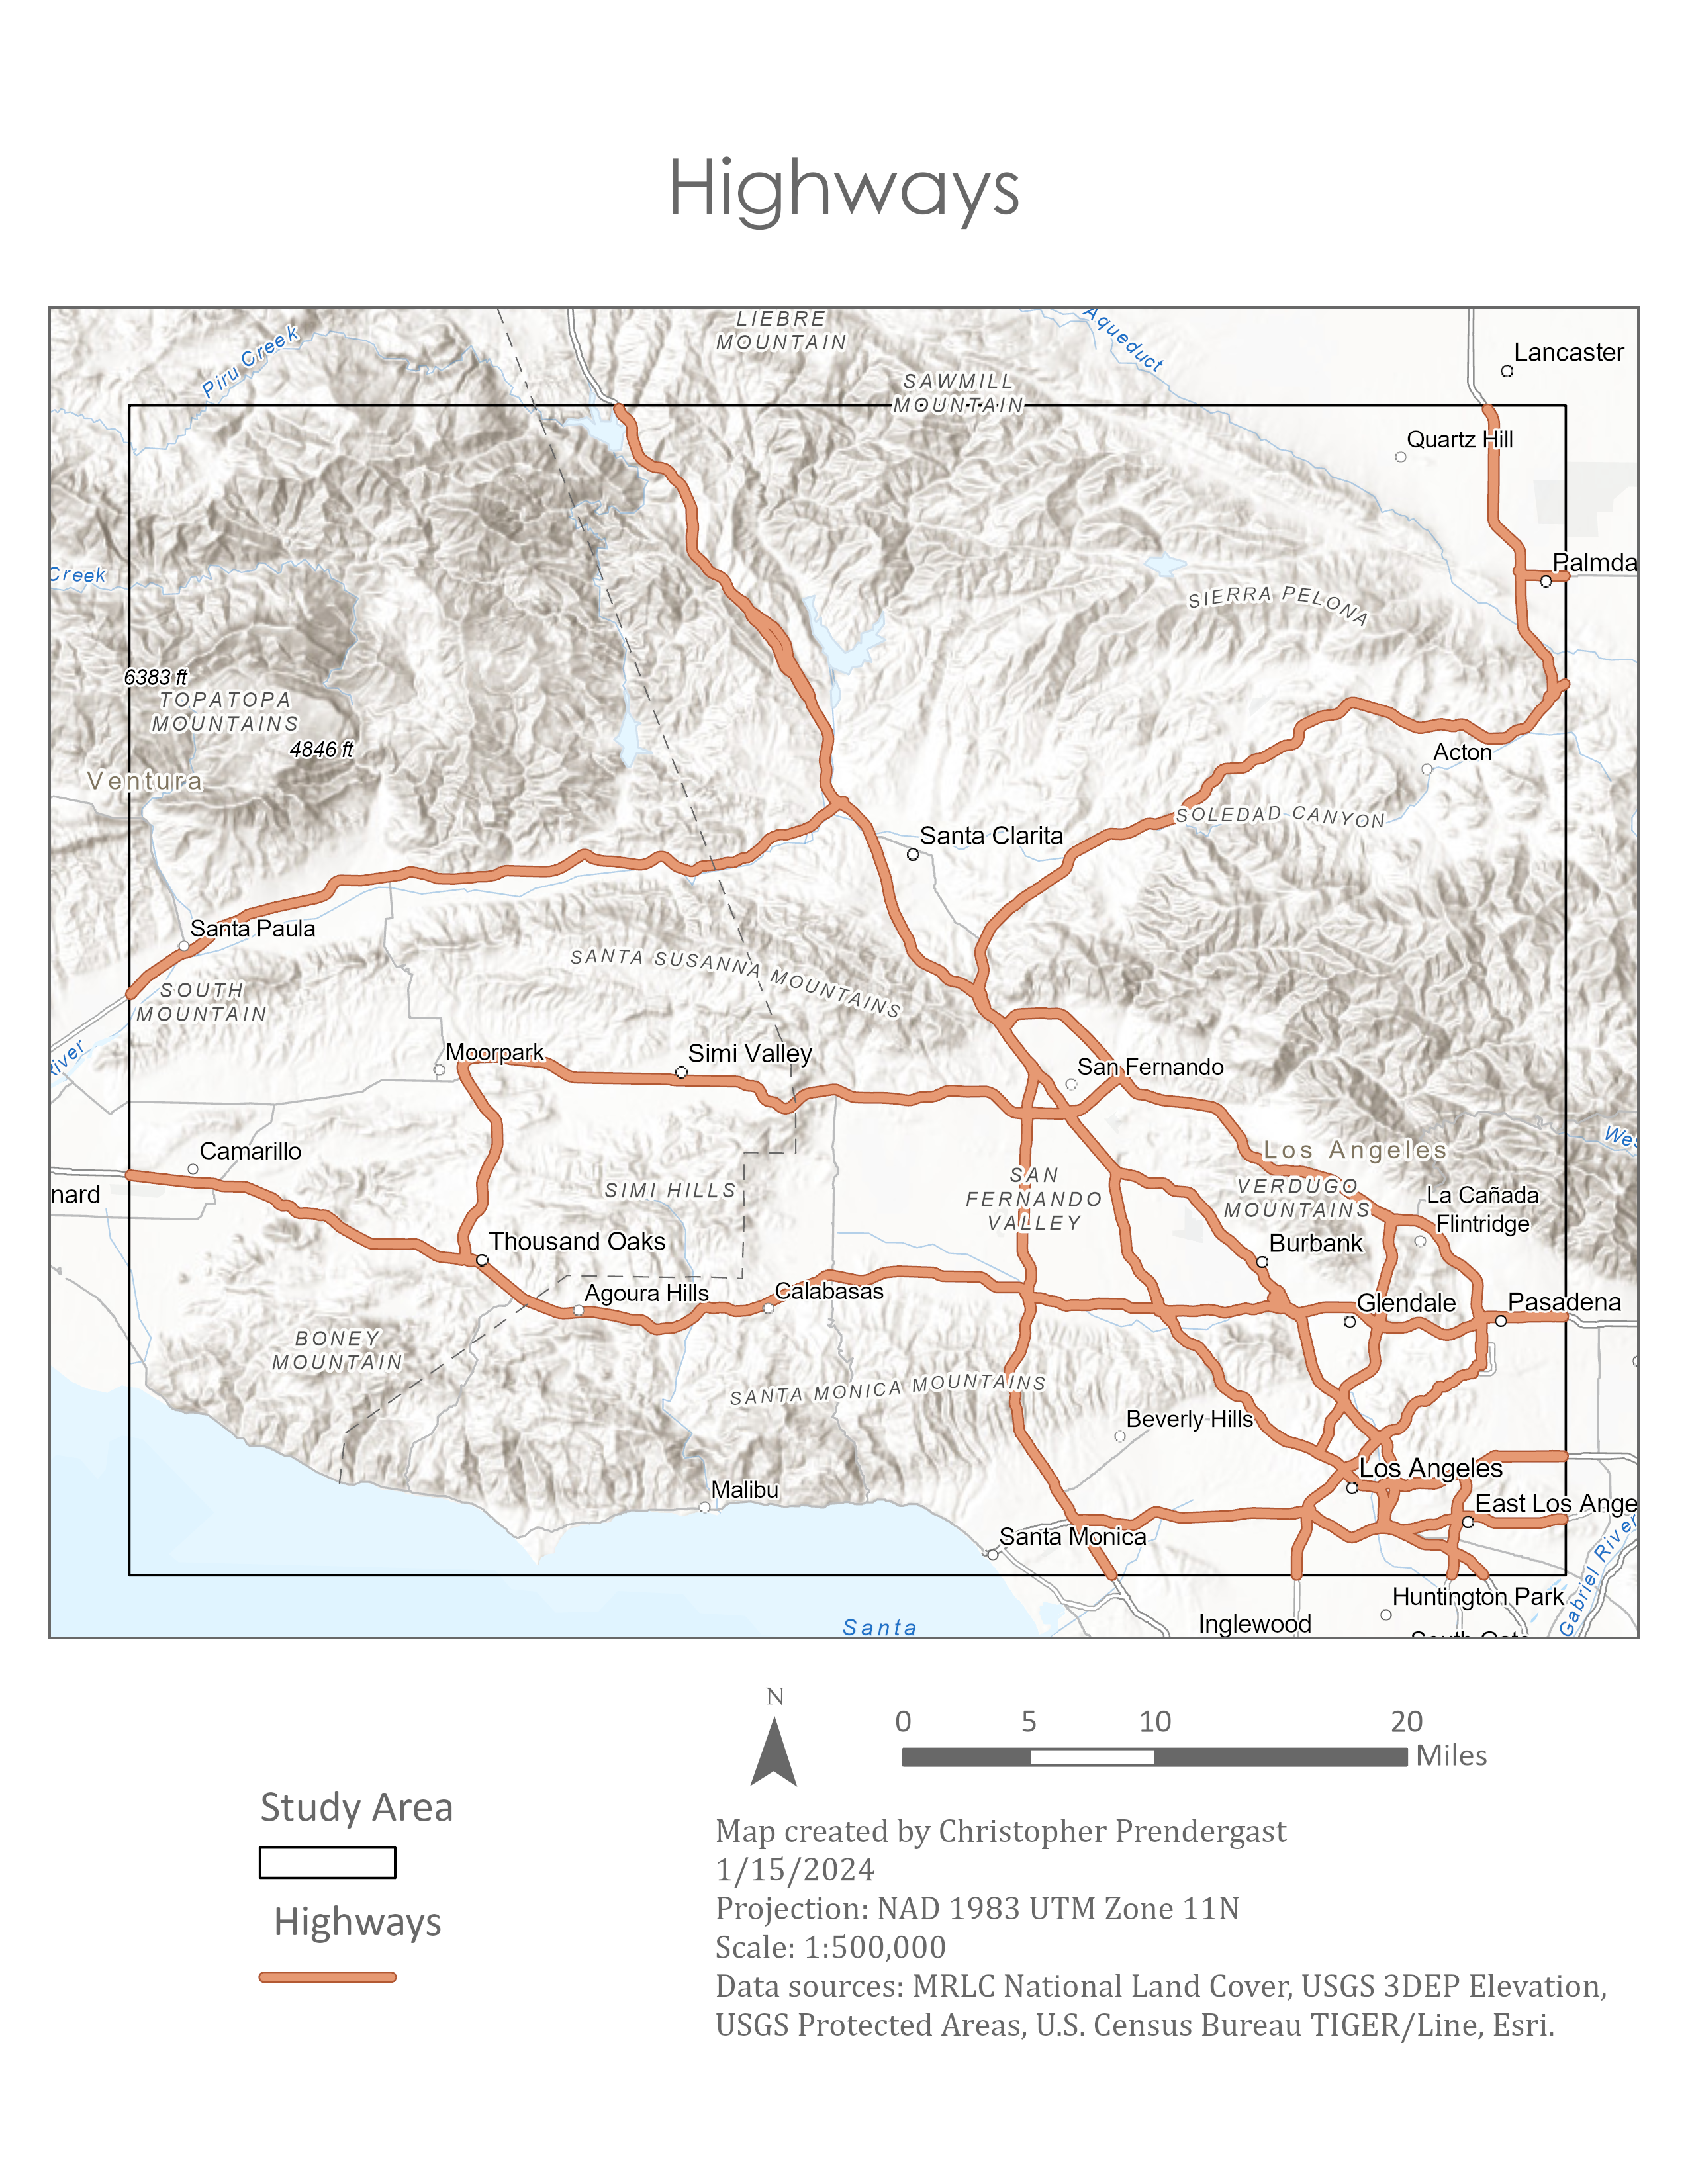
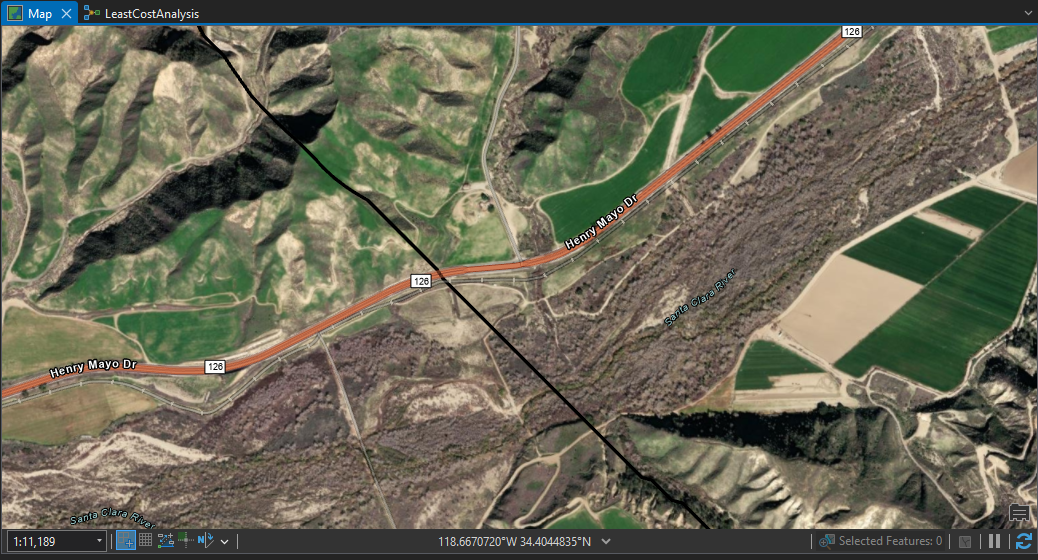
Mountain Lion Corridors, Los Angeles, CA
A least-cost path analysis was conducted using ArcGIS Pro ModelBuilder to identify the optimal routes for wildlife corridors connecting four core mountain lion habitat areas in the greater Los Angeles area. The goal was to maintain population health and genetic diversity by allowing safe passage through fragmented landscapes.

Go to article | Return to overview
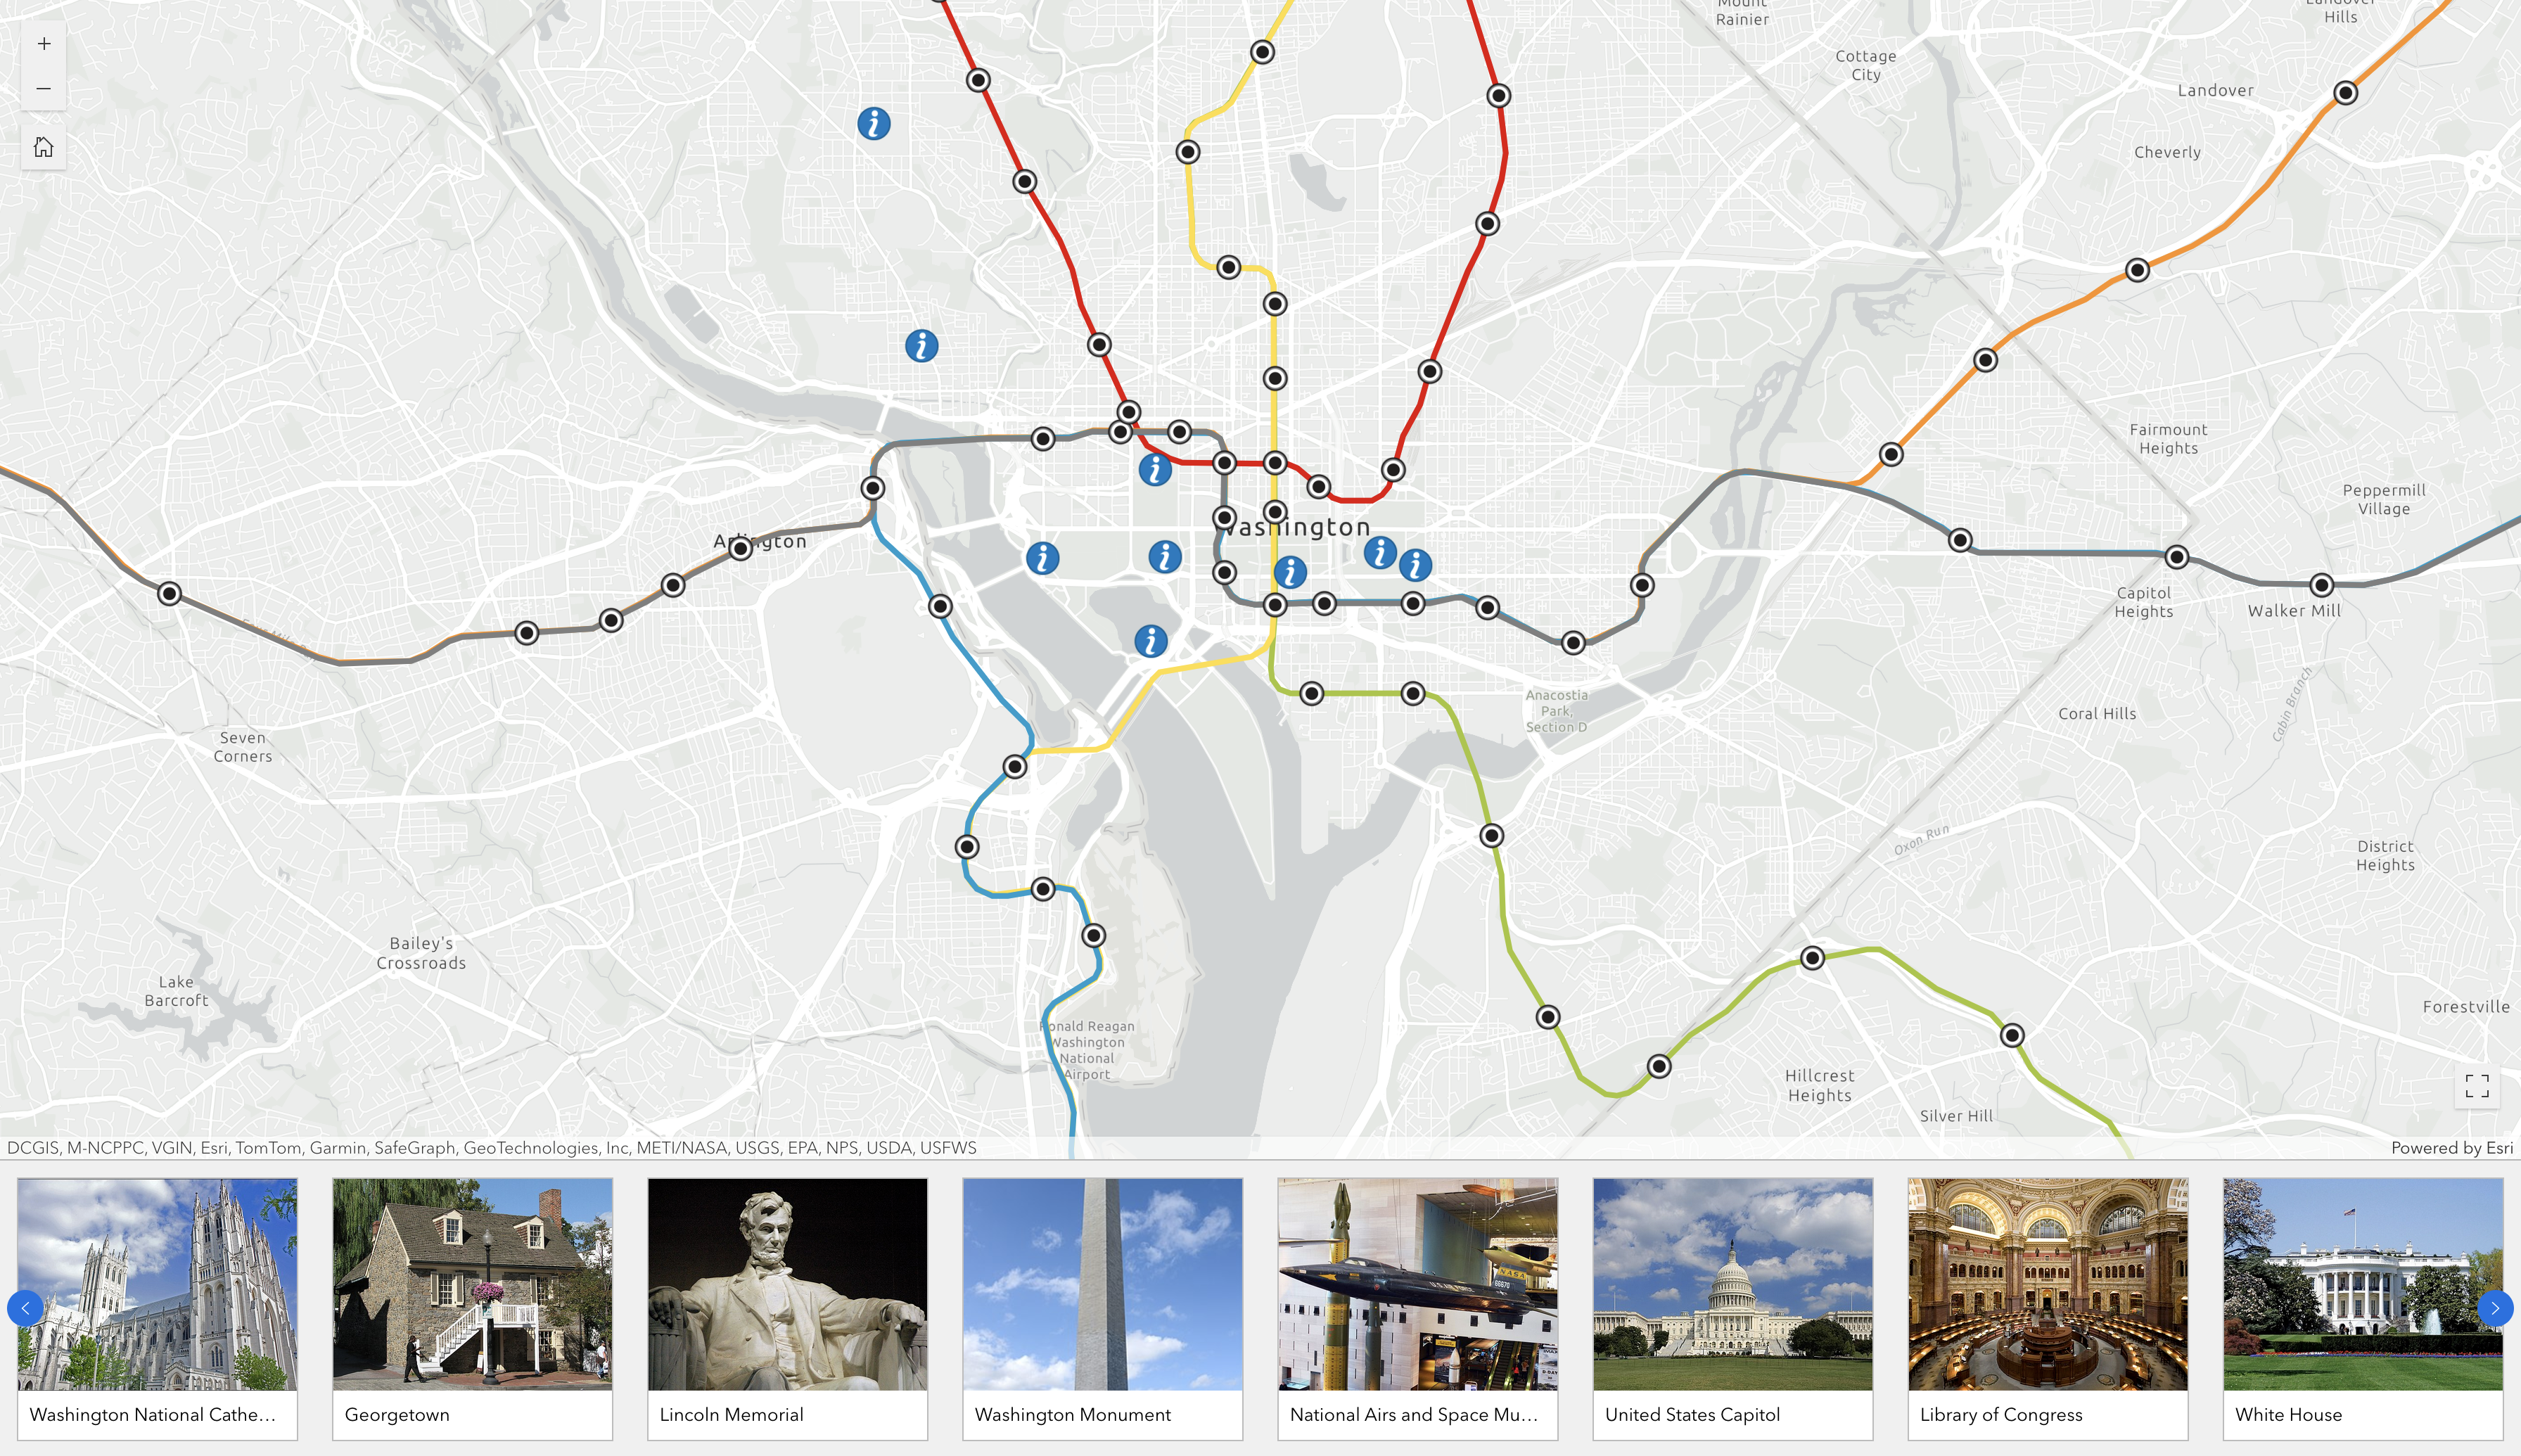
Places to See in Washington D.C. Web Experience
Created with ArcGIS Experience Builder, this page displays places to see in Washington D.C.
Go to article | Return to overview
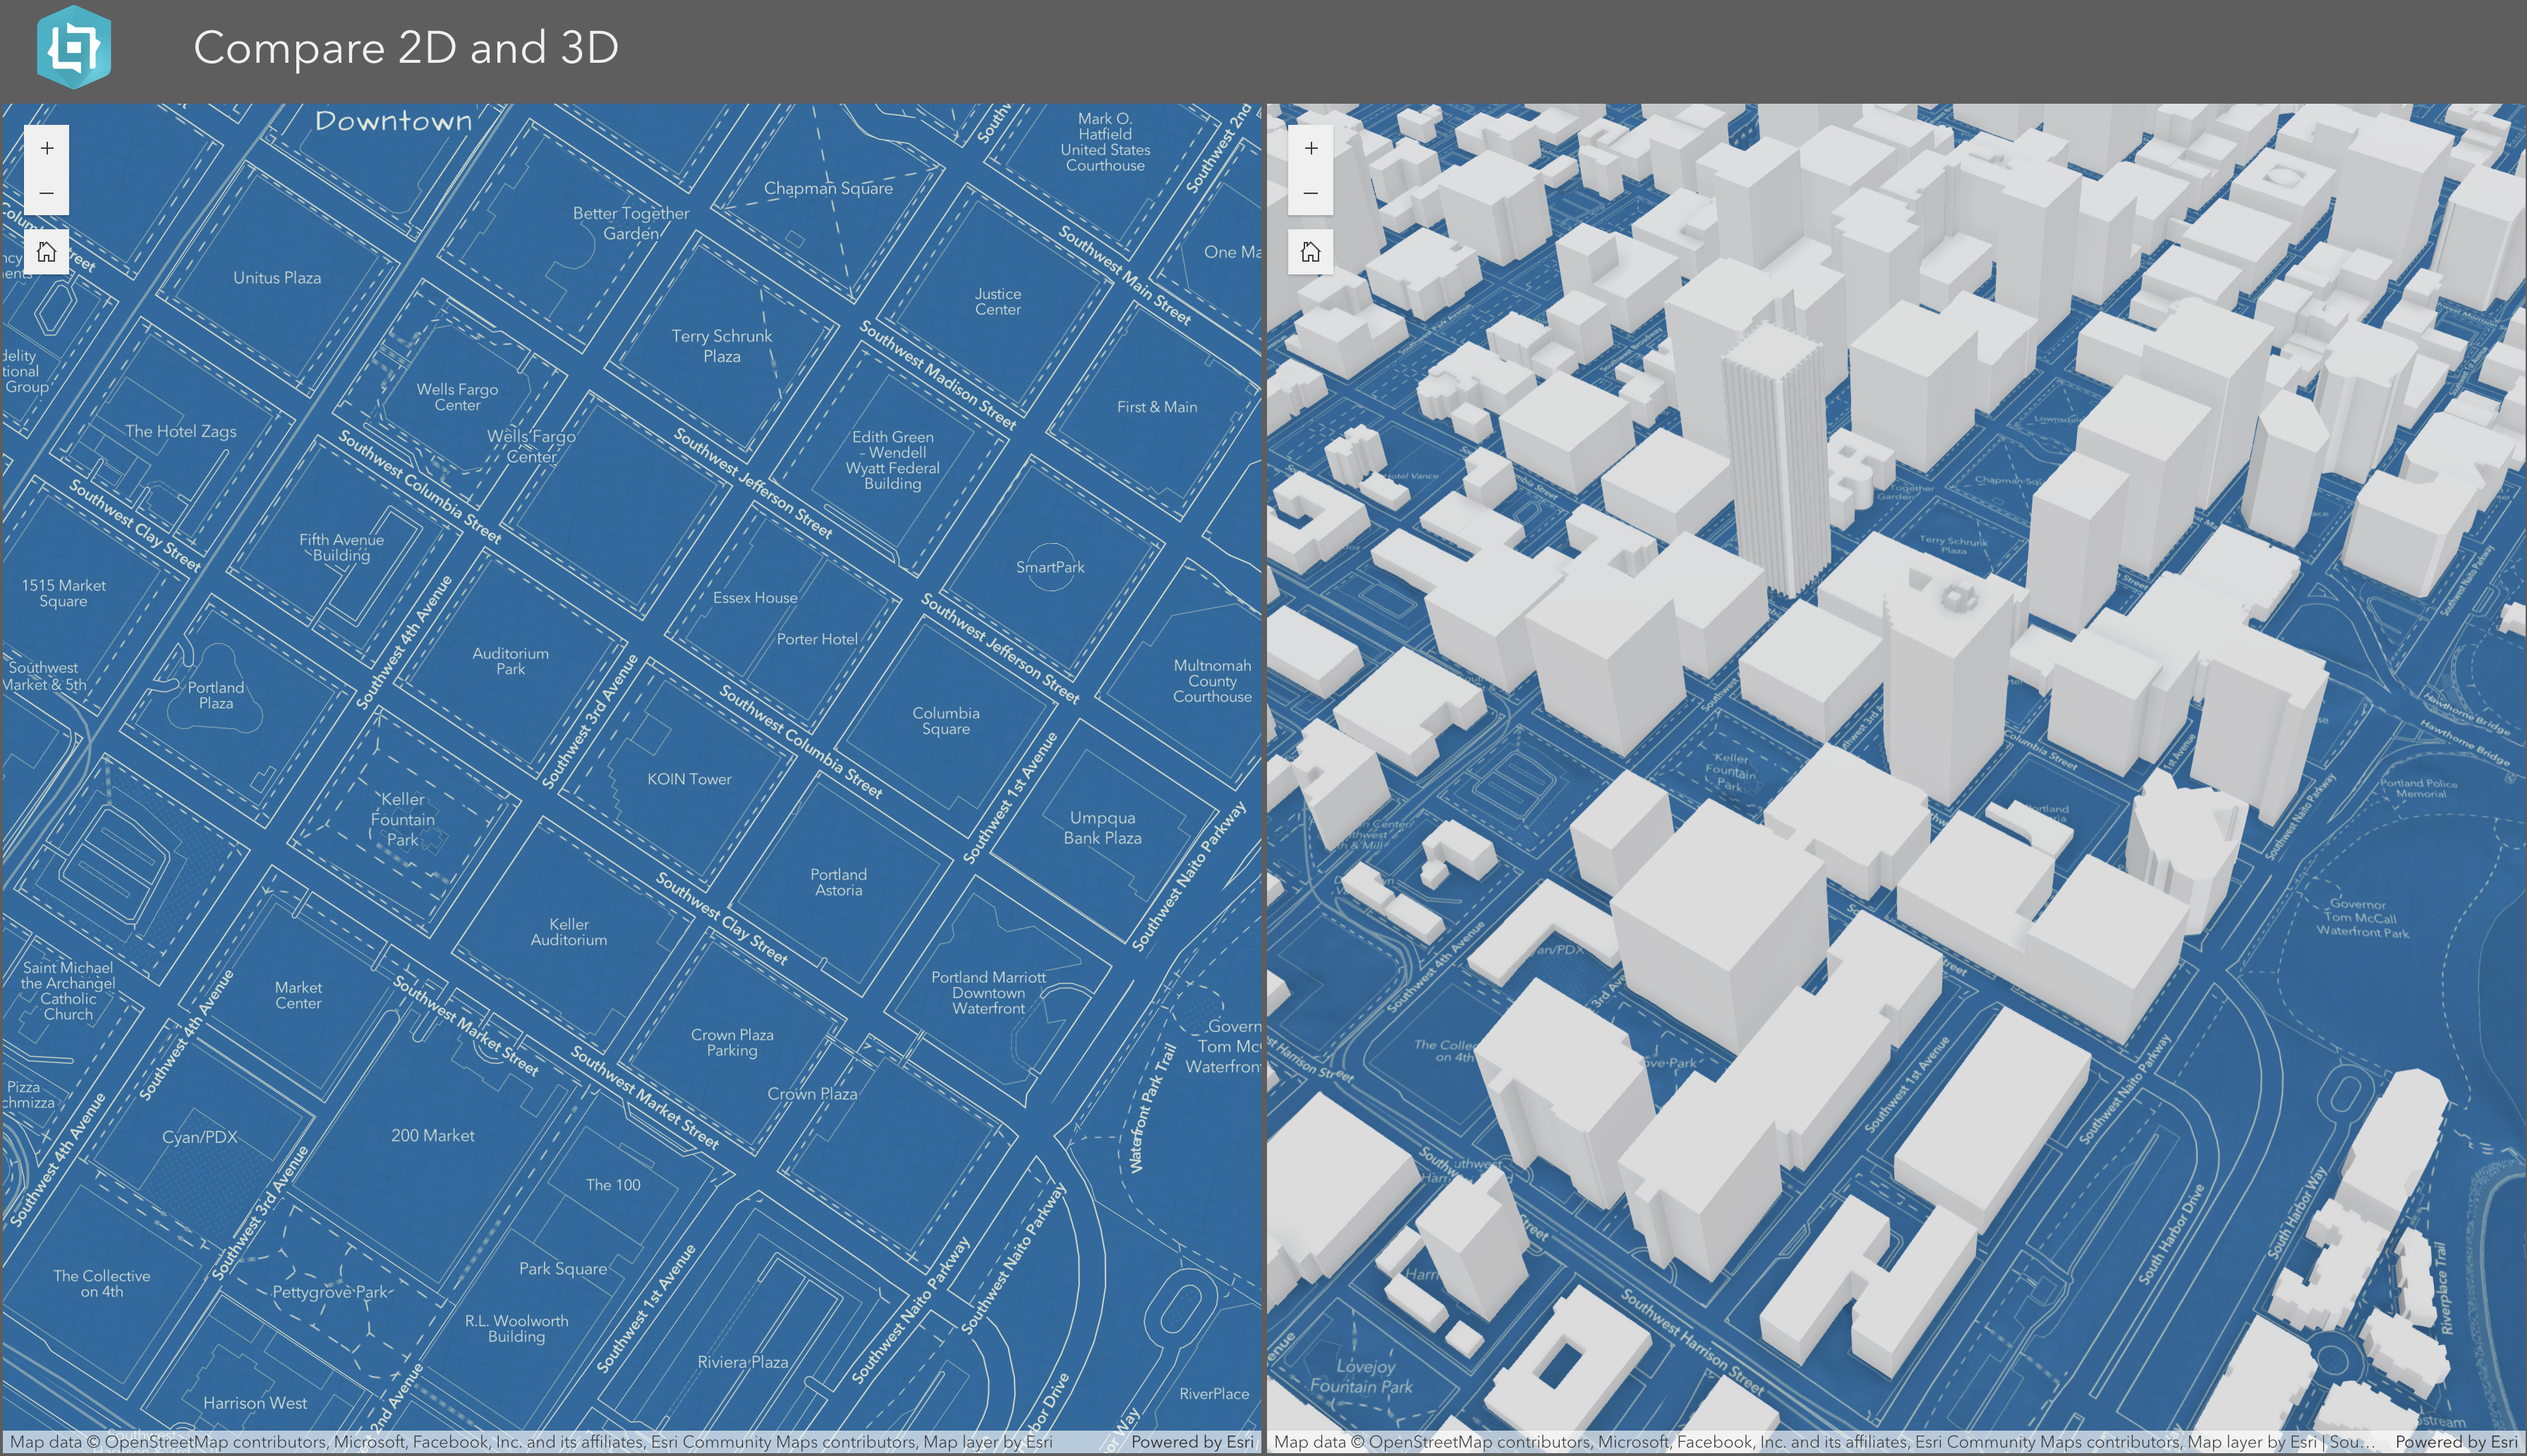
Portland 2D and 3D Experience
Created with ArcGIS Experience Builder, this page combines 2D and 3D views of Portland.
Go to article | Return to overview
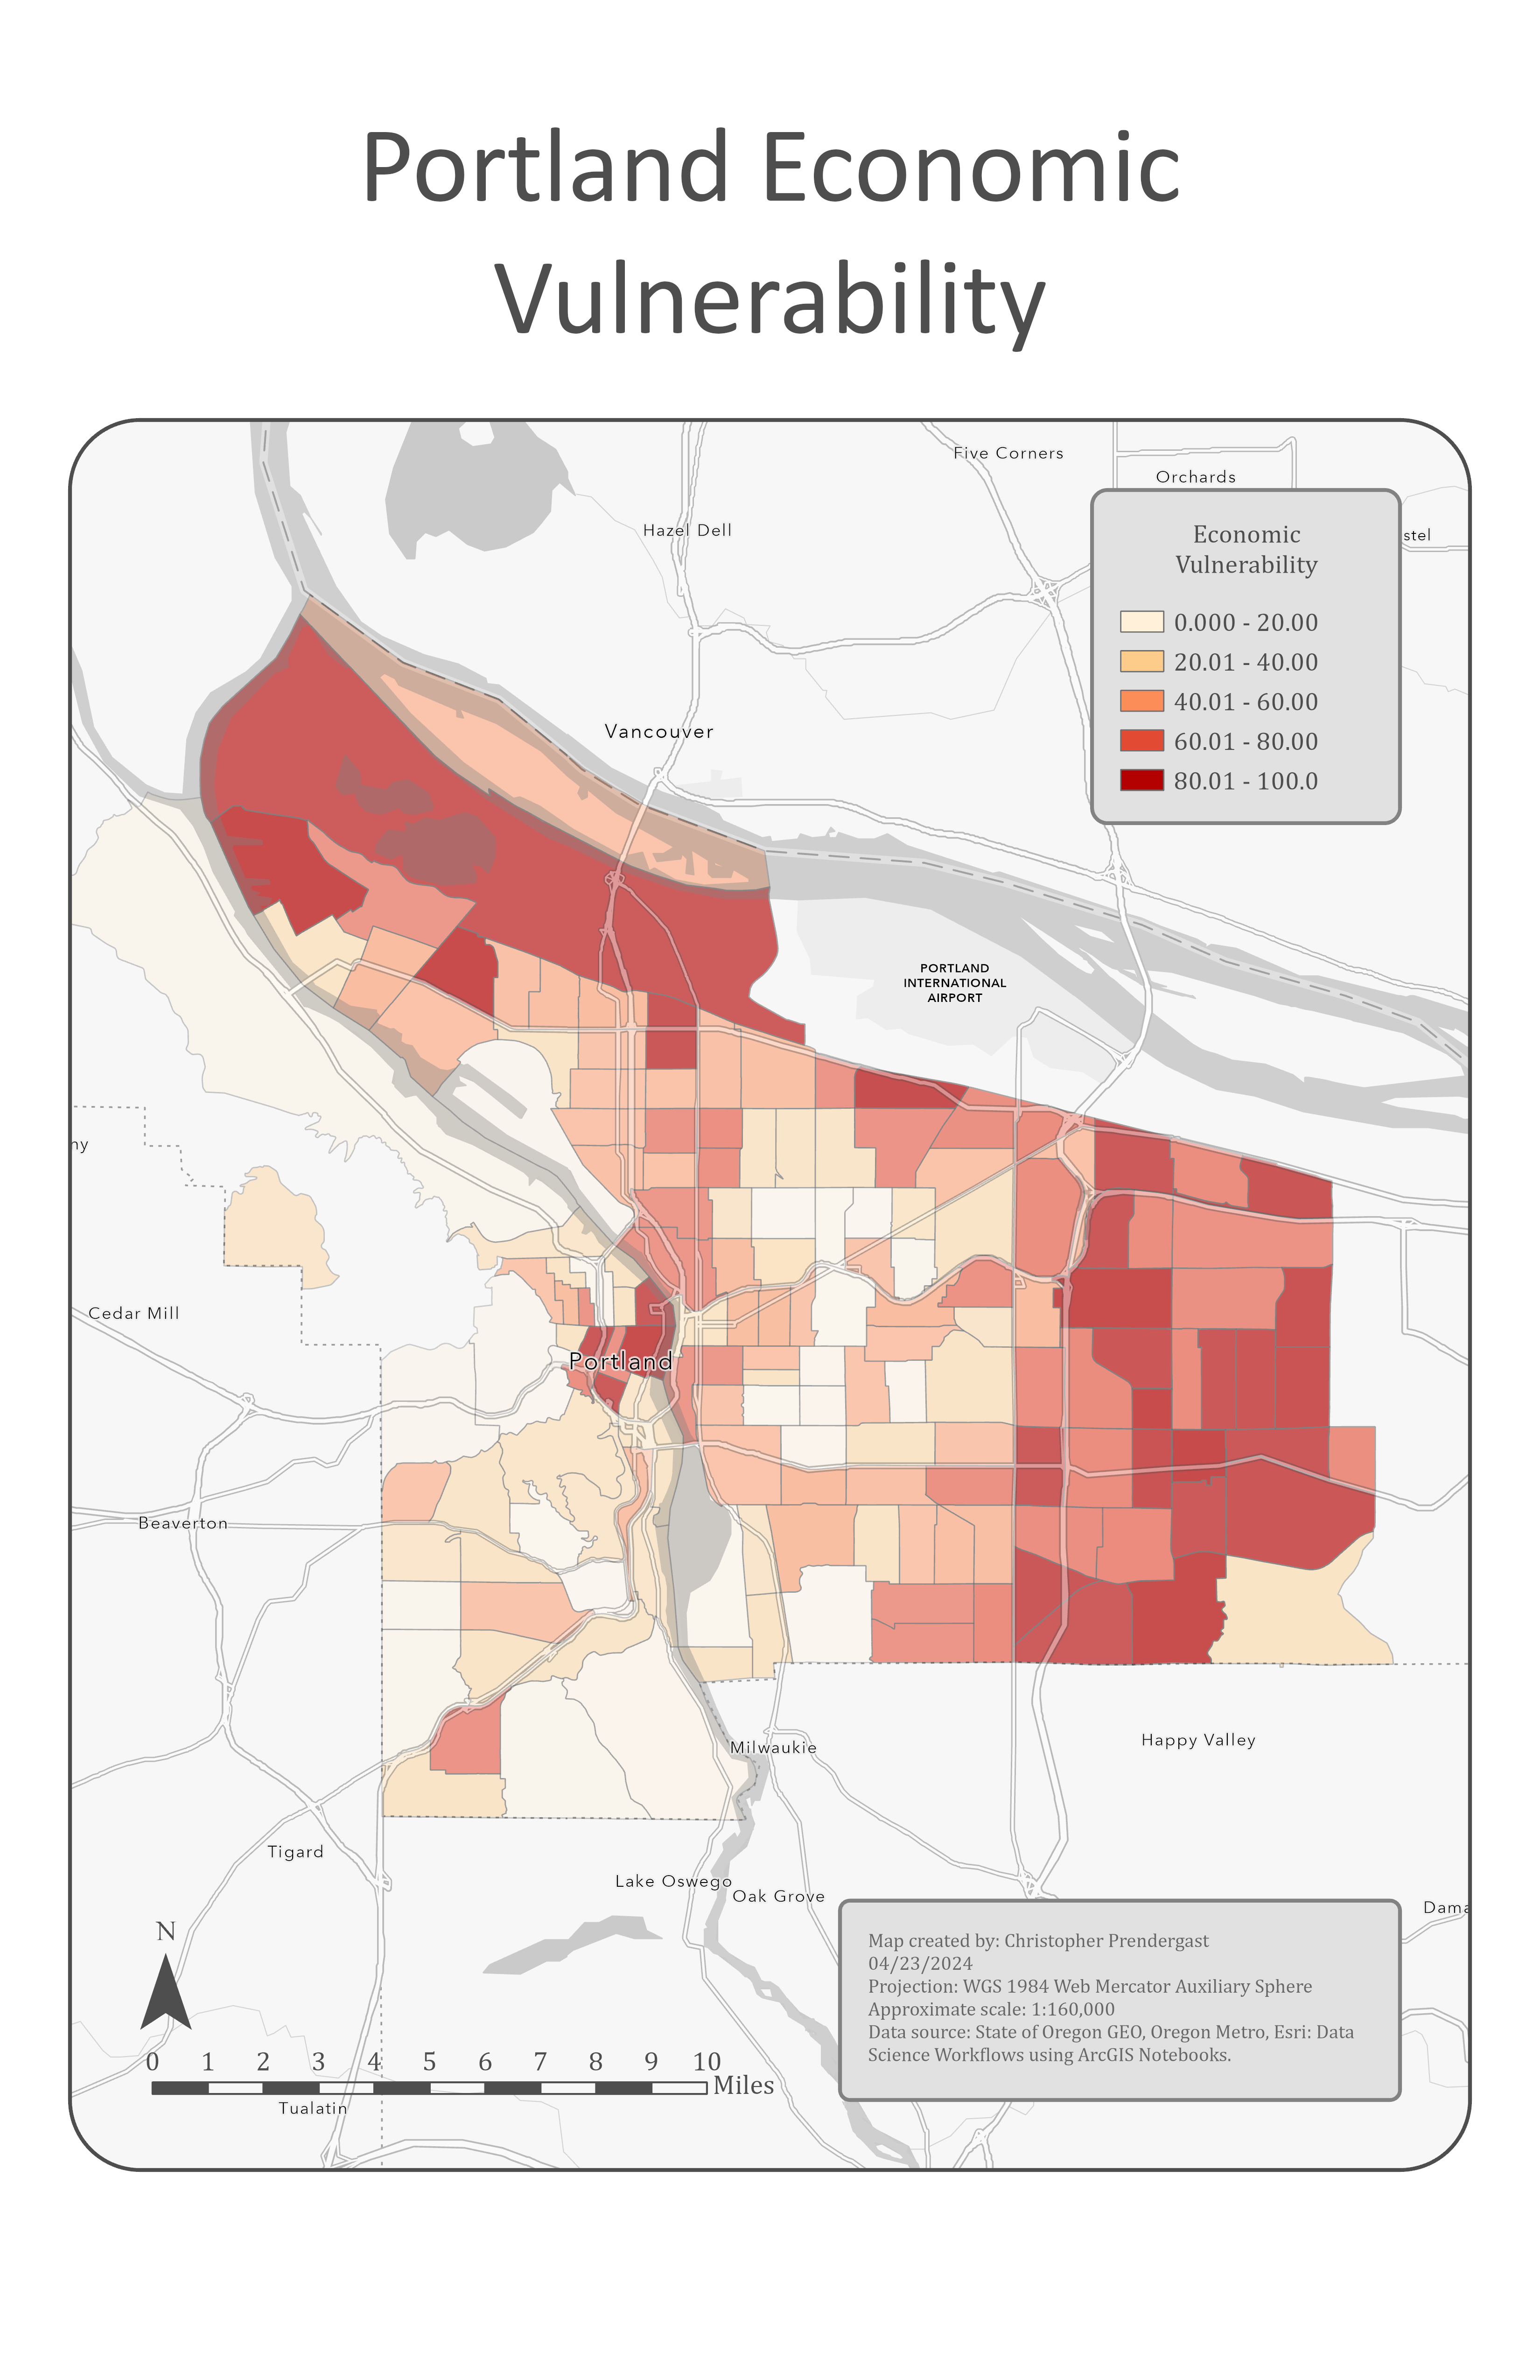
Portland Economic Vulnerability
The Economic Vulnerability Map highlights areas in Portland, Oregon, where residents face greater economic risk and potential displacement. Using graduated color symbology, the map shows that the northwestern and eastern portions of the city have the highest vulnerability. It helps planners identify priority neighborhoods for housing stability, social services, and economic development efforts.
Go to article | Return to overview
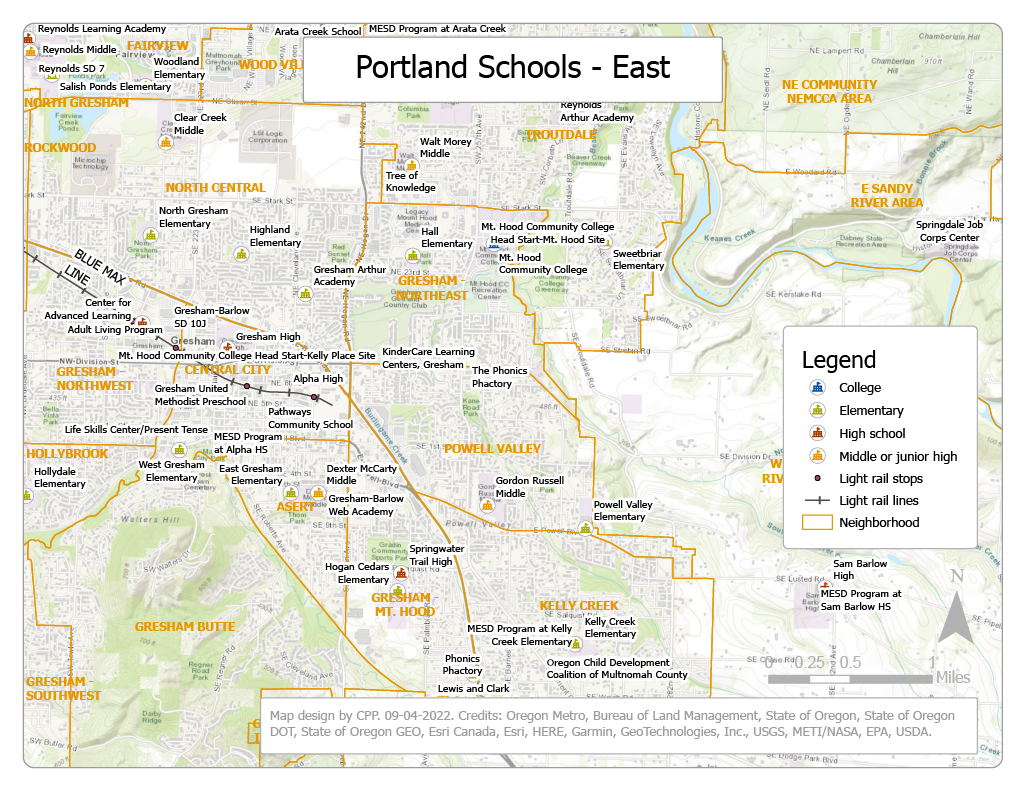
Portland Schools
Map of Portland Schools showing neighborhoods and light-rail lines.
Go to article | Return to overview
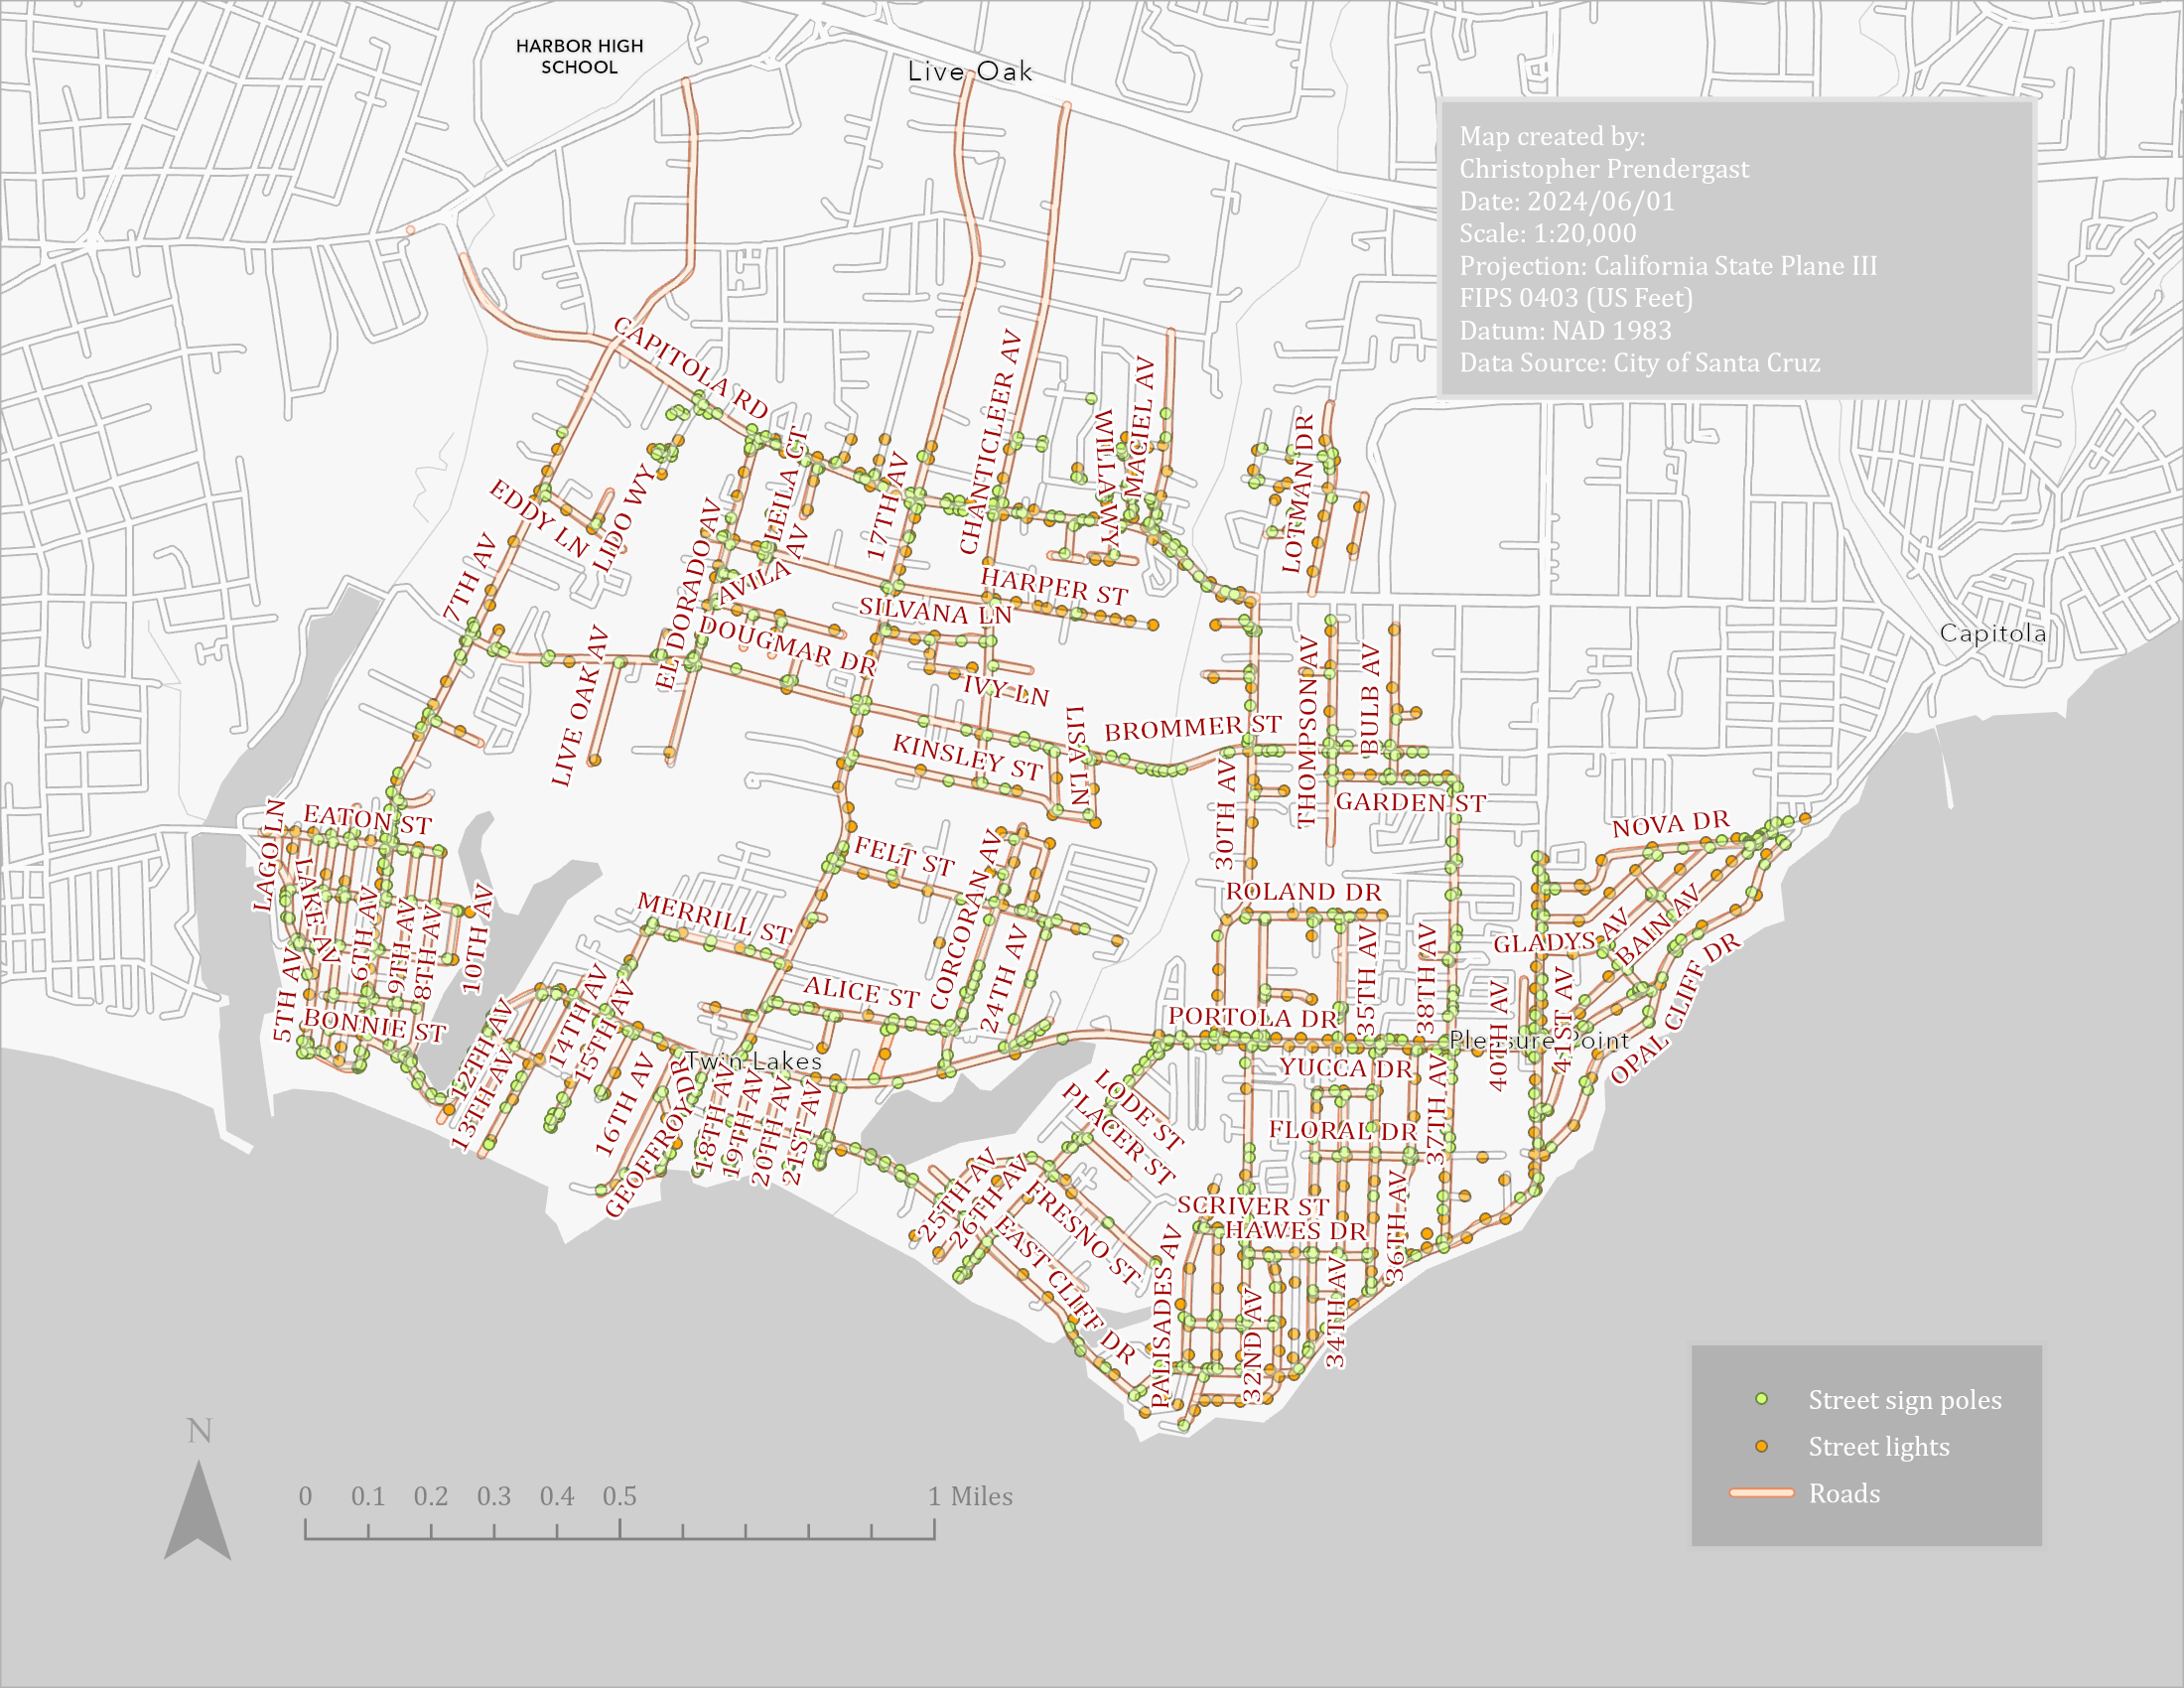
Public Works Department Assets, City of Santa Cruz
The City of Santa Cruz Public Works Department requested to have road names transferred to the assets in the existing Street Signs, Street Sign Poles, and Street Lights layers in a file geodatabase. This is accomplished with a Python script.
Go to article | Return to overview
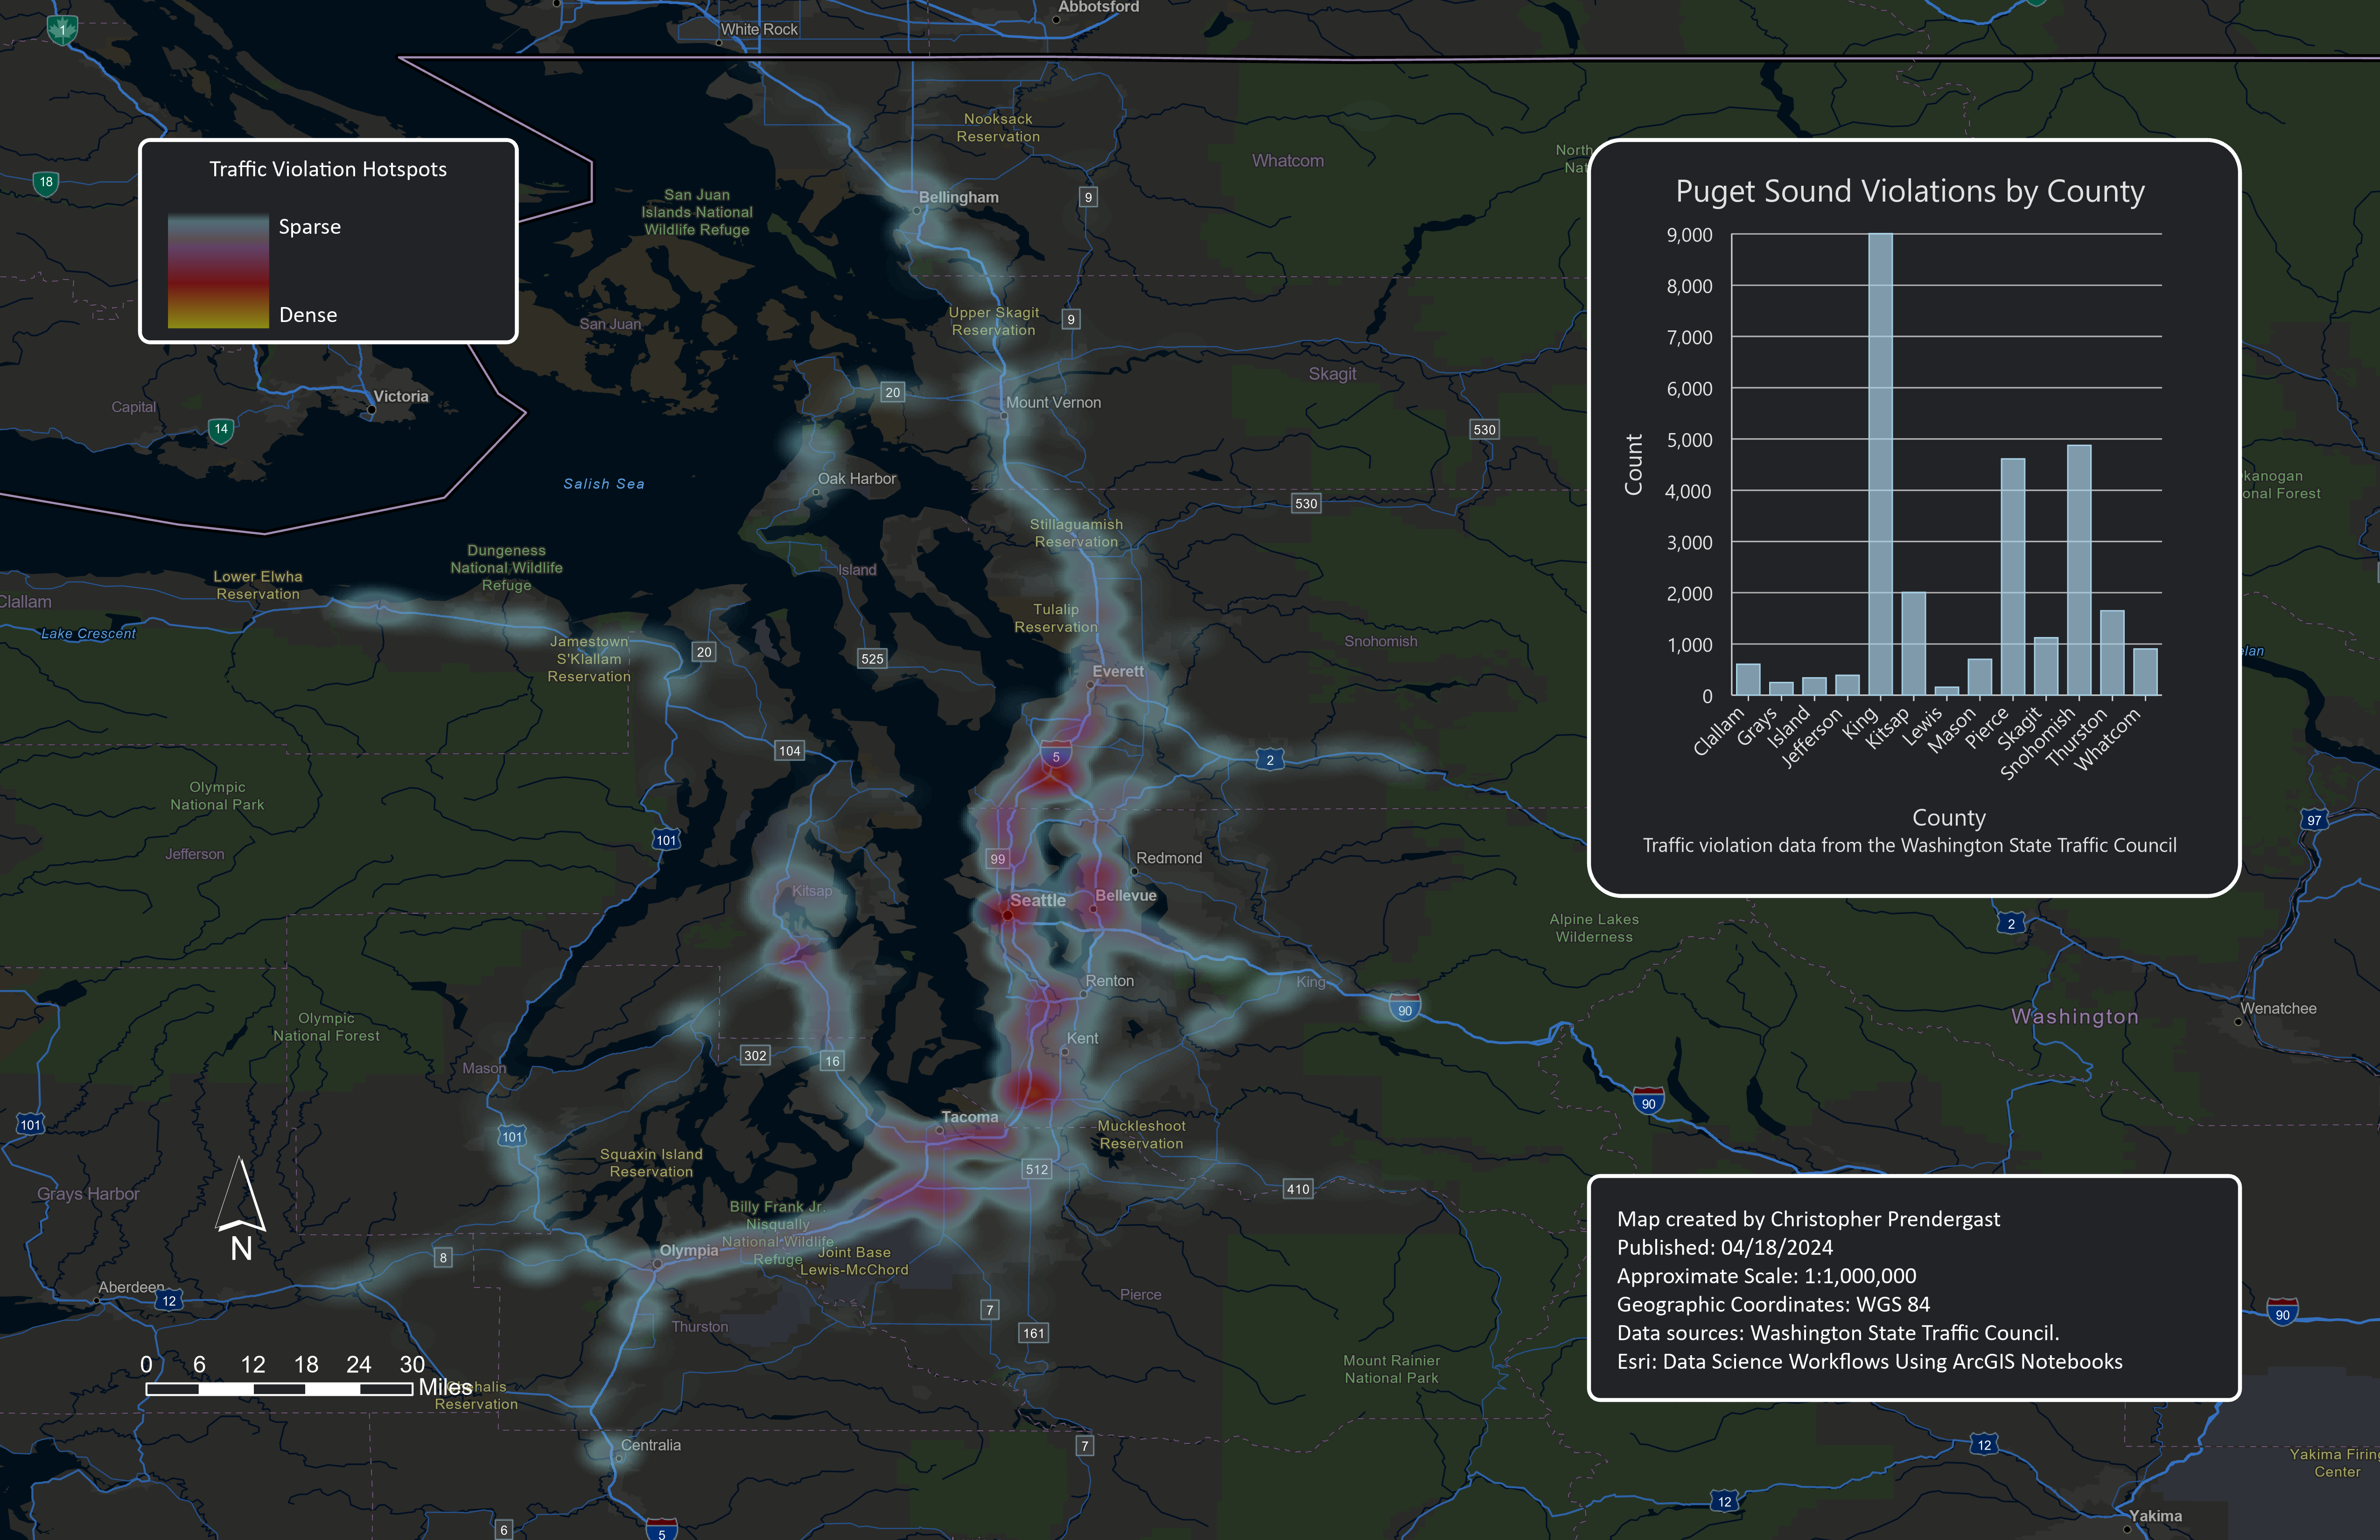
Puget Sound Traffic Violations
The Seattle Traffic Citations Map displays traffic violation locations across Seattle and the Puget Sound region using heat map symbology. The analysis shows the highest density of citations along the I-5 corridor, especially between Everett and Olympia, with King County recording the most violations overall. The map highlights enforcement hotspots and helps guide road safety planning.
Go to article | Return to overview
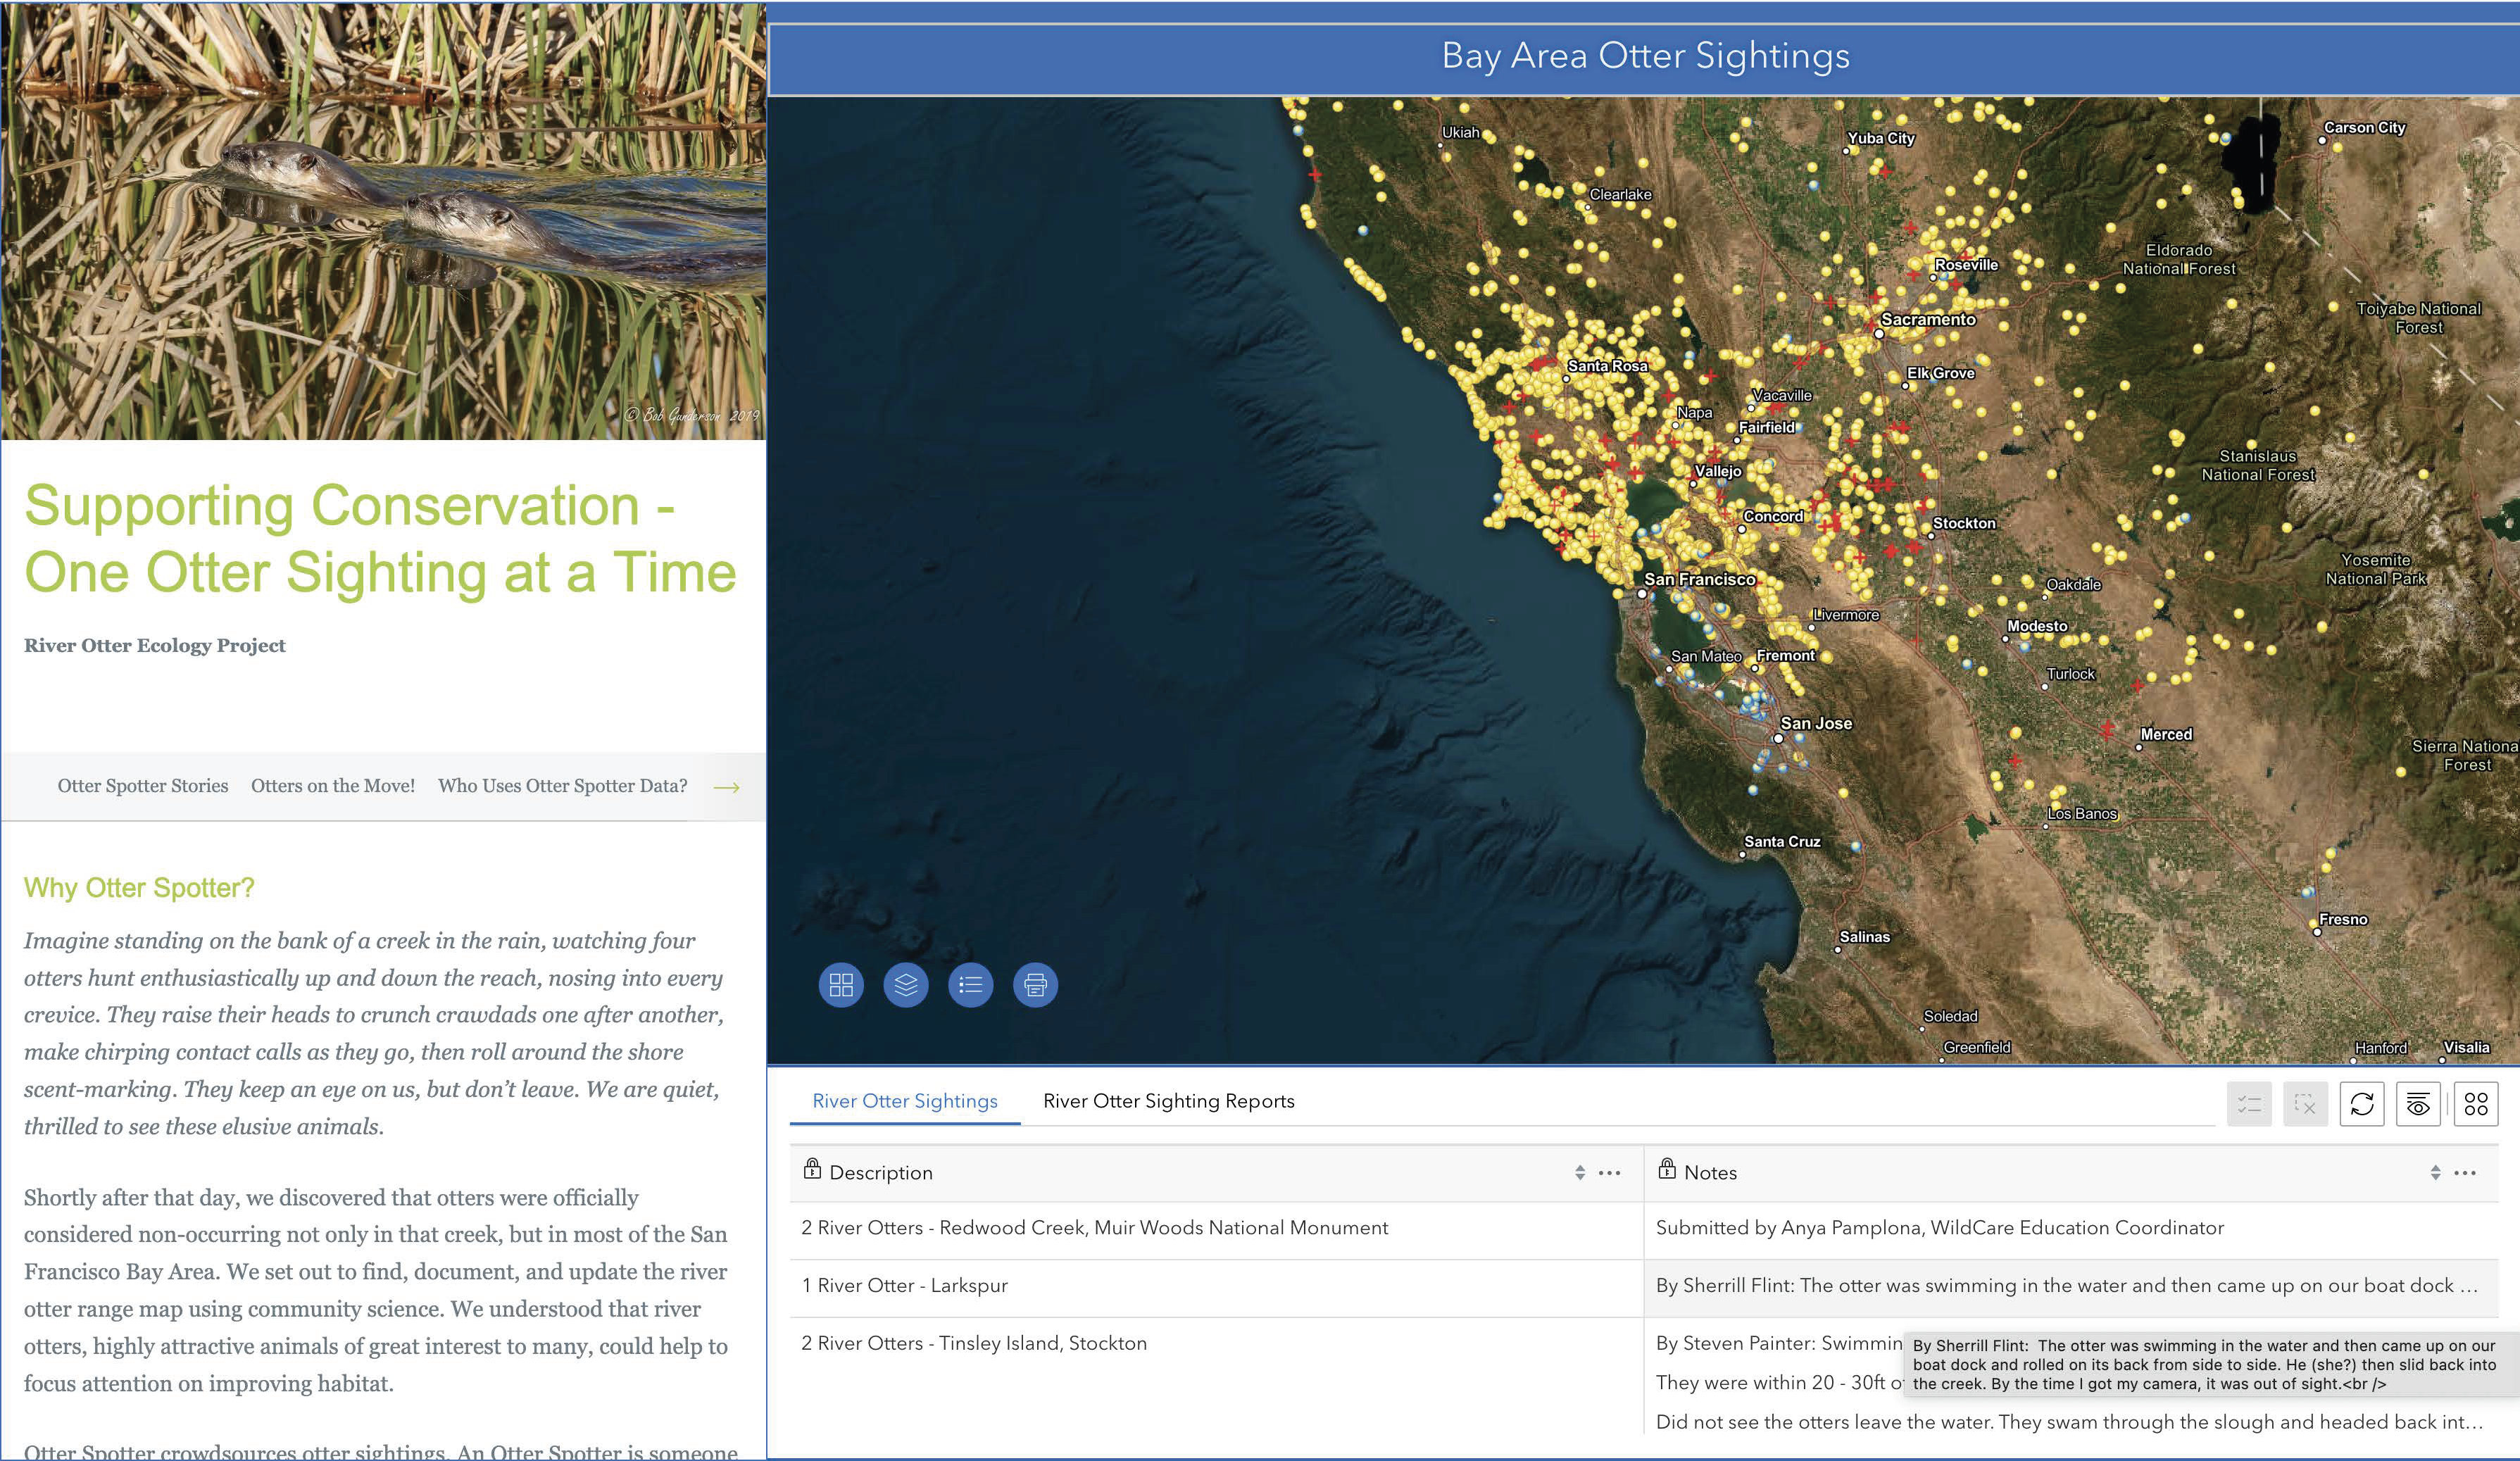
River Otter Sightings
Created with ArcGIS Experience Builder, this page combines a map of river otter sightings with a data table. It also incorporates images and a series of rich media tabs to tell the story of river otter sighting around the San Francisco Bay Area.
Go to article | Return to overview
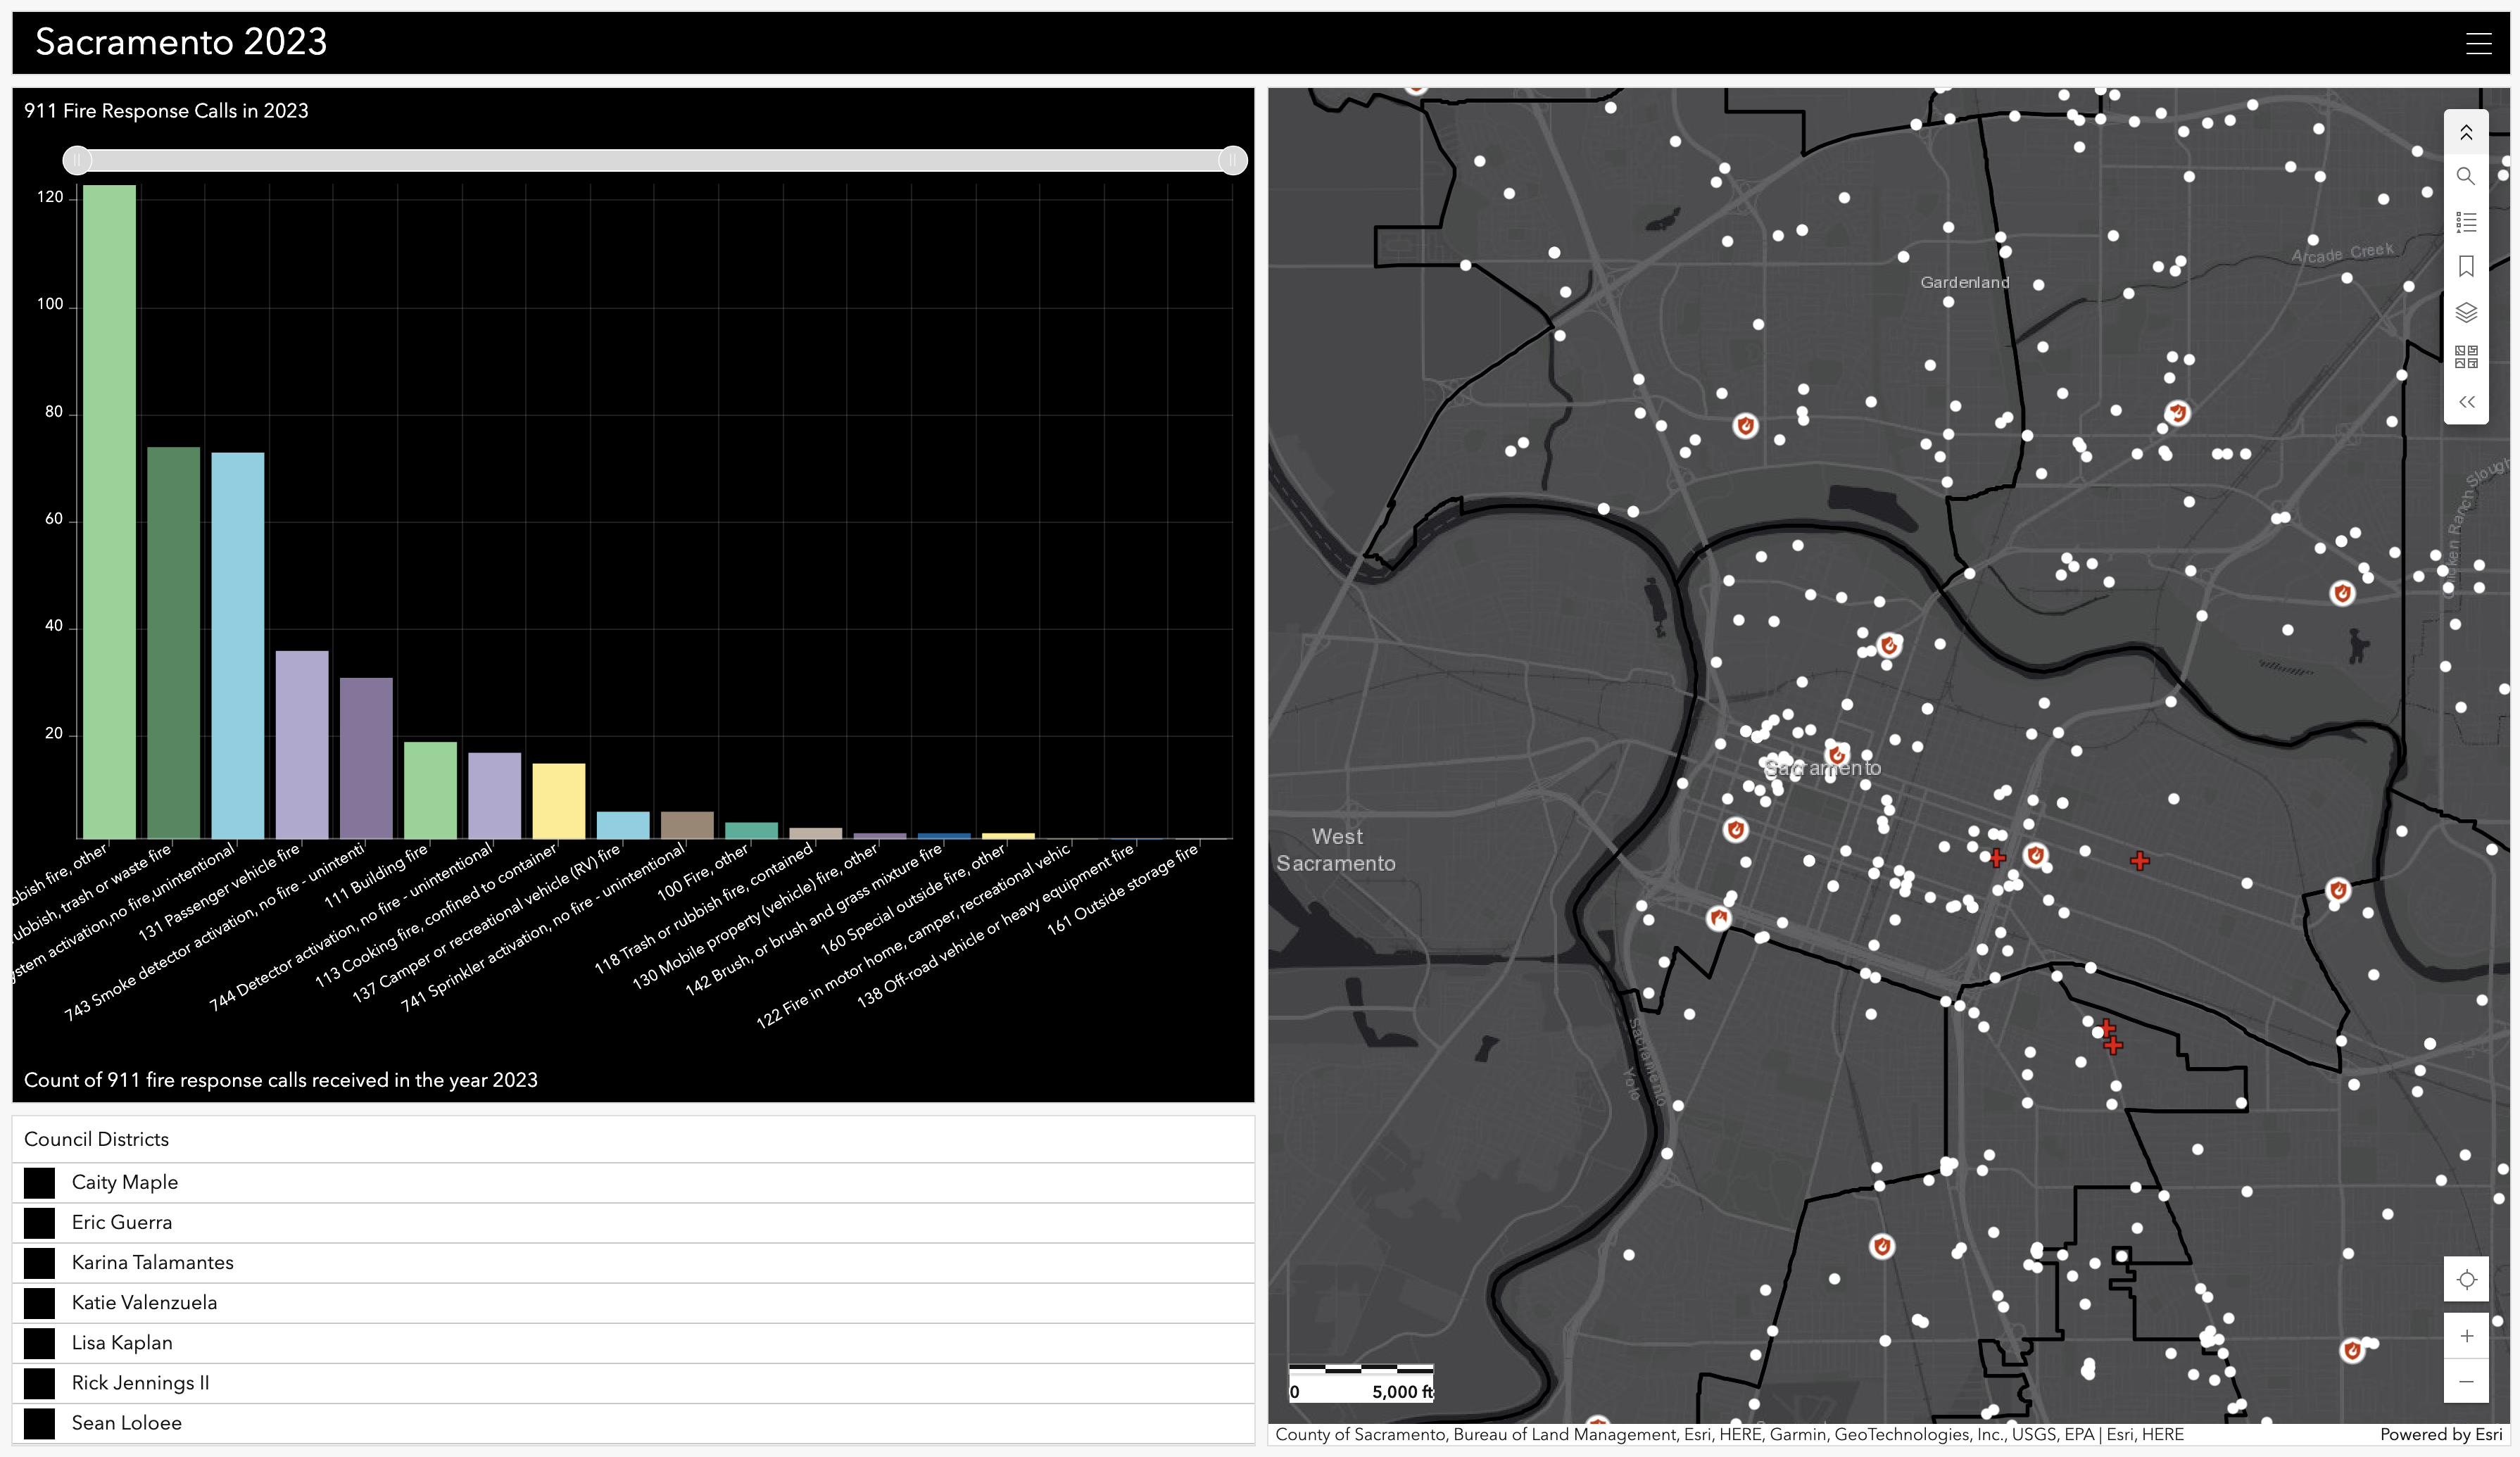
Sacramento 911 Fire Calls Dashboard
Created with ArcGIS Dashboard, this page displays 911 fire calls in Sacramento, California.
Go to article | Return to overview
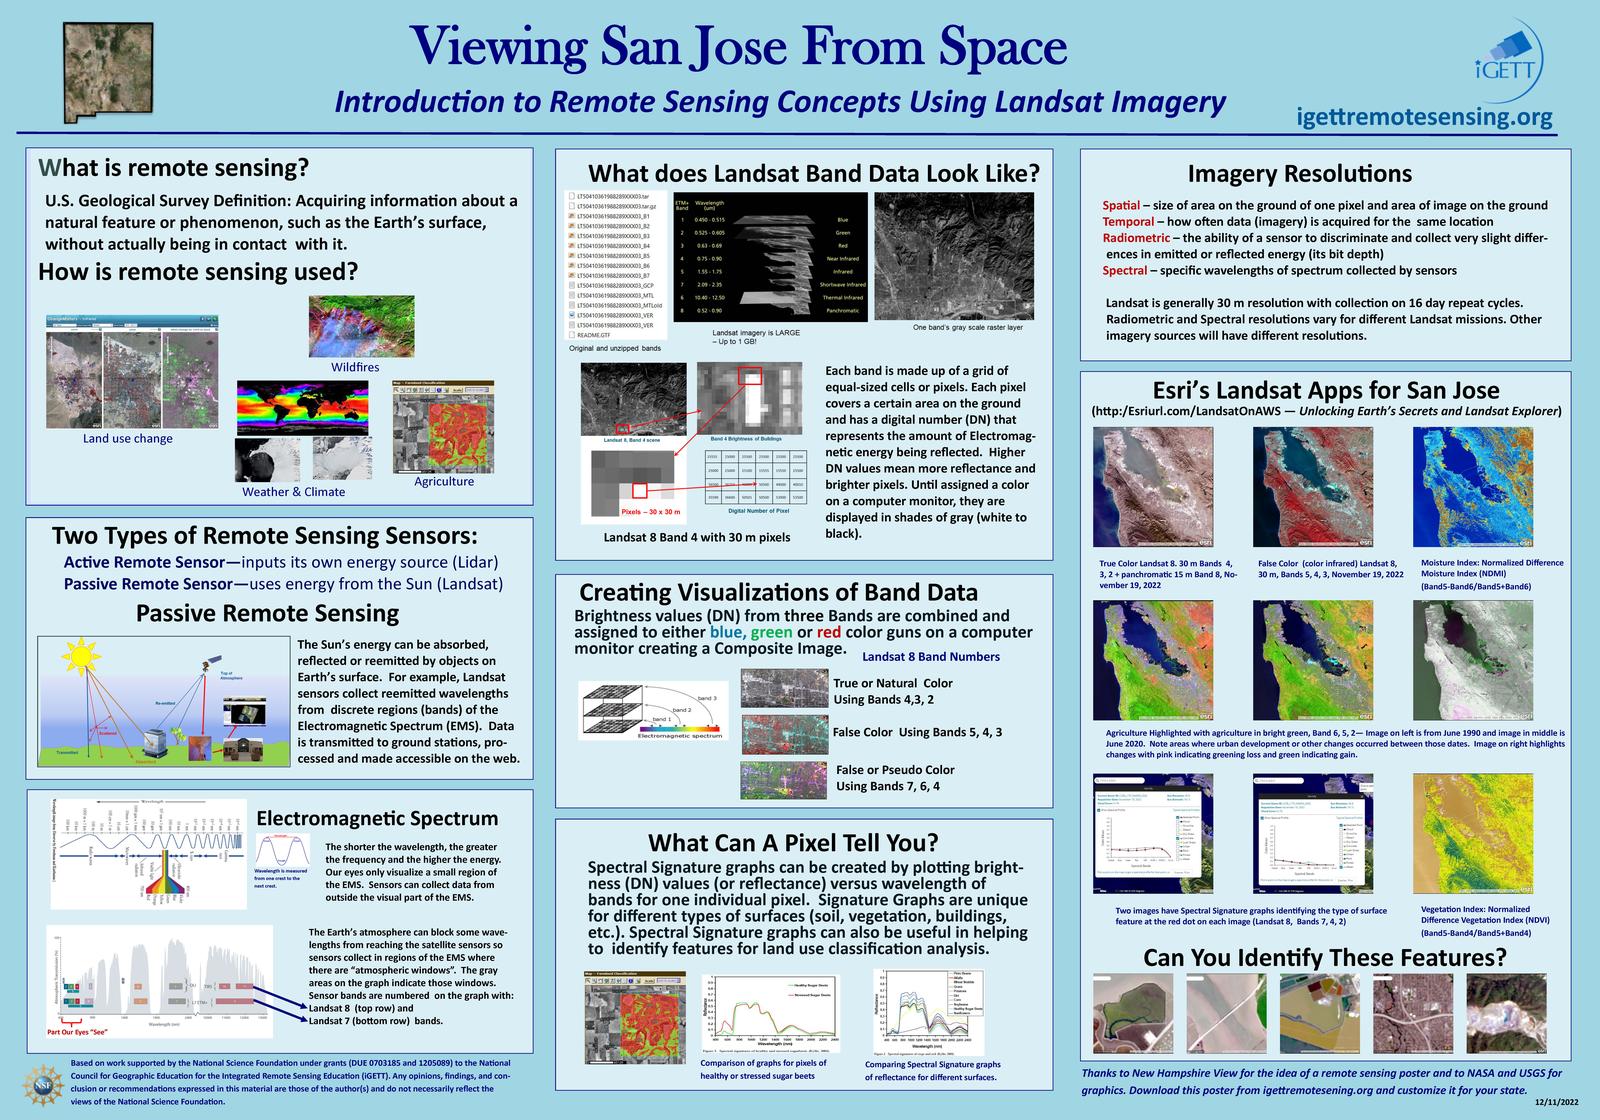
San Jose from Space
San Jose from Space.
Go to article | Return to overview
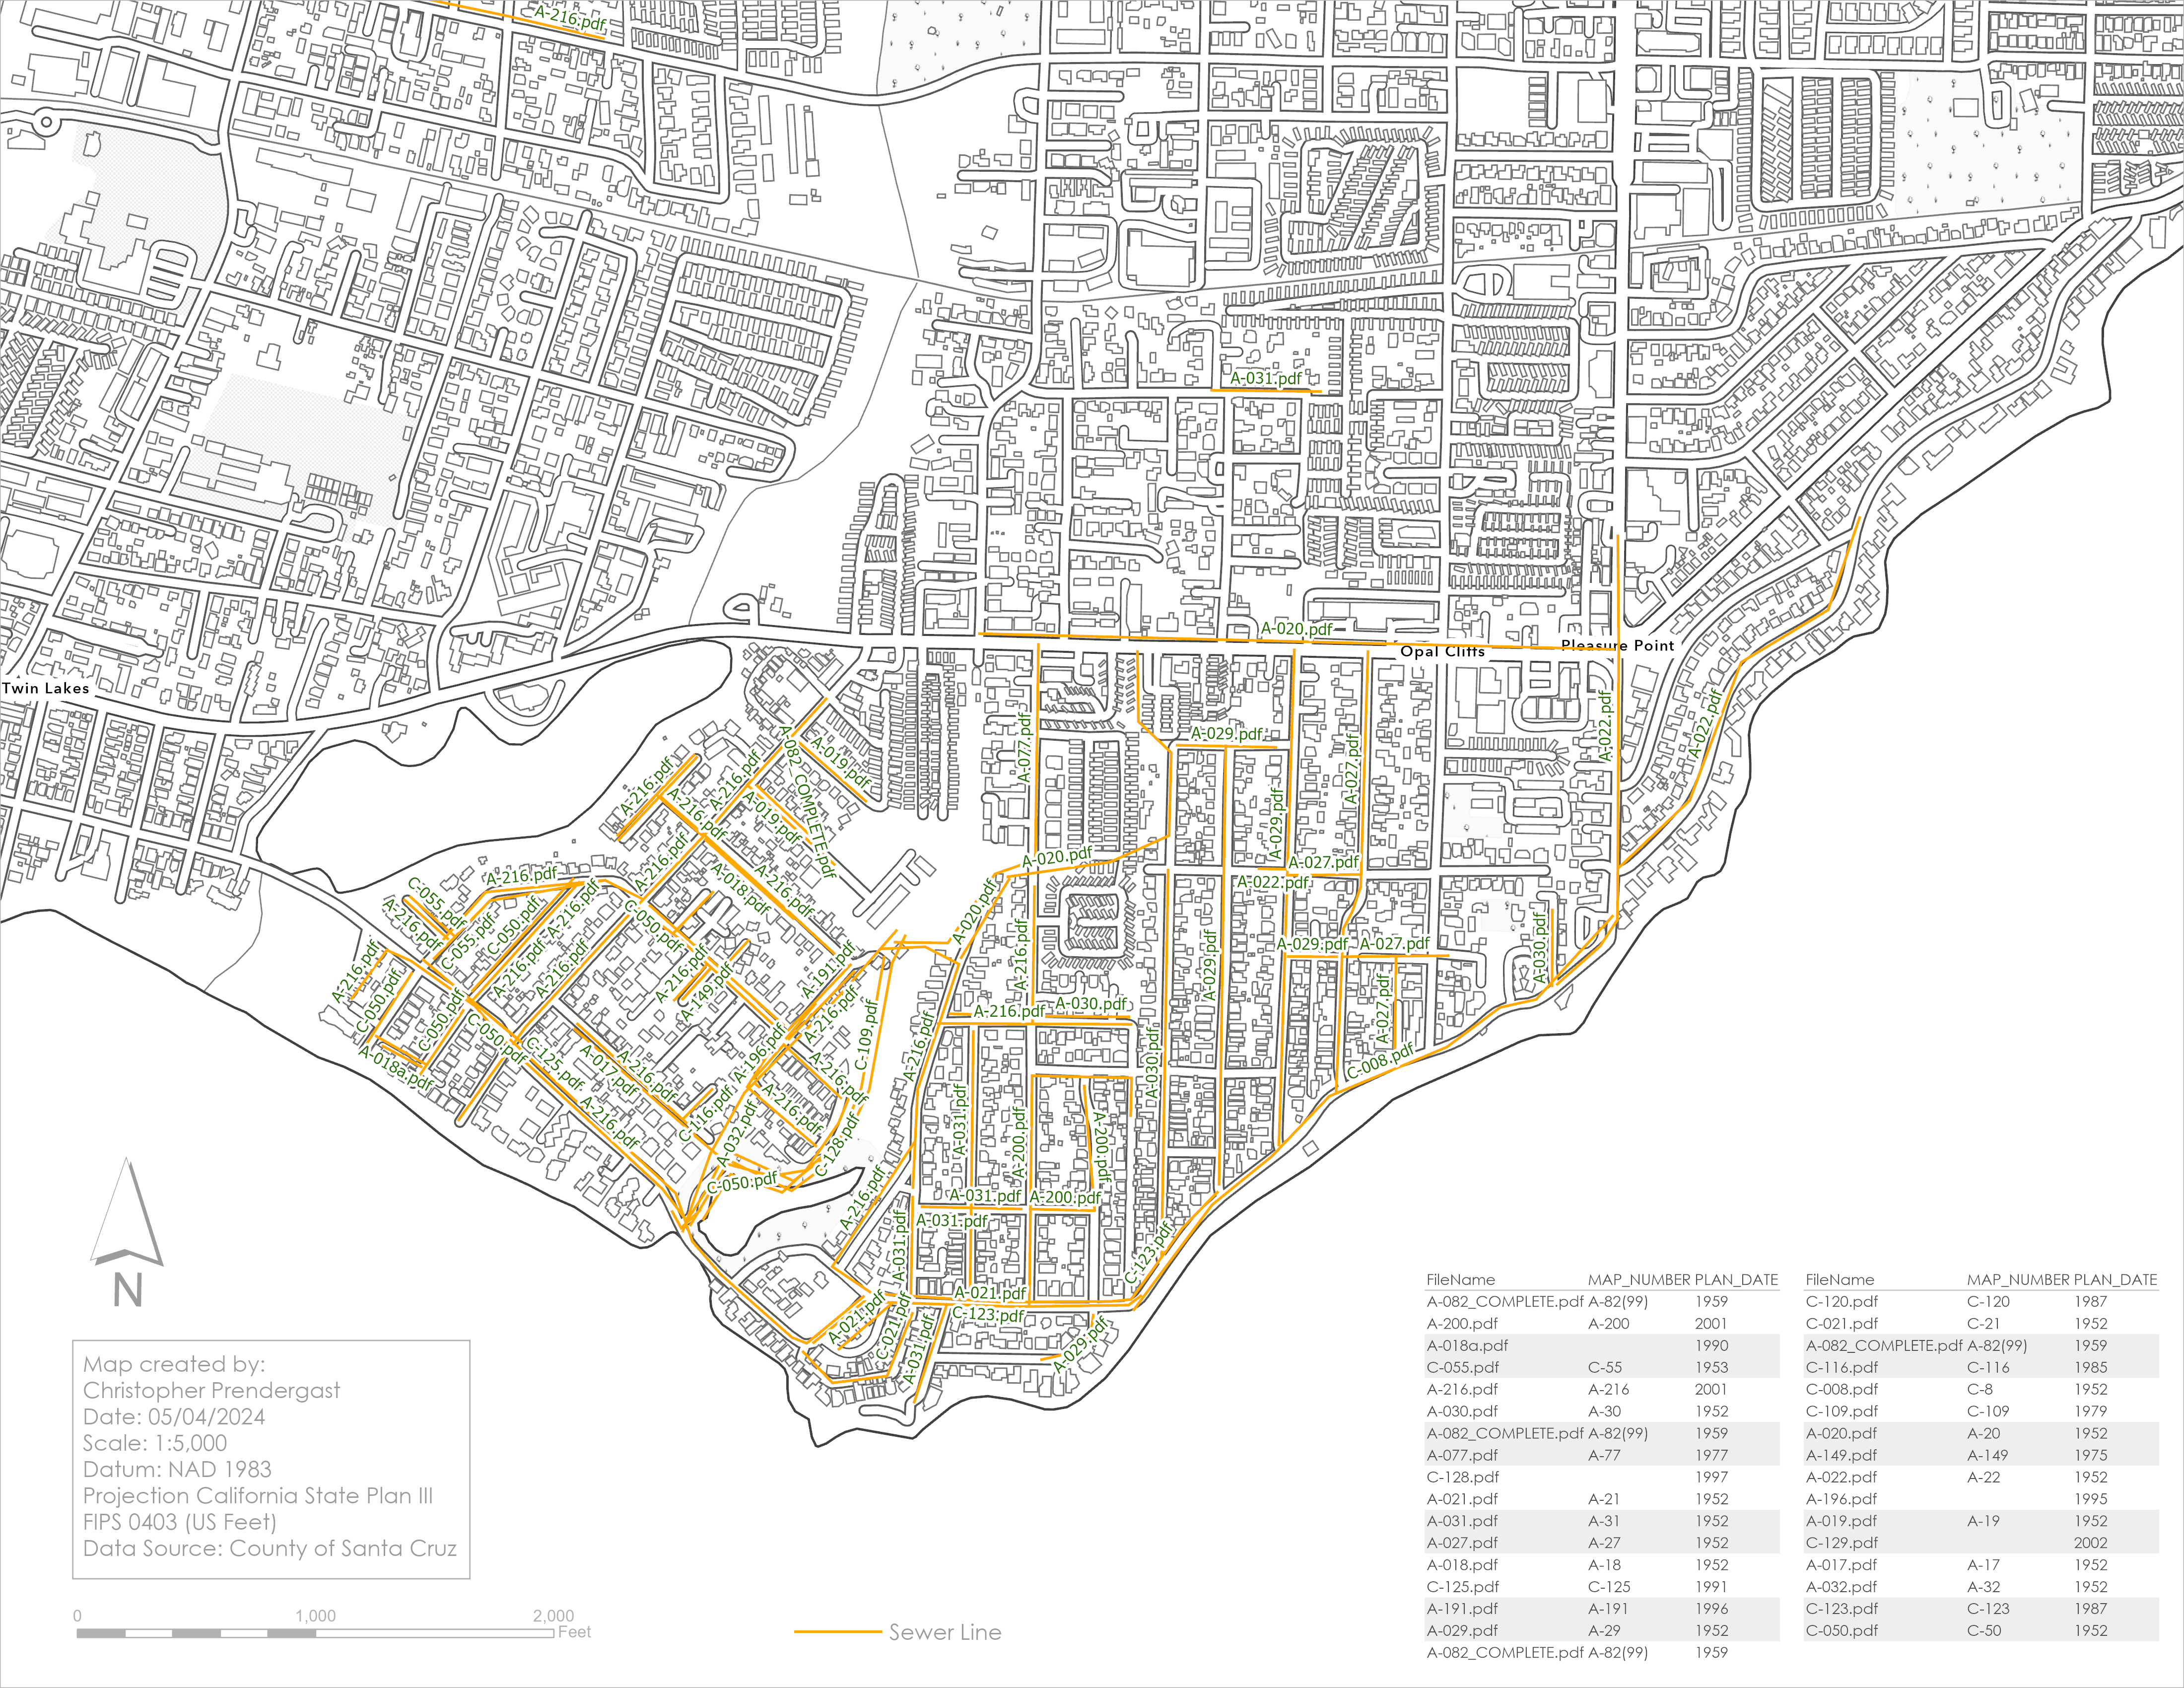
Sanitation Drawing Index Map, Santa Cruz County
A Sanitation Drawing Index feature class has an attribute which holds the name of a pdf file containing the as-built construction drawings for the corresponding sewer line. However, over the years, this folder has not been maintained or updated. A Python script iterates through each record in the feature class and checks whether the corresponding pdf file exists in the folder. If it does then the file is copied to a new folder and deleted from the original folder. The end result is two folders. The original folder that contains all the old maps which have no corresponding feature in the feature class, and a new folder that only contains those maps that do have a corresponding feature in the feature class.
Go to article | Return to overview
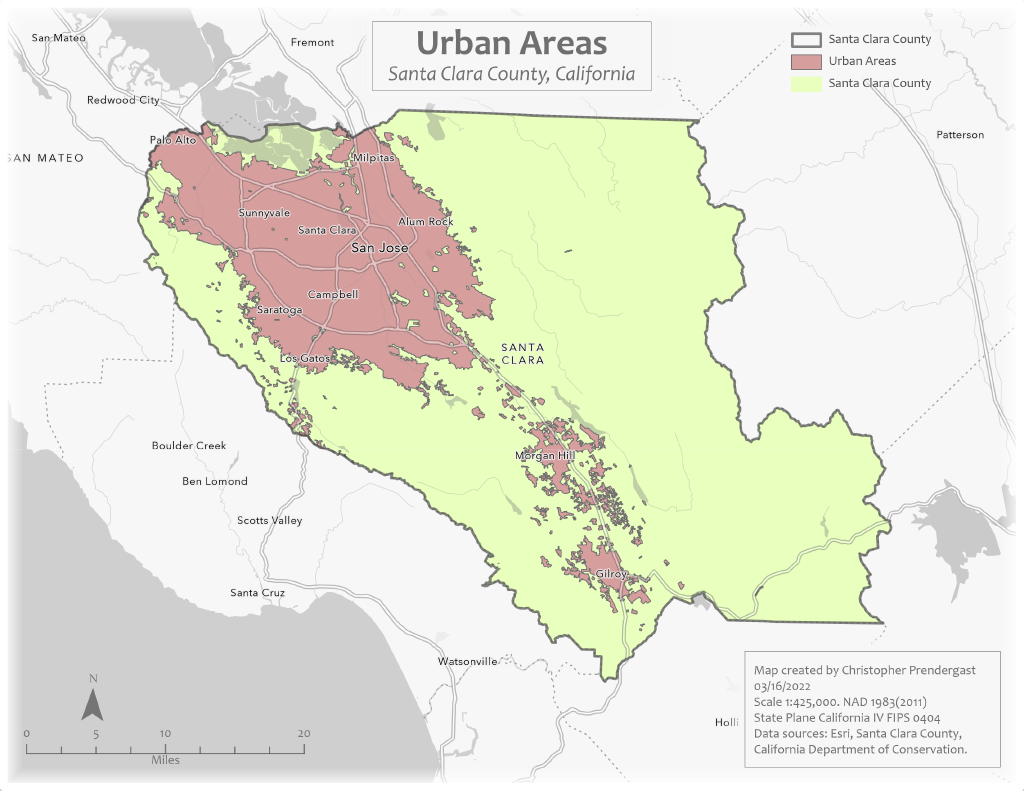
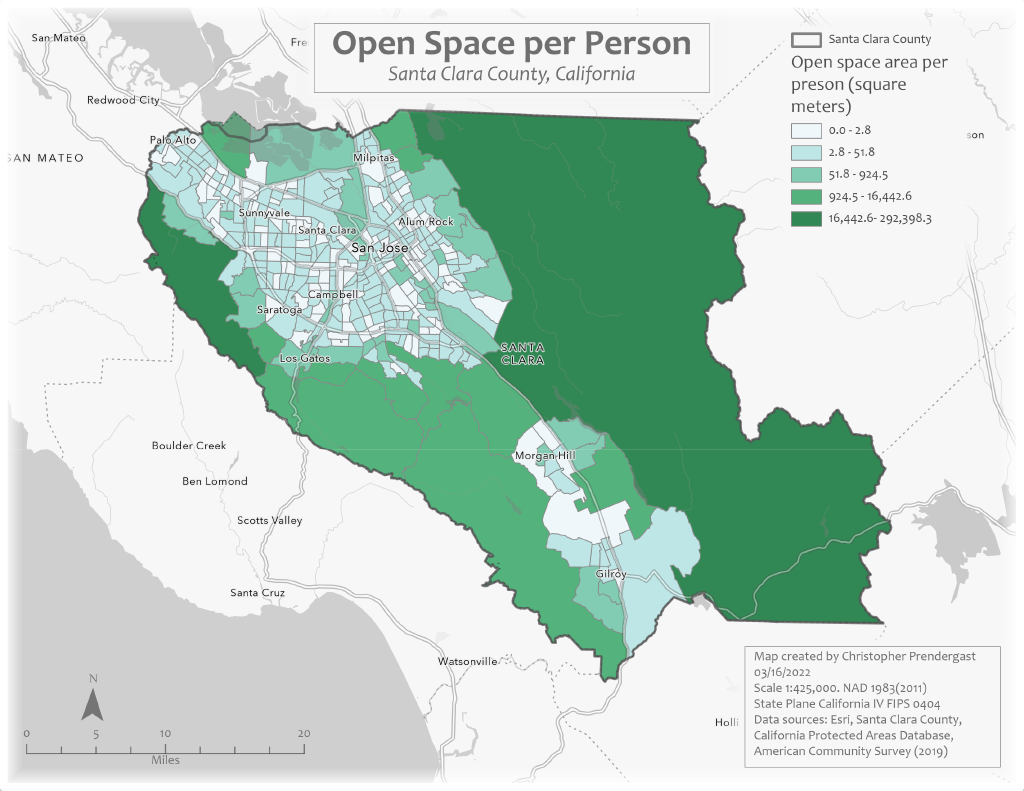
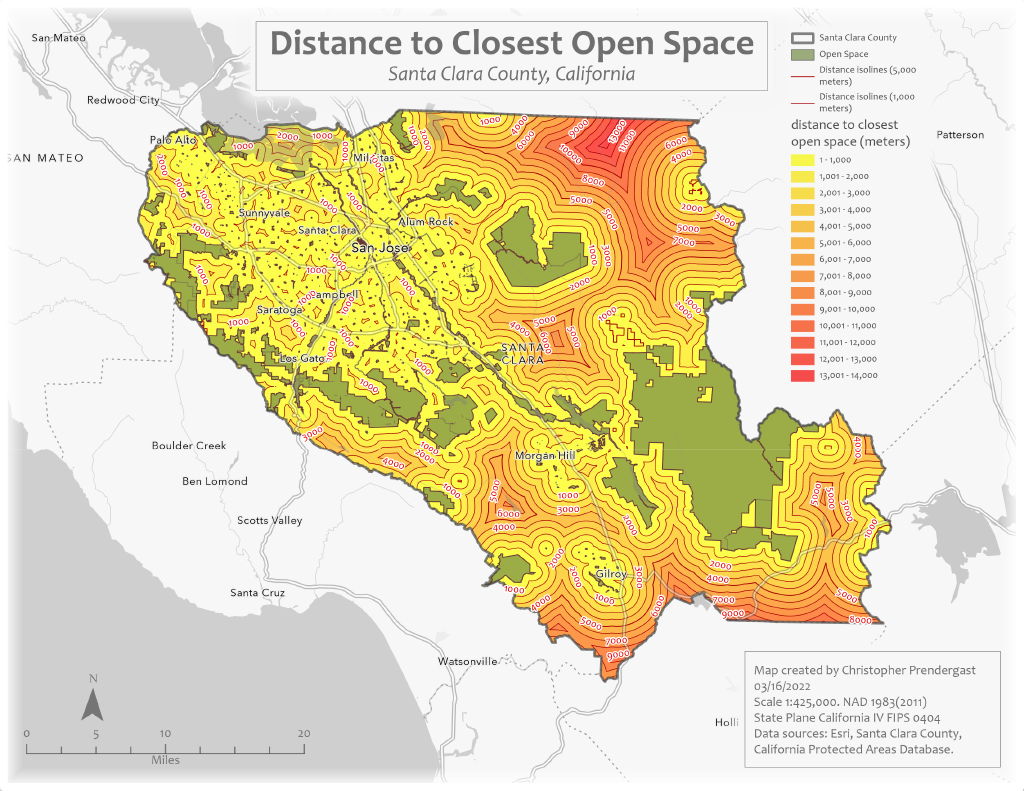
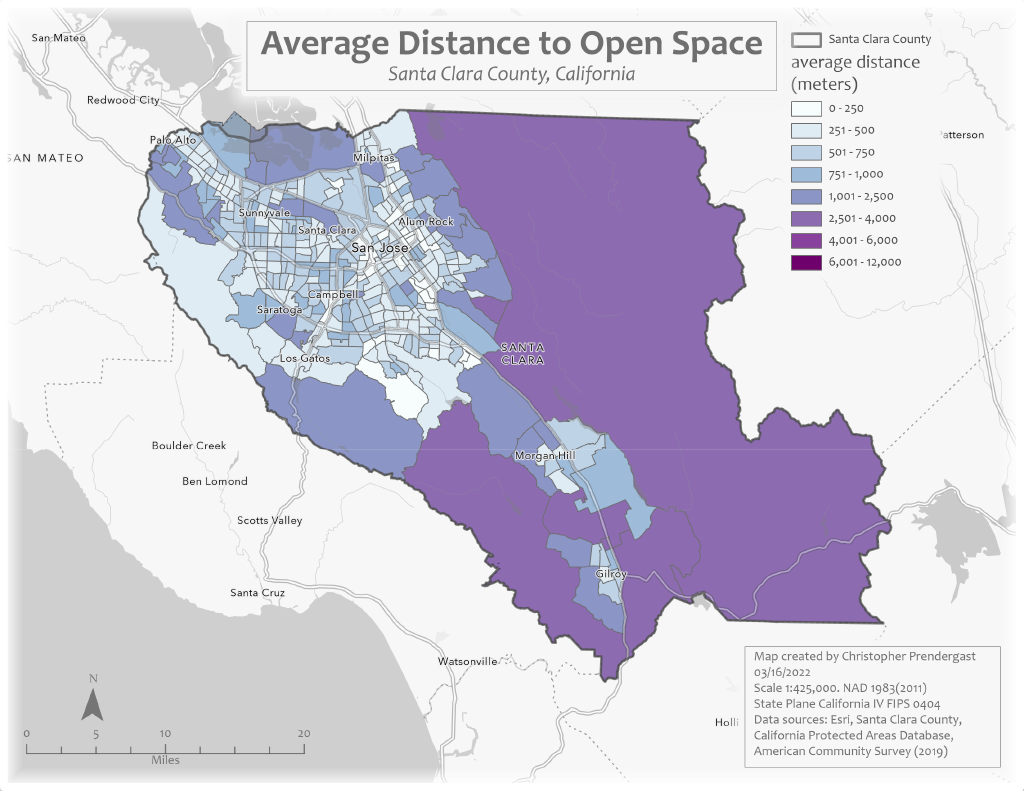
Santa Clara Valley Open Space Story Maps
presents an analysis of the accessibility of open space in Santa Clara County, California. Individual maps examine the current extent of urban, agricultural, and open space areas, the potentail risk of development, population distribution and density, and the spatial distribution of various measures of accessibility.
Go to article | Return to overview
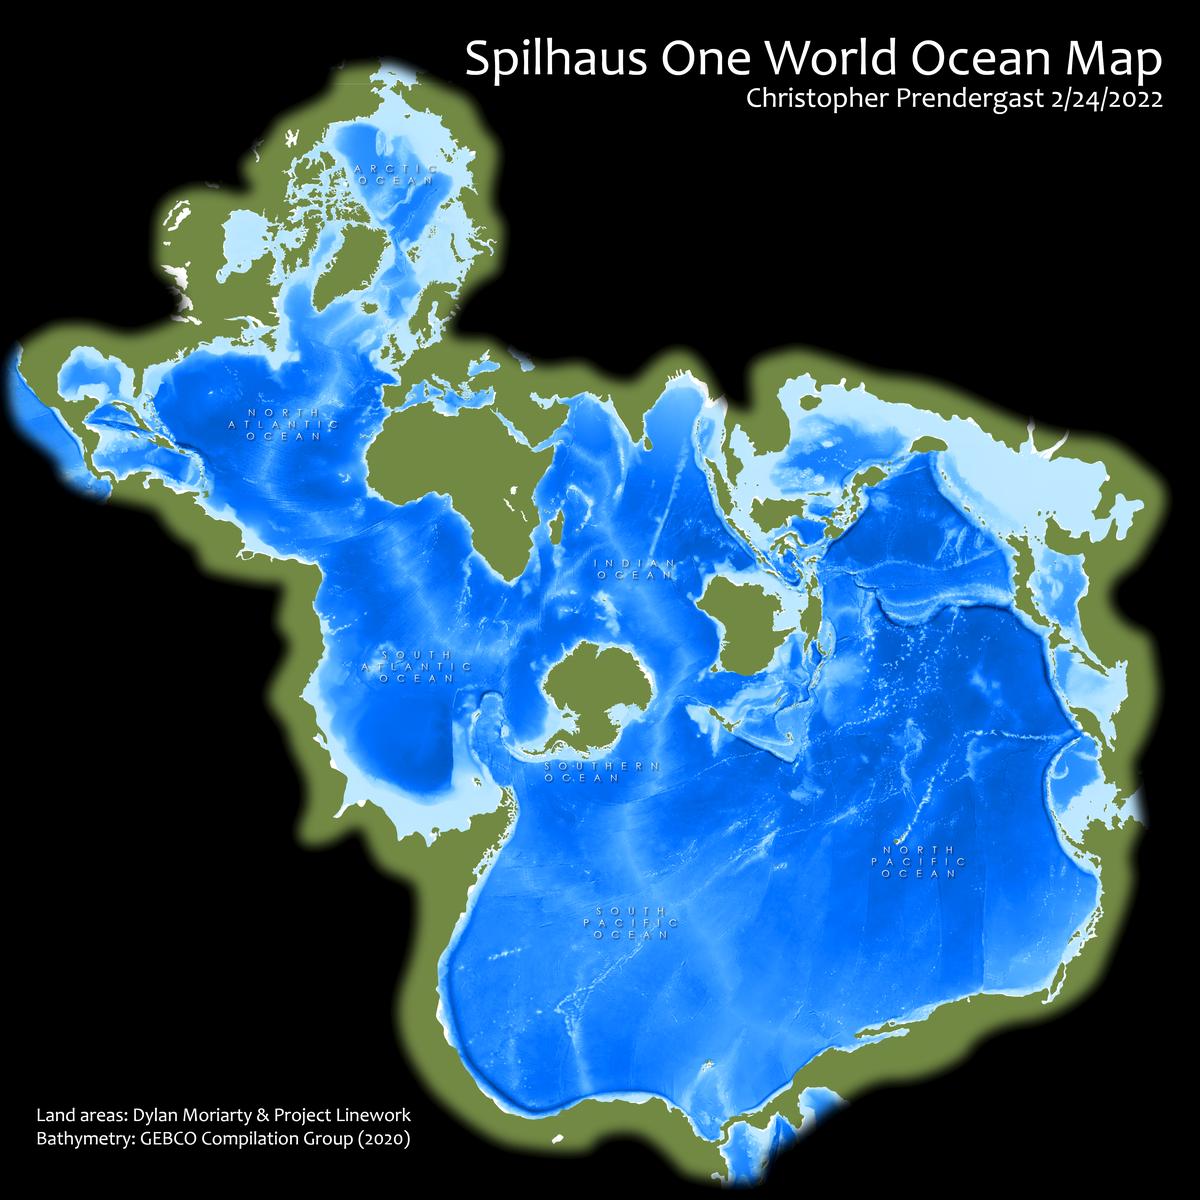
Spilhaus World Oceans Map
This map uses the to illustrates the connectivity between all of the world's oceans. It is based on the Spilhaus projection. Athelstan Spilhaus designed his world ocean map in 1942. This is the result of an exercise from Esri's Cartography MOOC which involves the explicit manipulation of spatial references and coordinate systems.
Go to article | Return to overview
StoryMap: Harmony Headlands
This StoryMap combines maps, text, images, and video to present a short walk along the California coast at Harmony Headlands.
Go to article | Return to overview
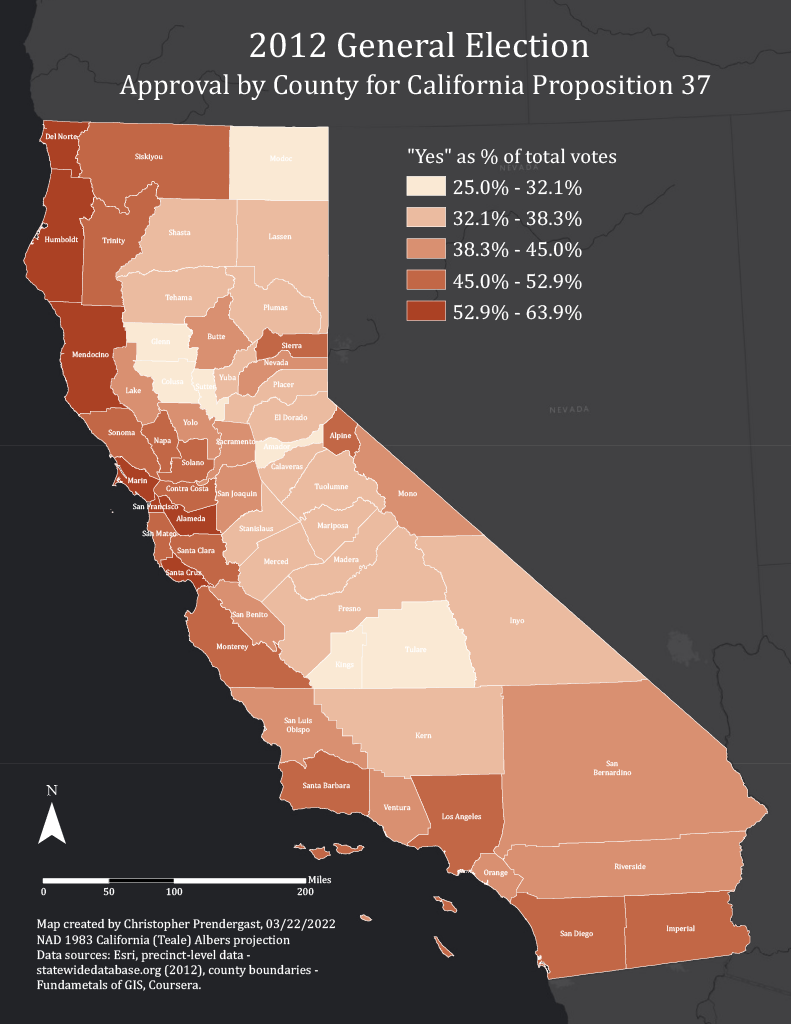
Support for California Proposition 37
Proposition 37 was a California ballot measure rejected in California at the statewide election on November 6, 2012. This initiative statute would have required labeling of genetically engineered food, with some exceptions. Choropleth map showing classified approval percentage for California Proposition 37 by county.
Go to article | Return to overview
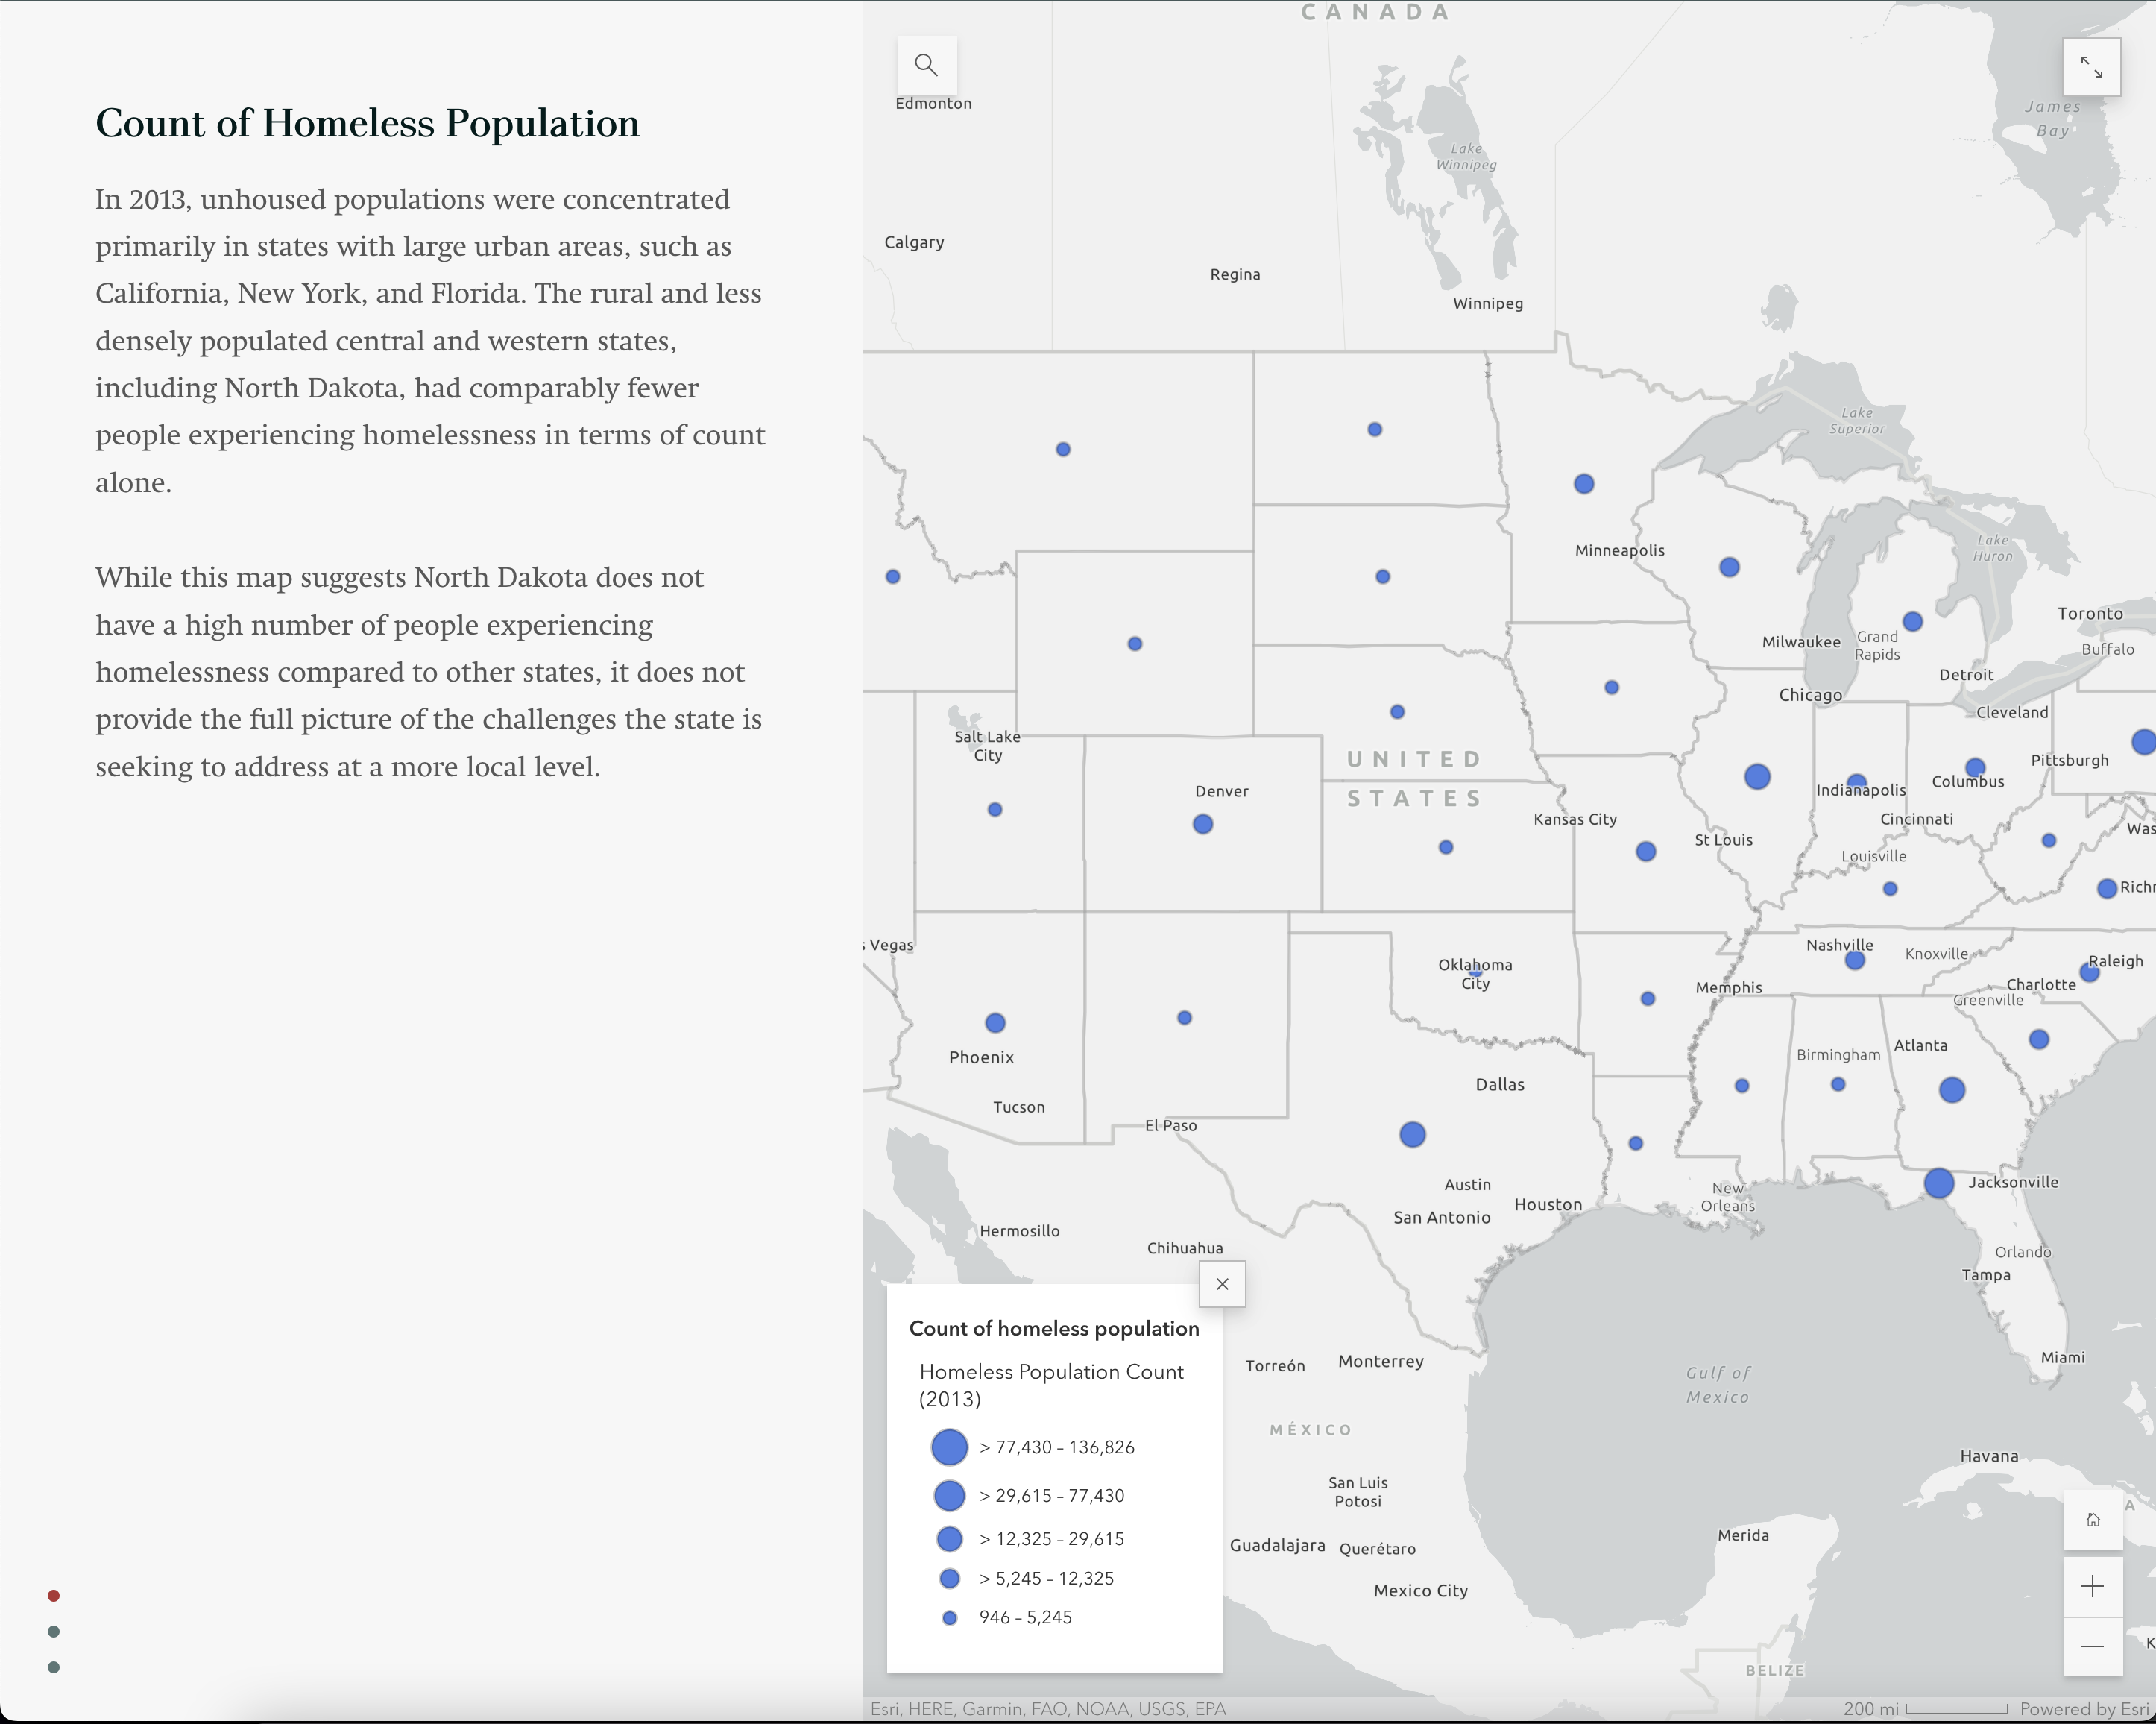
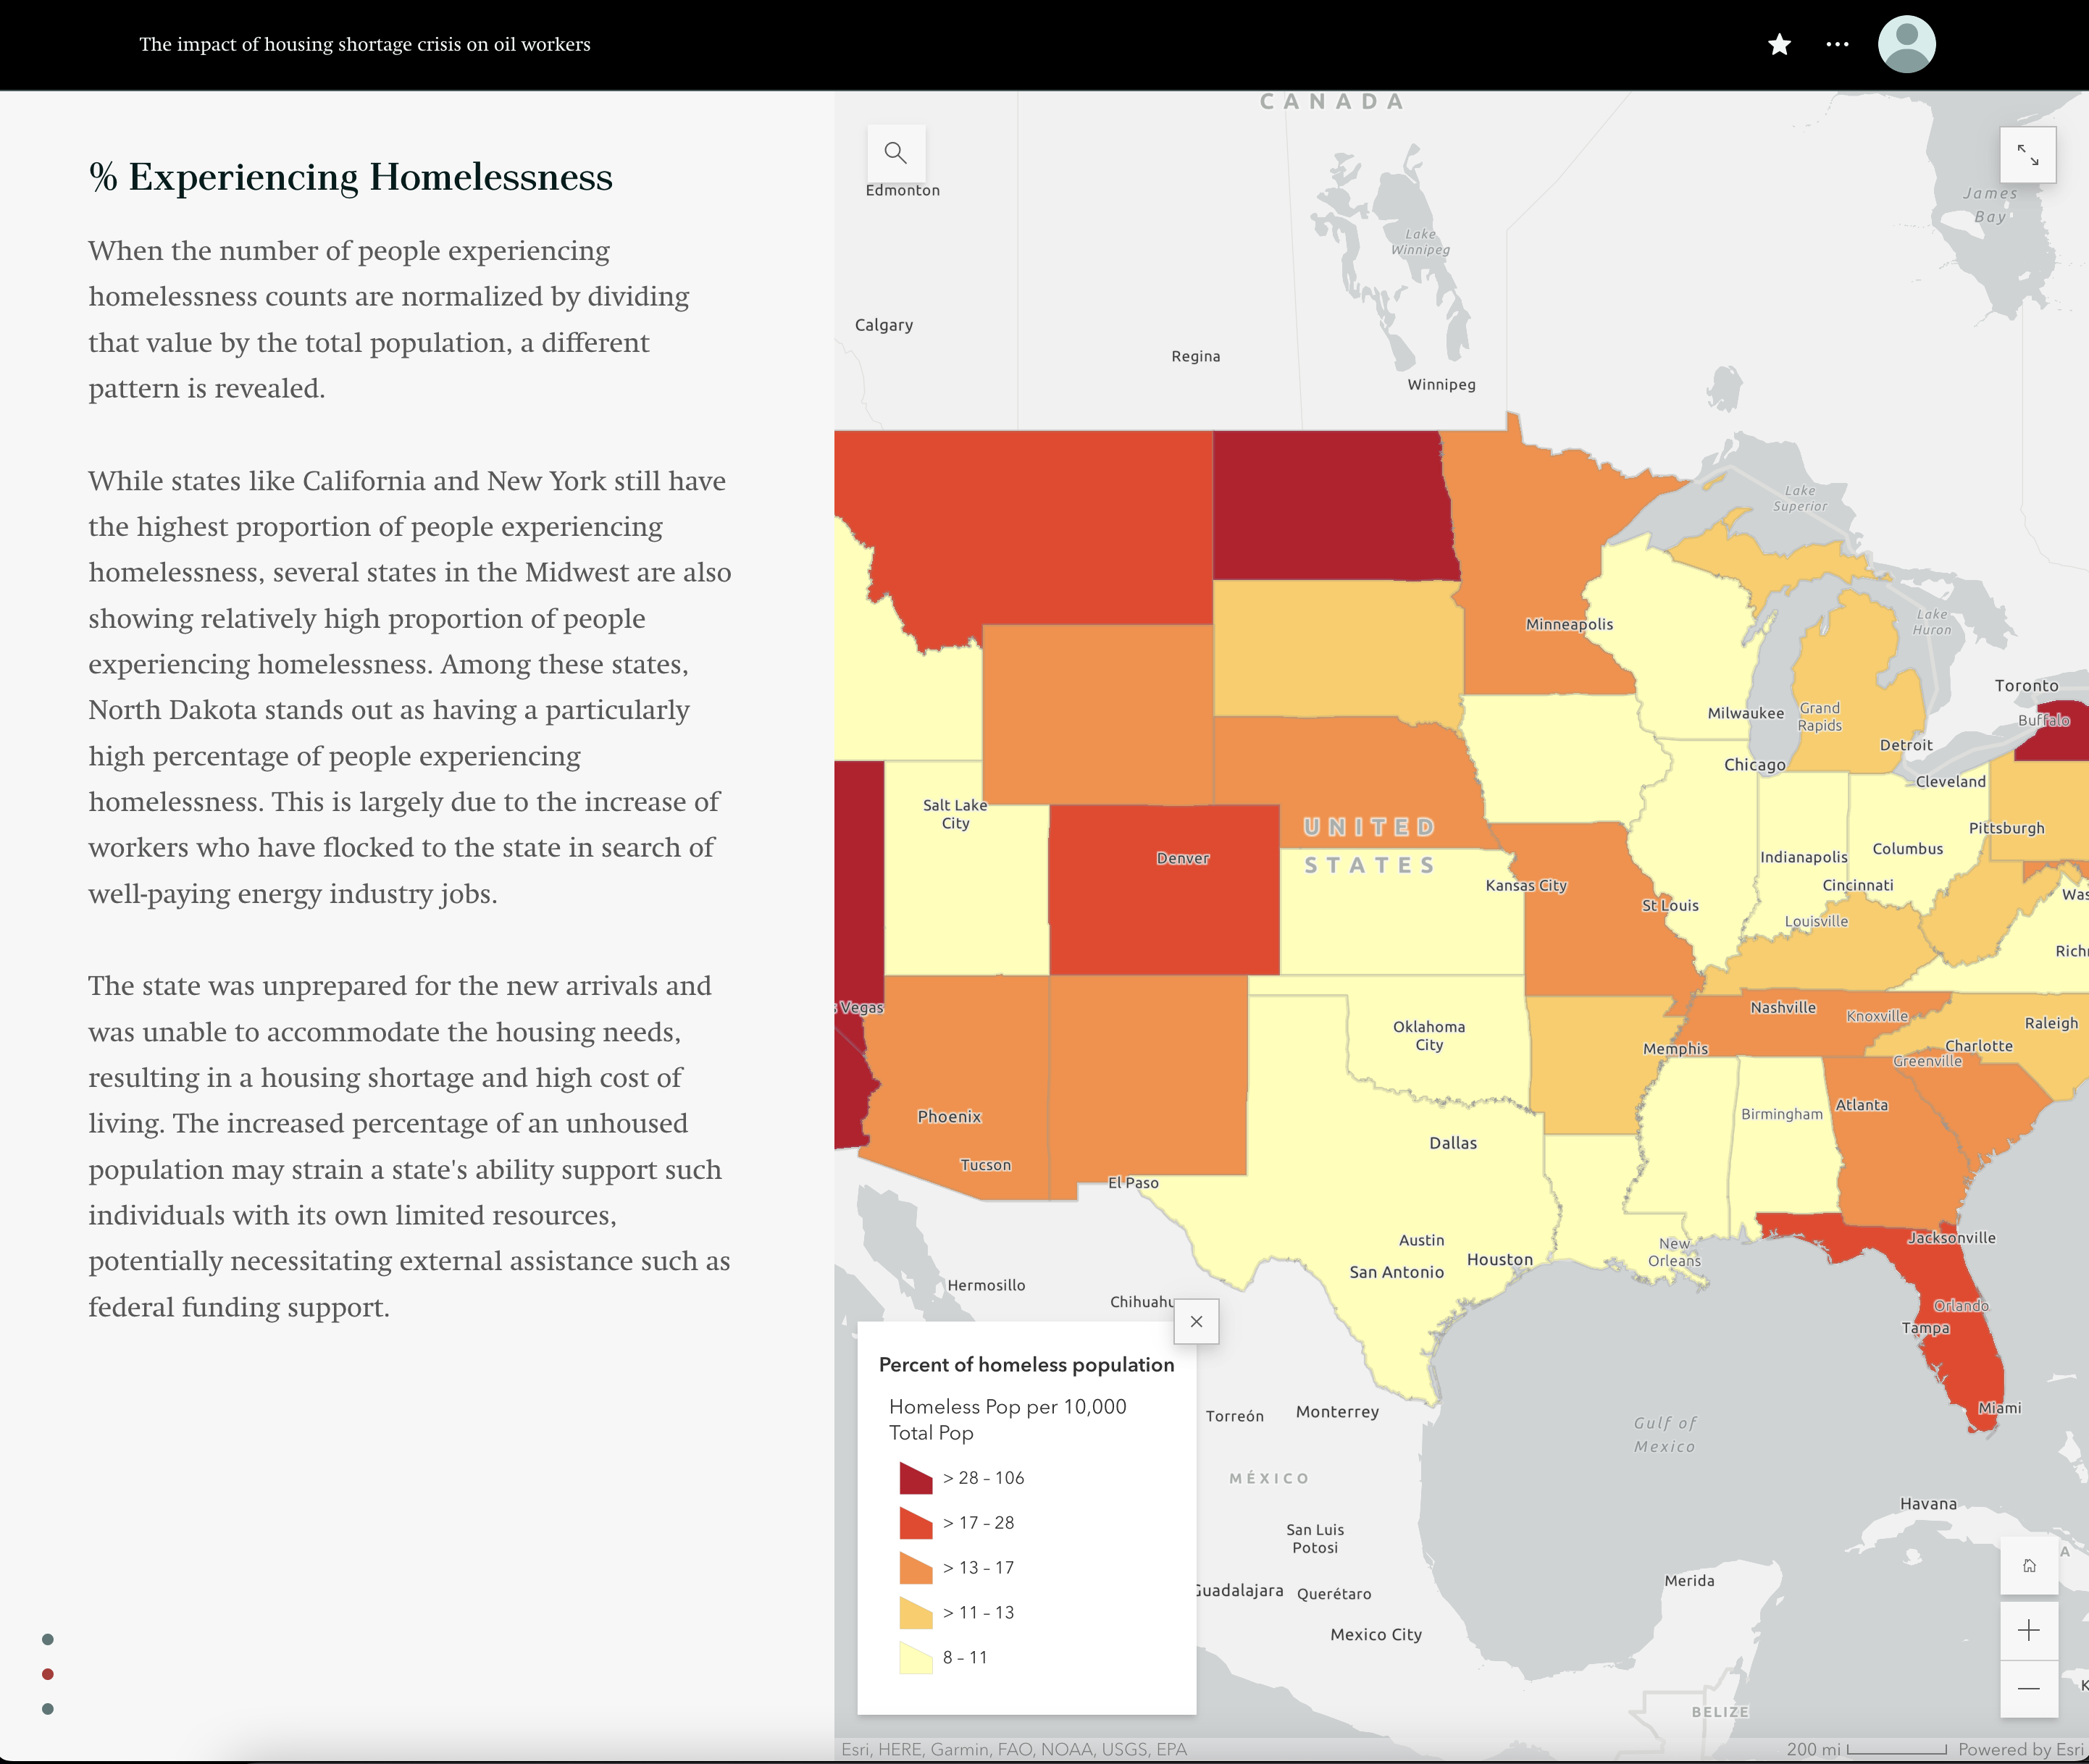
The impact of the housing shortage on oil workers
The story of how an oil boom increased the unhoused population in North Dakota in 2013. Between 2012 to 2013, new discoveries in shale oil and advances in drilling techniques created an economic boom in North Dakota. Workers from across the continent flocked to the rural prairie state in search of plentiful and well-paying jobs. Although the state was able to boast having the high economic index across the board, including the lowest unemployment rate in the country, the boom has put a strain on North Dakota's infrastructure. As some cities nearly doubled their populations, housing was unable to keep pace with the growth. Employed individuals were experiencing homelessness, working by day and taking shelter in temporary, unsustainable housing situations like cars and tents by night.


Go to article | Return to overview
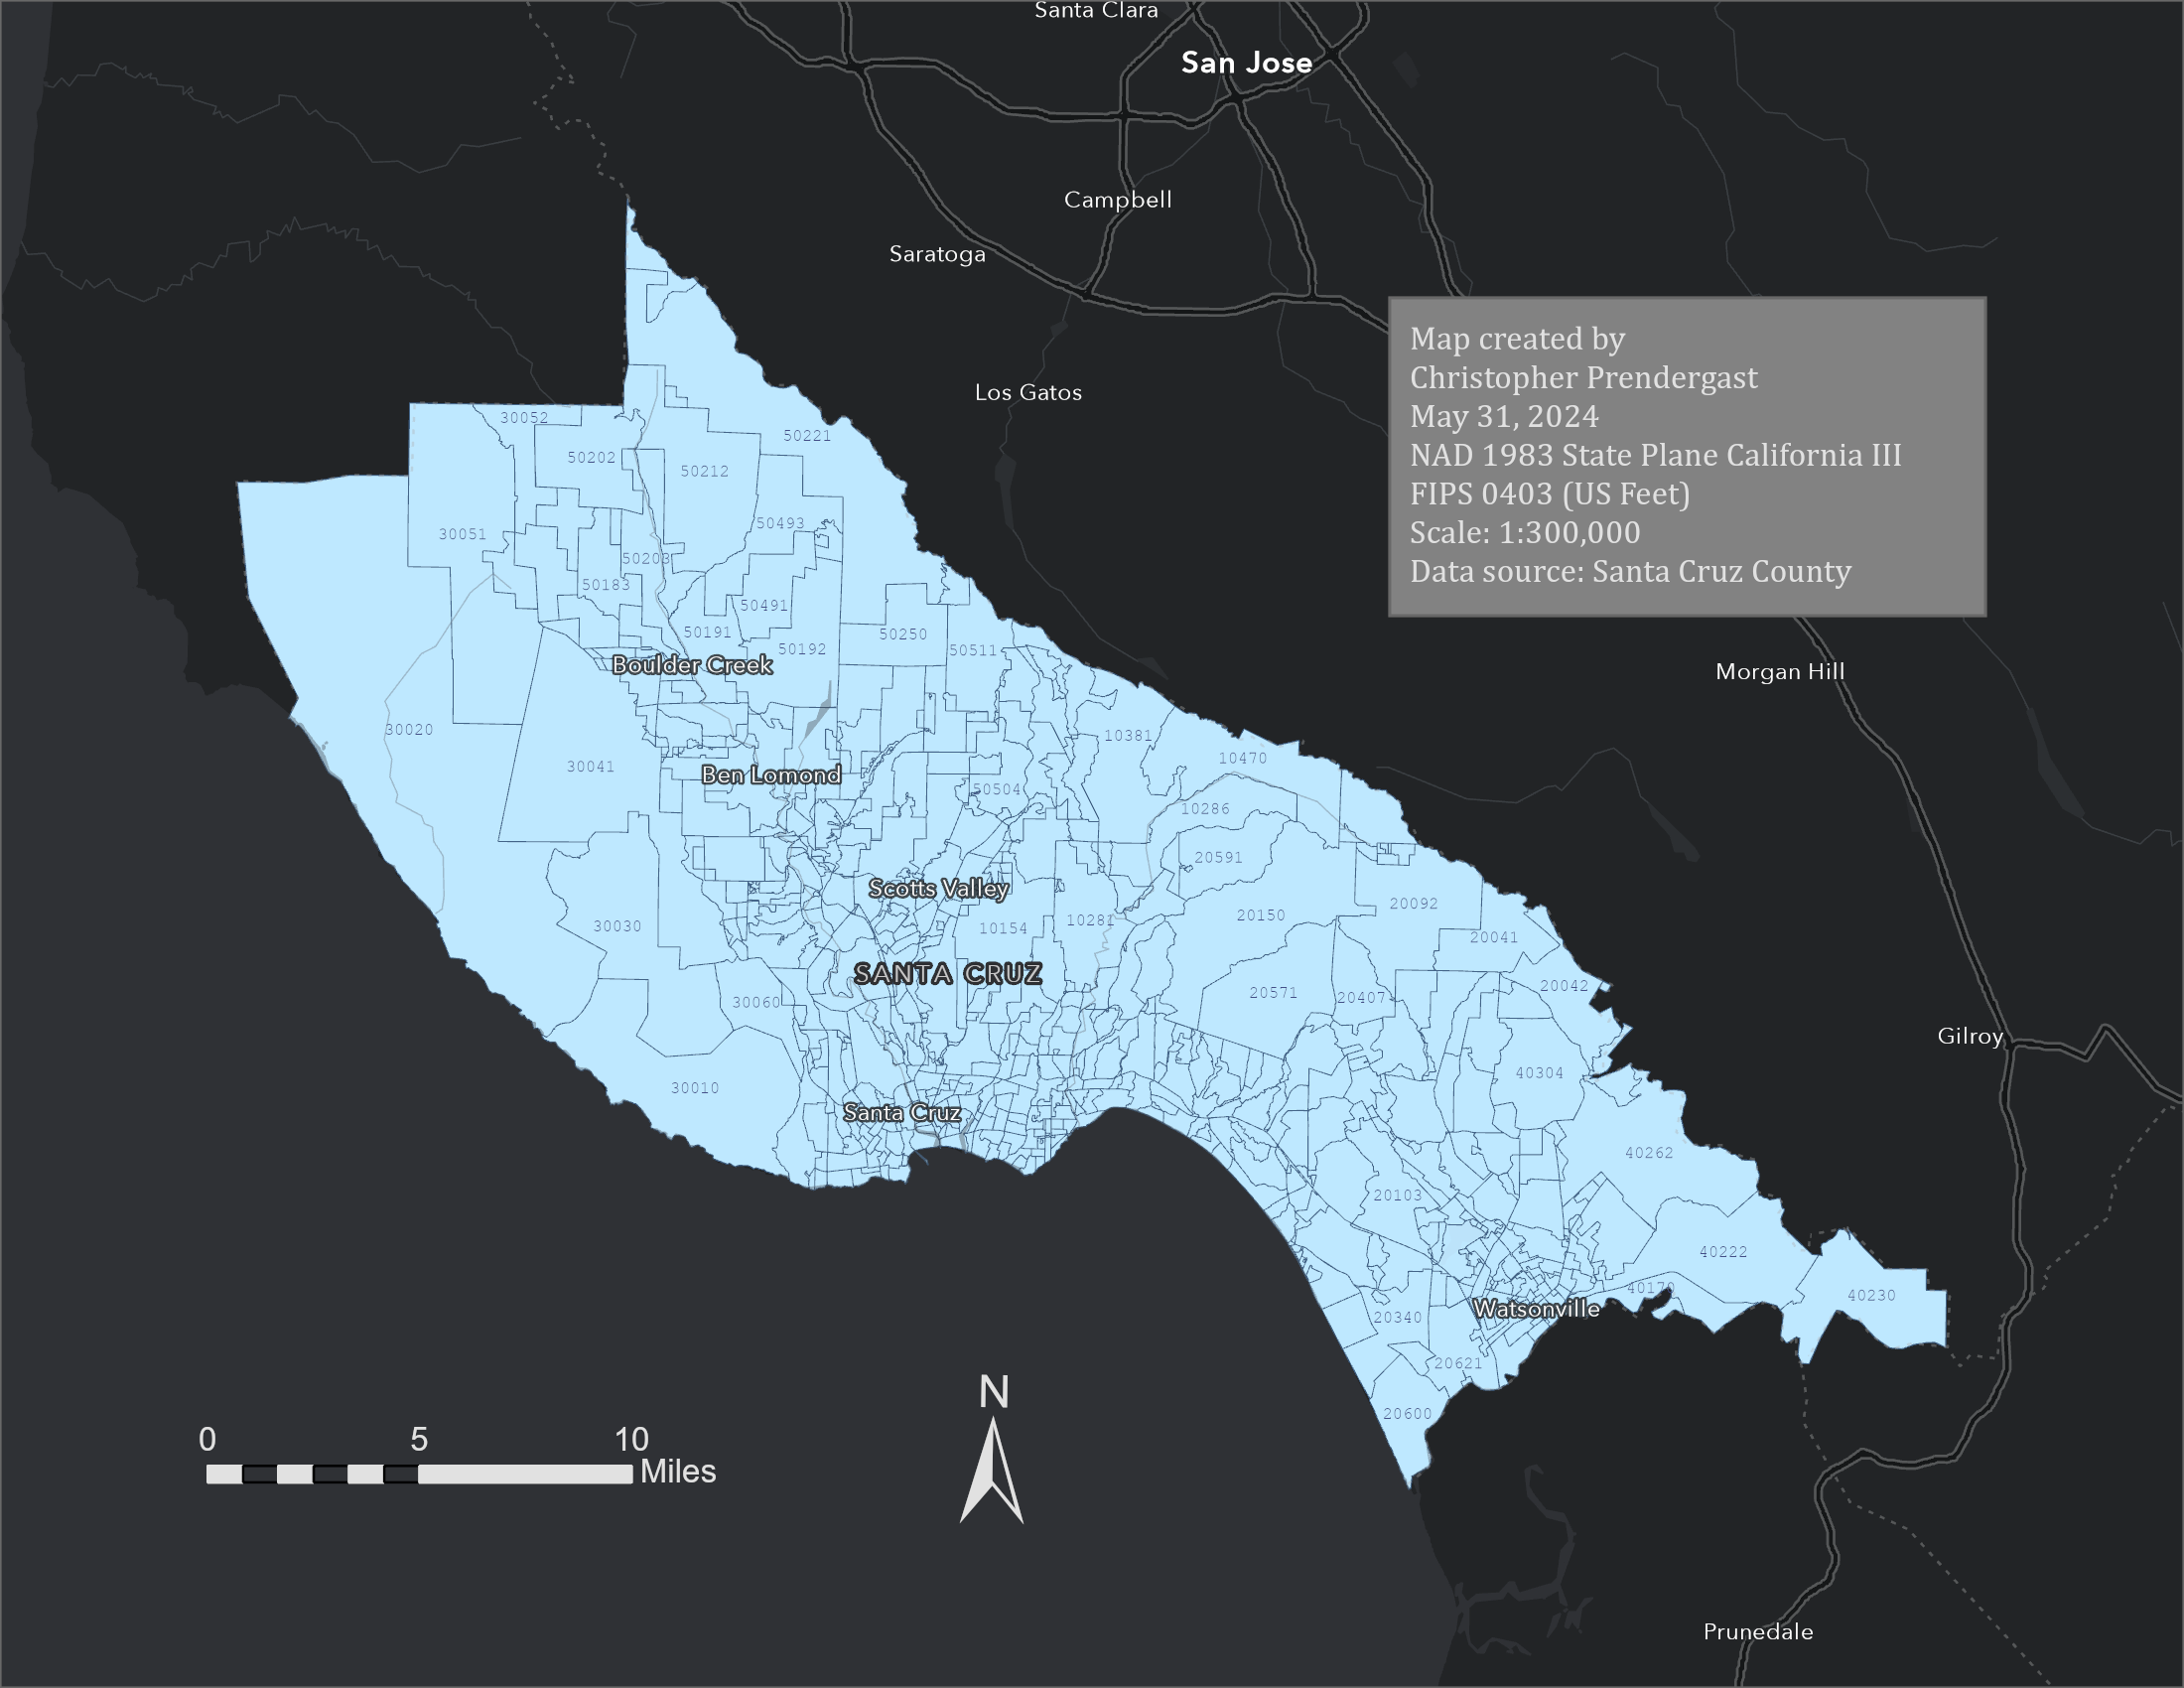
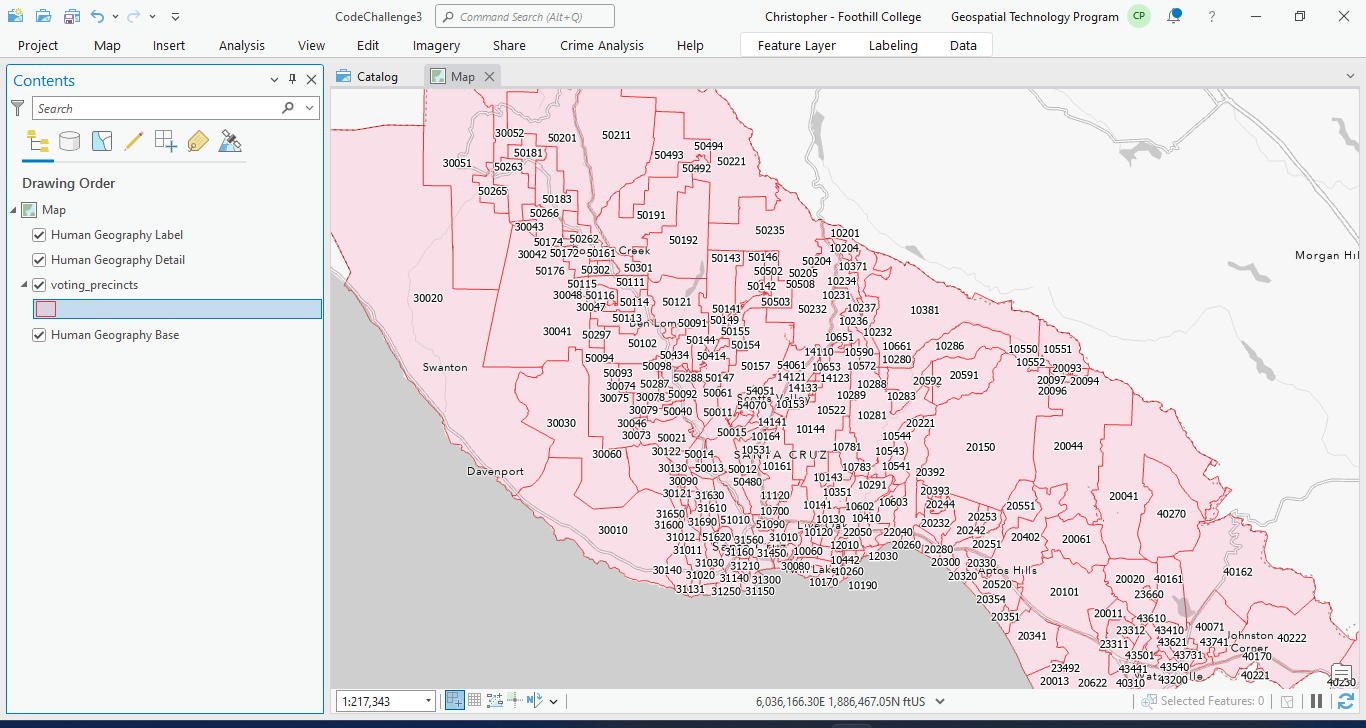
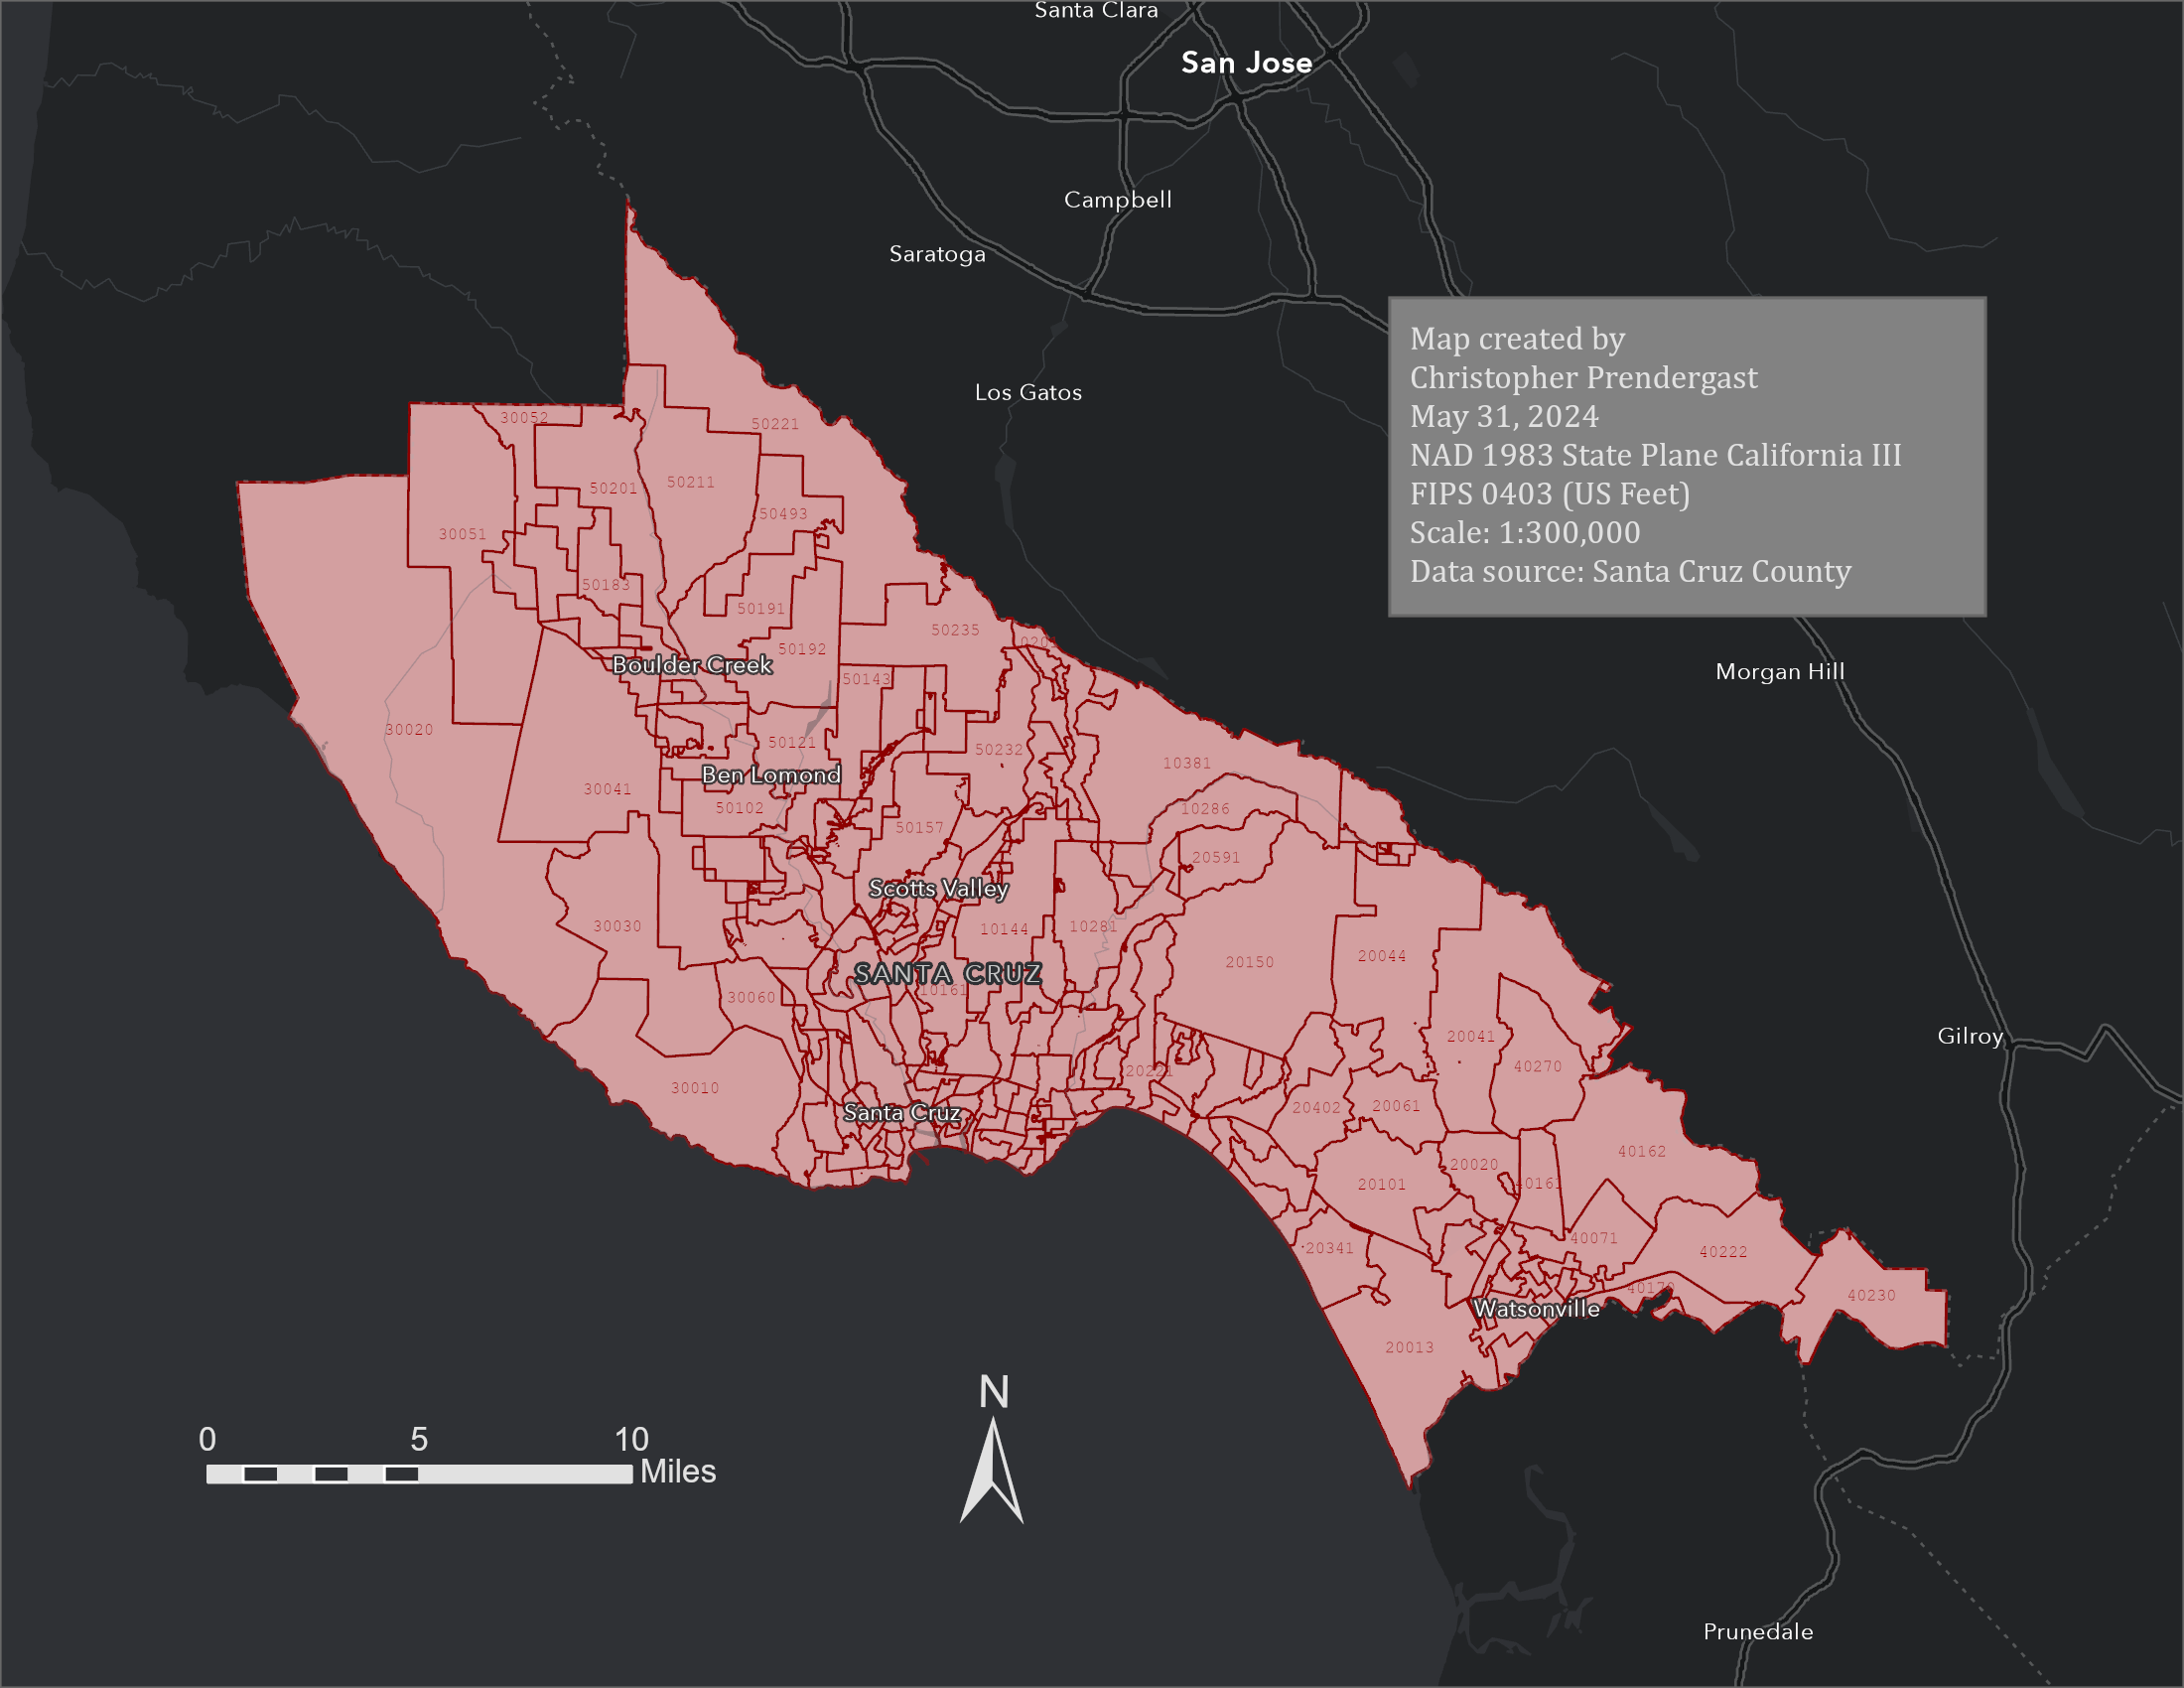
Voting Precincts, Santa Cruz County
Consolidate regular precincts into voting precincts. A layer with 720 regular precincts was provided together with a cross-reference table listing the 138 voting precincts that need to be created each with a corresponding list of their constituent regular precincts. Using Python and the arcpy api, this data was wrangled into a format where it can easily be joined to the regular precincts layer and the regular precinct features were dissolved to create 297 new voting precincts.