Overview
This project applied Geographic Information Systems (GIS) to assess elephant habitat suitability and human-elephant conflict patterns in the Narok and Kajiado districts of Kenya. Using ArcGIS Pro, the study combines environmental layers—such as protected areas, land use, and rainfall—with human-related data including roads, towns, and documented conflict locations.
The goal of this spatial analysis project is to identify potential sites to set aside as elephant habitat conservation zones in southwestern Kenya. The analysis identifies preferred habitats based on rainfall, land cover and land use, then subtract out restricted lands and buffer zones. The data for this analysis was obtained from the International Livestock Research Institute (ILRI), the United Nations Environmental Program (UNEP) and other sources in Kenya.
The project's output includes a series of maps which model suitable elephant habitat, with recommended areas for further study where new protected areas could potentially be established. These maps enable visualization and analysis of spatial relationships, leading to the development of a ModelBuilder workflow. This model automates key geoprocessing tasks such as buffering, selection, and intersection, ultimately producing a detailed suitability map highlighting areas most favorable for elephant movement and conservation.
The analysis considers the location of existing protected areas, distribution of rainfall, locations of reported human elephant conflicts, travel distance from the Mara river, and areas of suitable elephant habitat to recommend locations for further study as potential new protected areas.
By integrating data management, spatial analysis, and cartographic design, the project demonstrates how GIS can support real-world conservation planning. The outputs provide clear insights into where habitat is most suitable, where risks of conflict are highest, and where strategic conservation action can be most effective.
Protected Areas
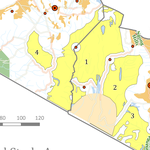
The Protected Areas Map serves as the foundational visualization for subsequent spatial analyses in the project, incorporating key geographic datasets related to protected areas, administrative boundaries, hydrology, and transportation infrastructure. The map includes several key data layers essential for the analysis. The ProtectedAreas layer outlines designated conservation zones such as national parks, forest reserves, and national reserves within the study area. The Narok_Kajiado layer defines the administrative boundaries of the two districts serving as the primary focus of the project. The Rivers layer represents major hydrological features across the region, while the Roads_WFP layer provides detailed information on the transportation network, based on classifications from the World Food Programme. Together, these layers form the geographic foundation for modeling potential elephant habitat zones.
Problem Elephants
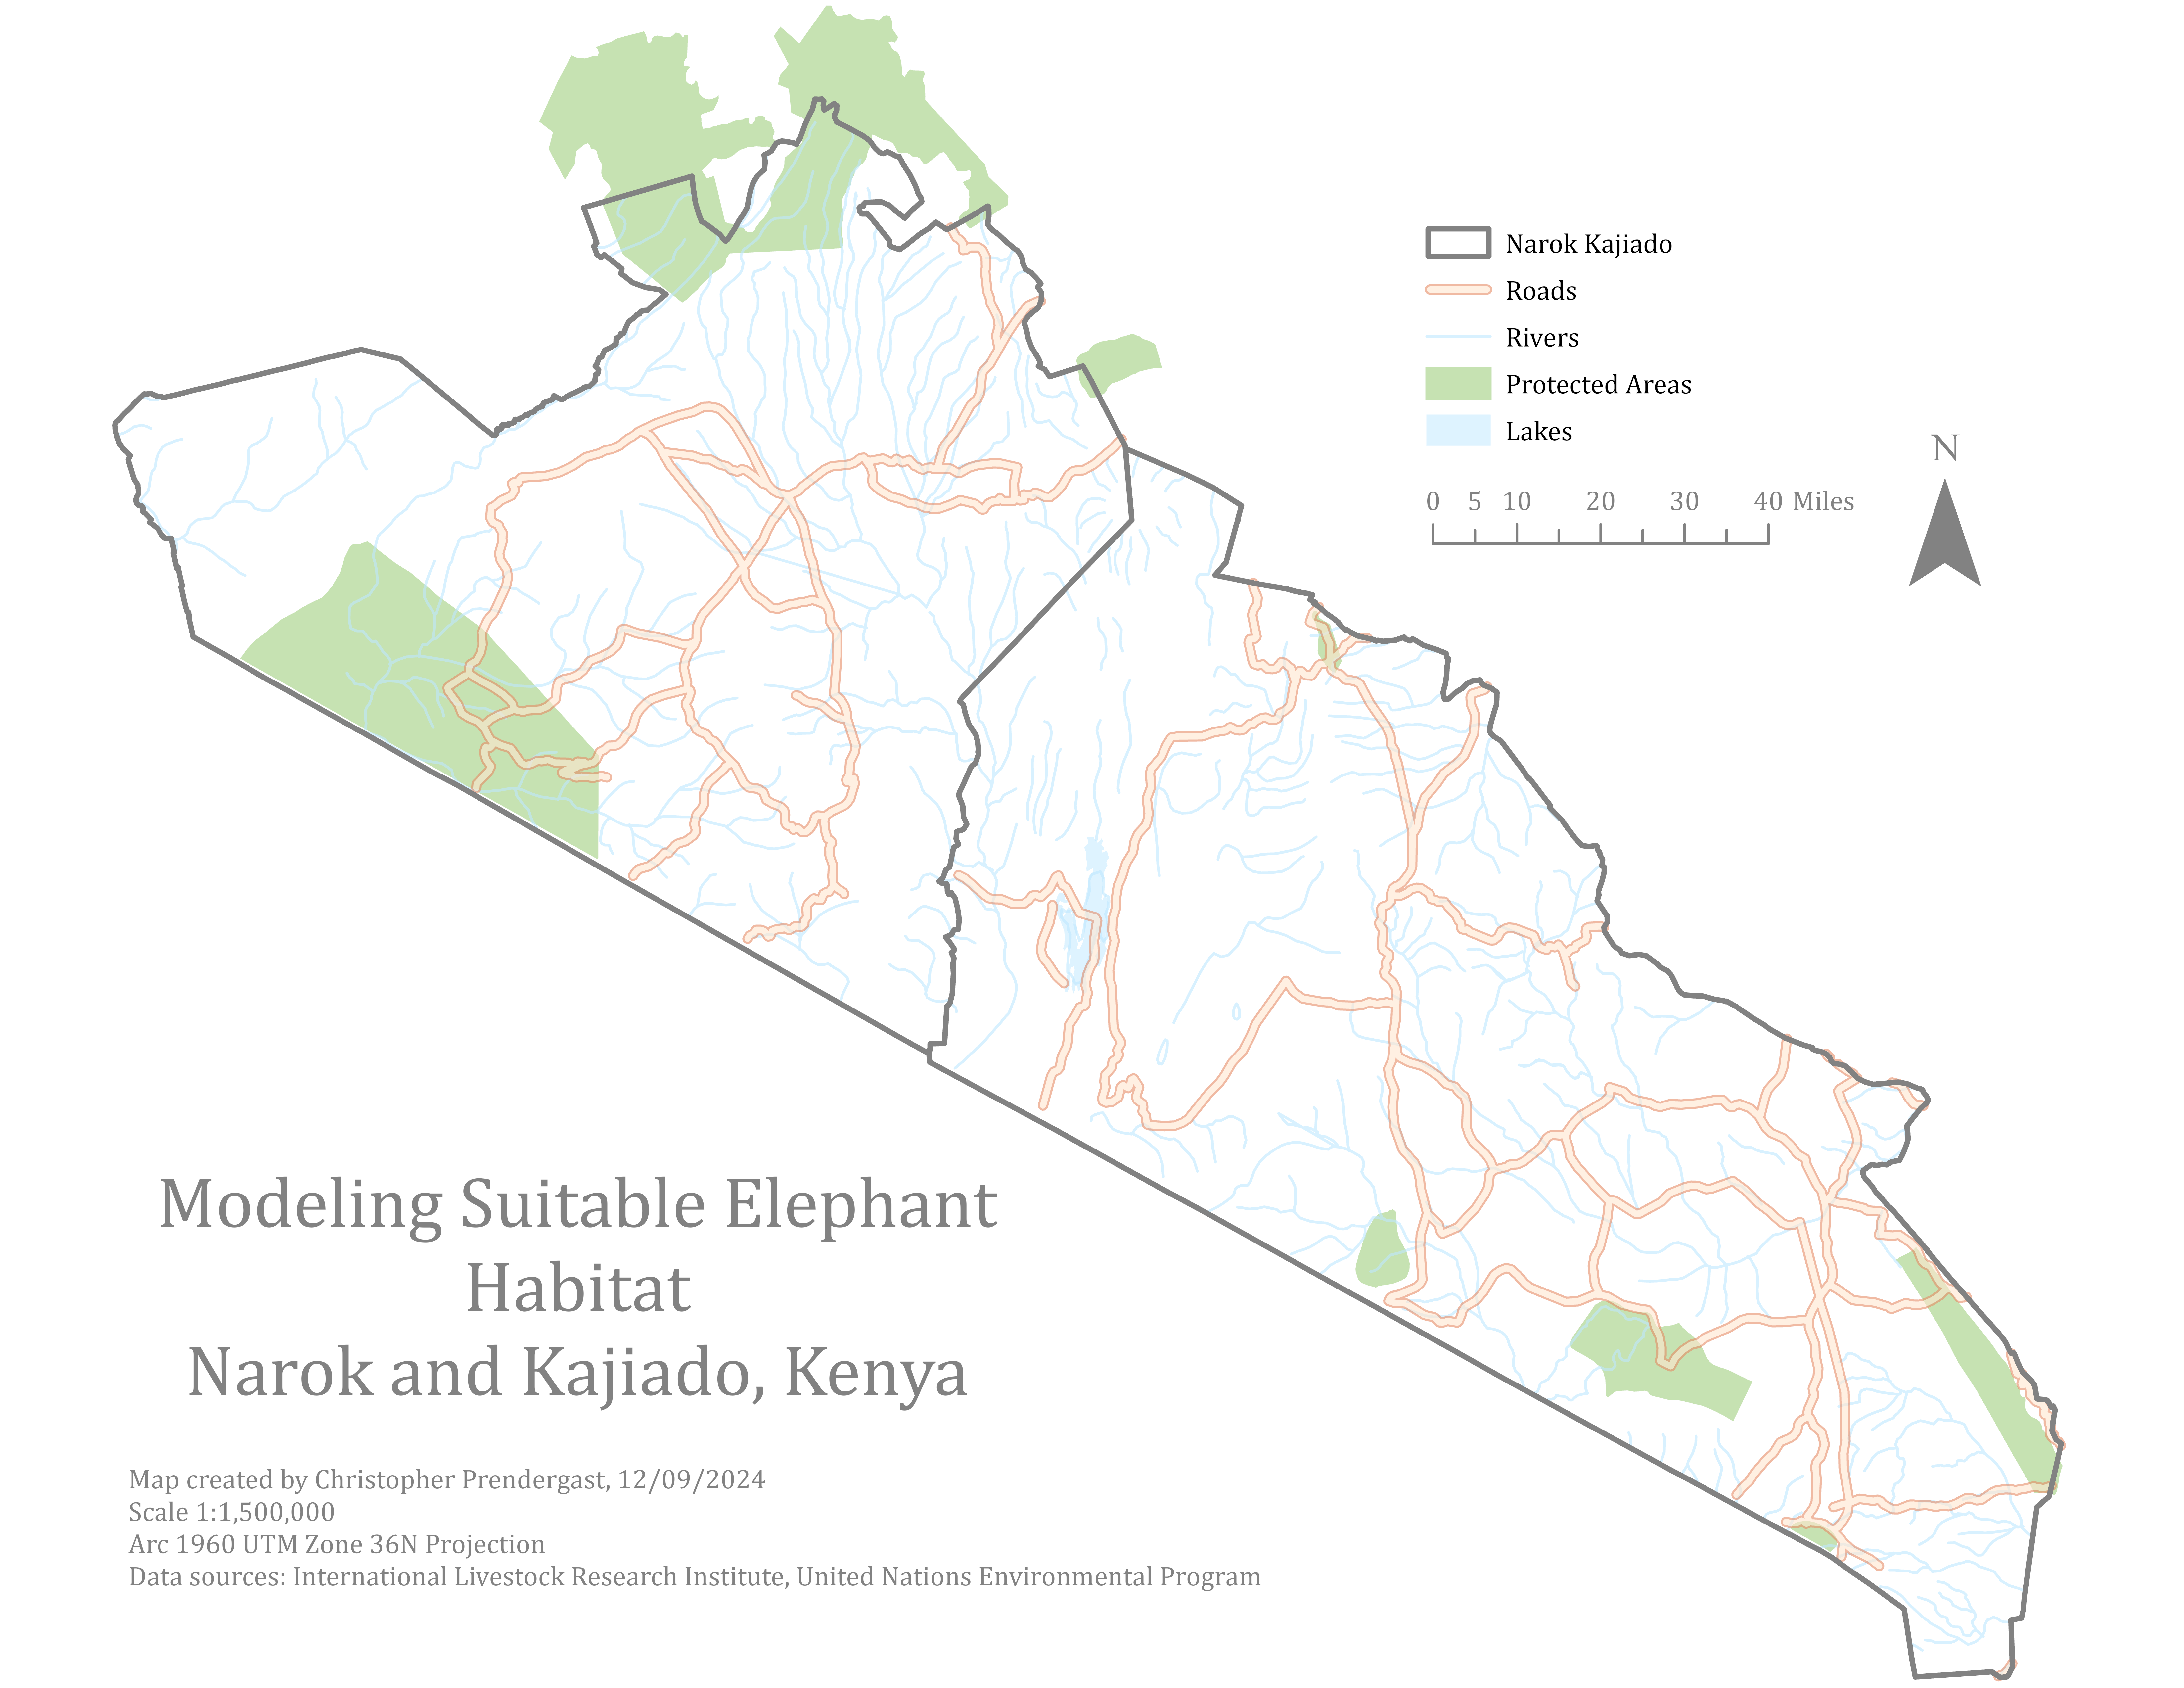
The Problem Elephants Map expands the Protected Areas Map to incorporate additional geographic context and newly created data relevant to modeling elephant habitat. This map builds on the foundational layout and includes the national boundary, capital city, and field-collected elephant conflict locations. The map introduces the Outside_boundary layer, which shows the national extent of Kenya and provides geographic reference for the location of the Narok and Kajiado districts within the country. The Nairobi layer is added and projected to match the map’s coordinate system, then symbolized and labeled to clearly mark Kenya's capital city. A new feature class, ProblemElephantsFC, is created from a table of latitude and longitude values representing observed instances of elephant-related conflict. These point features are projected, symbolized, and incorporated into the map to visualize human-elephant interaction sites. Overall, this map prepares the project for more detailed analysis by integrating key reference and incident data into the spatial framework.
Rainfall
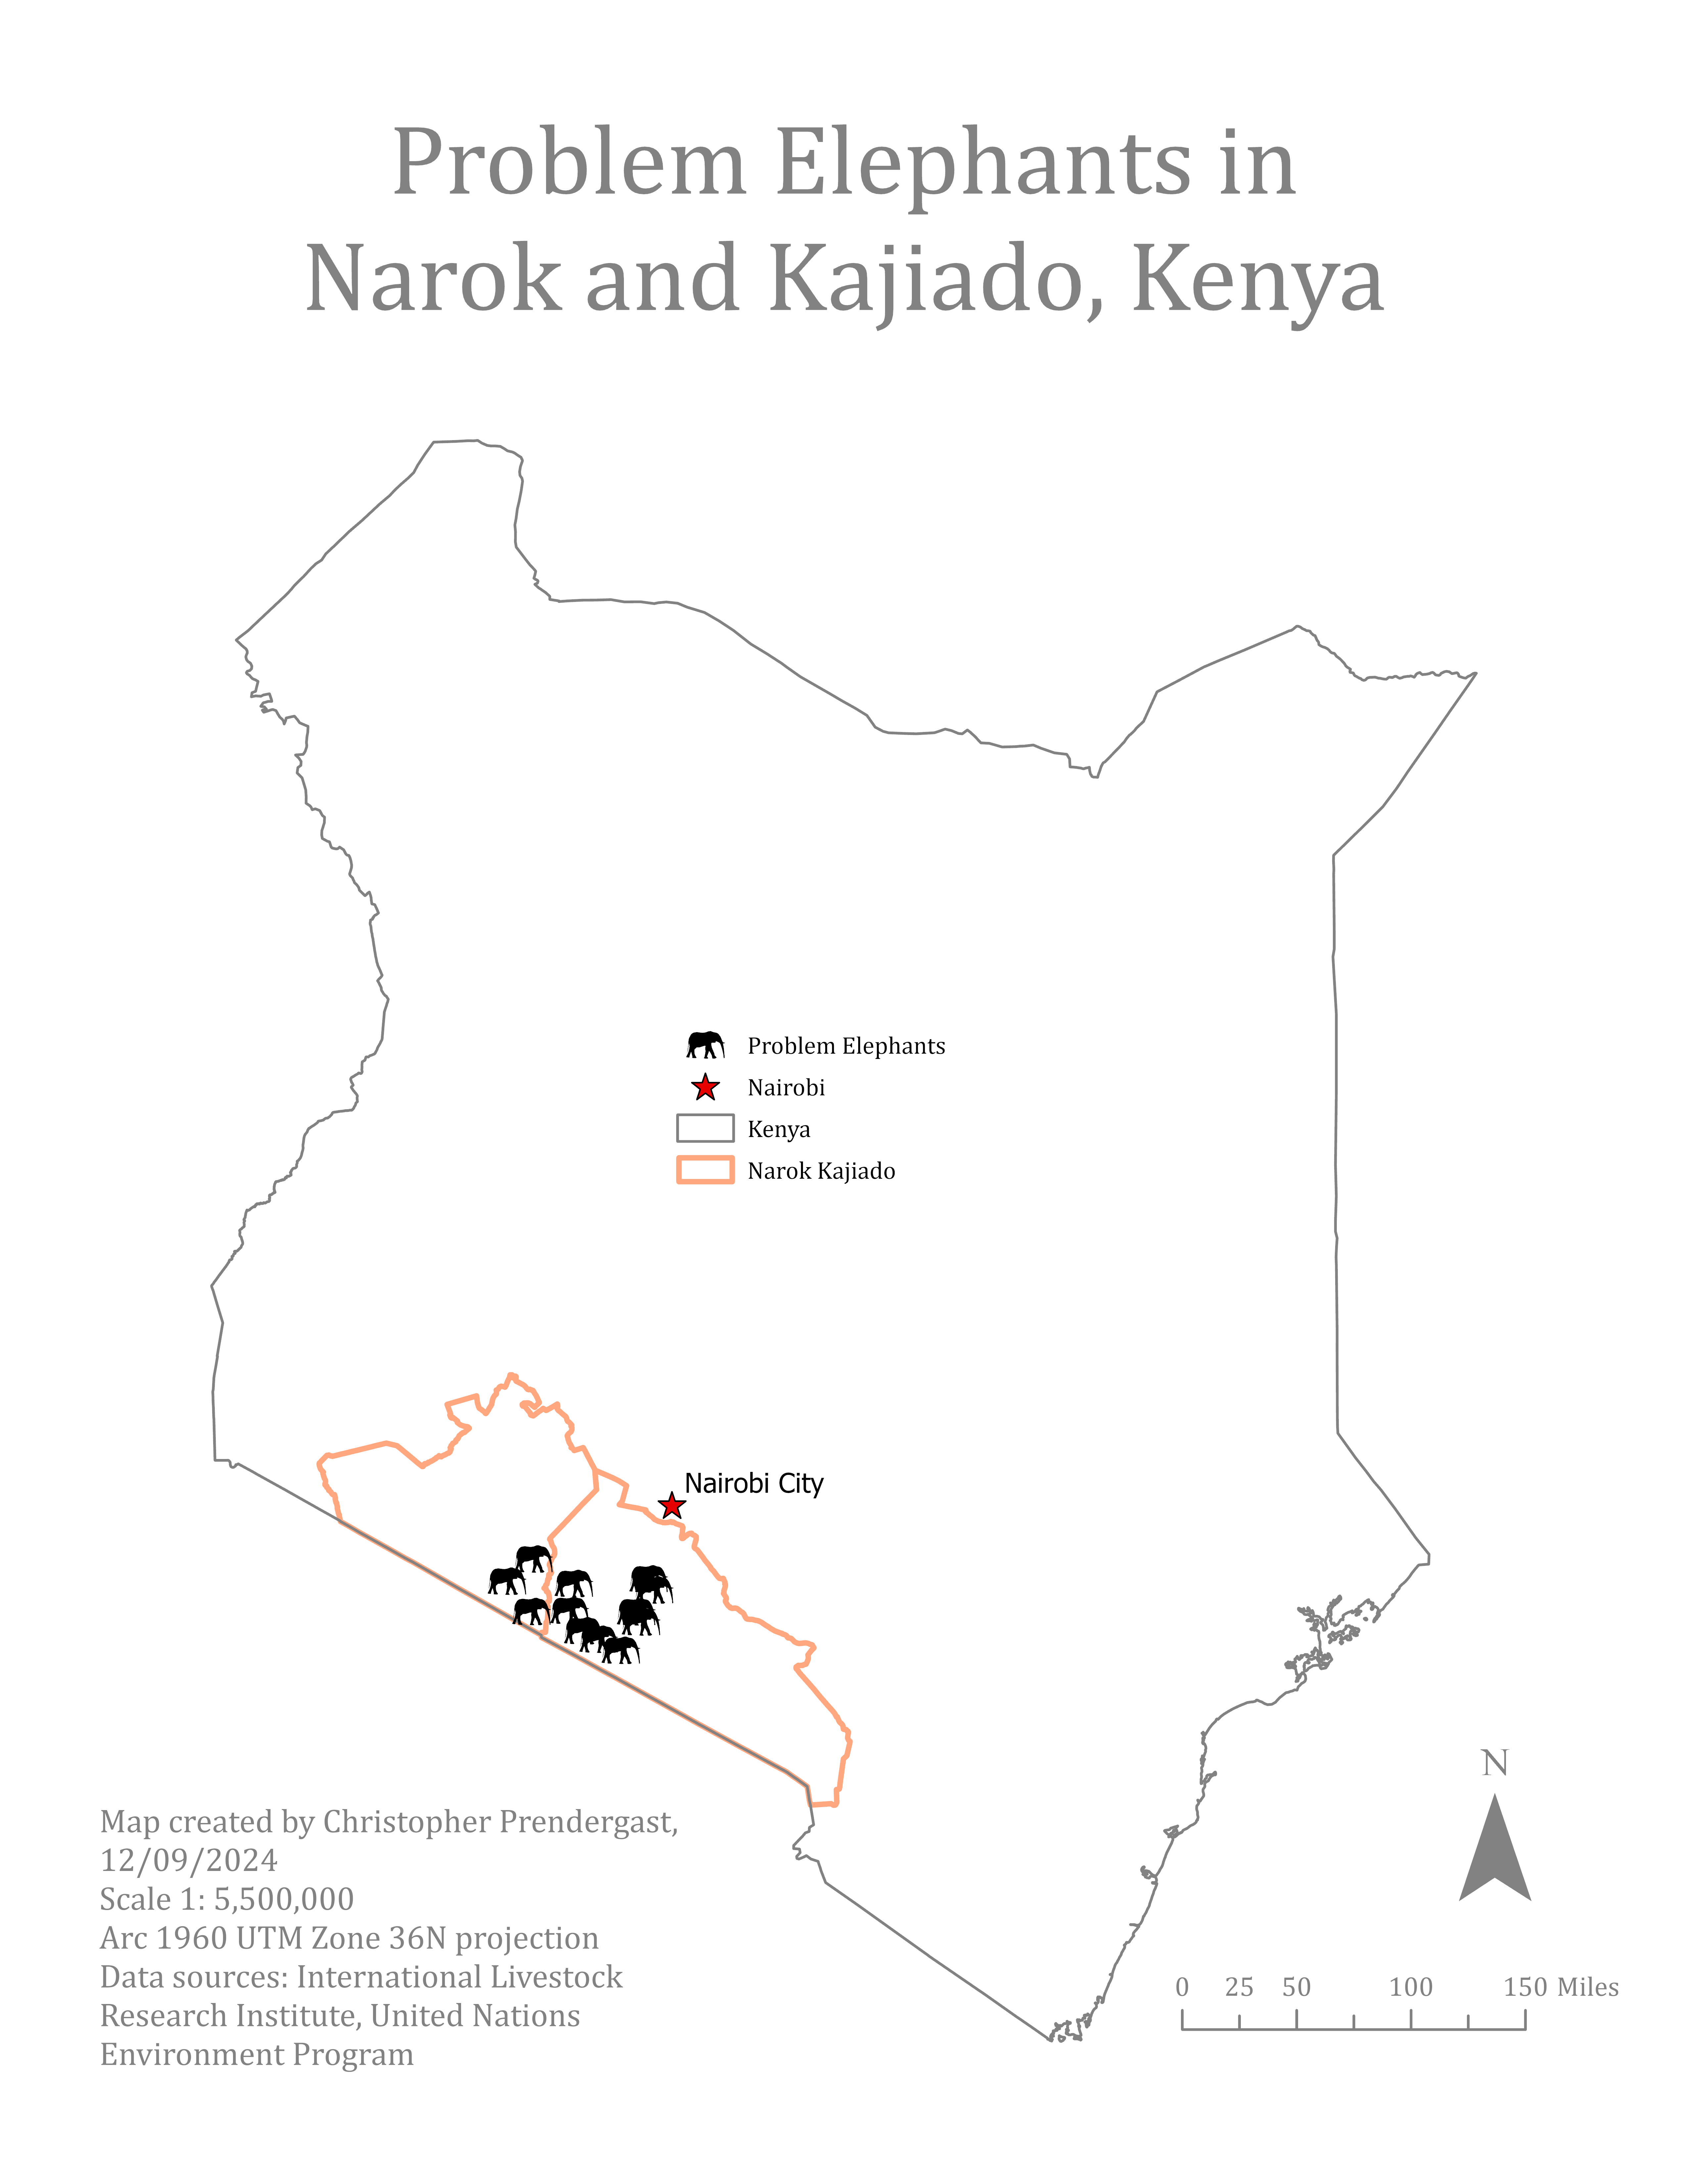
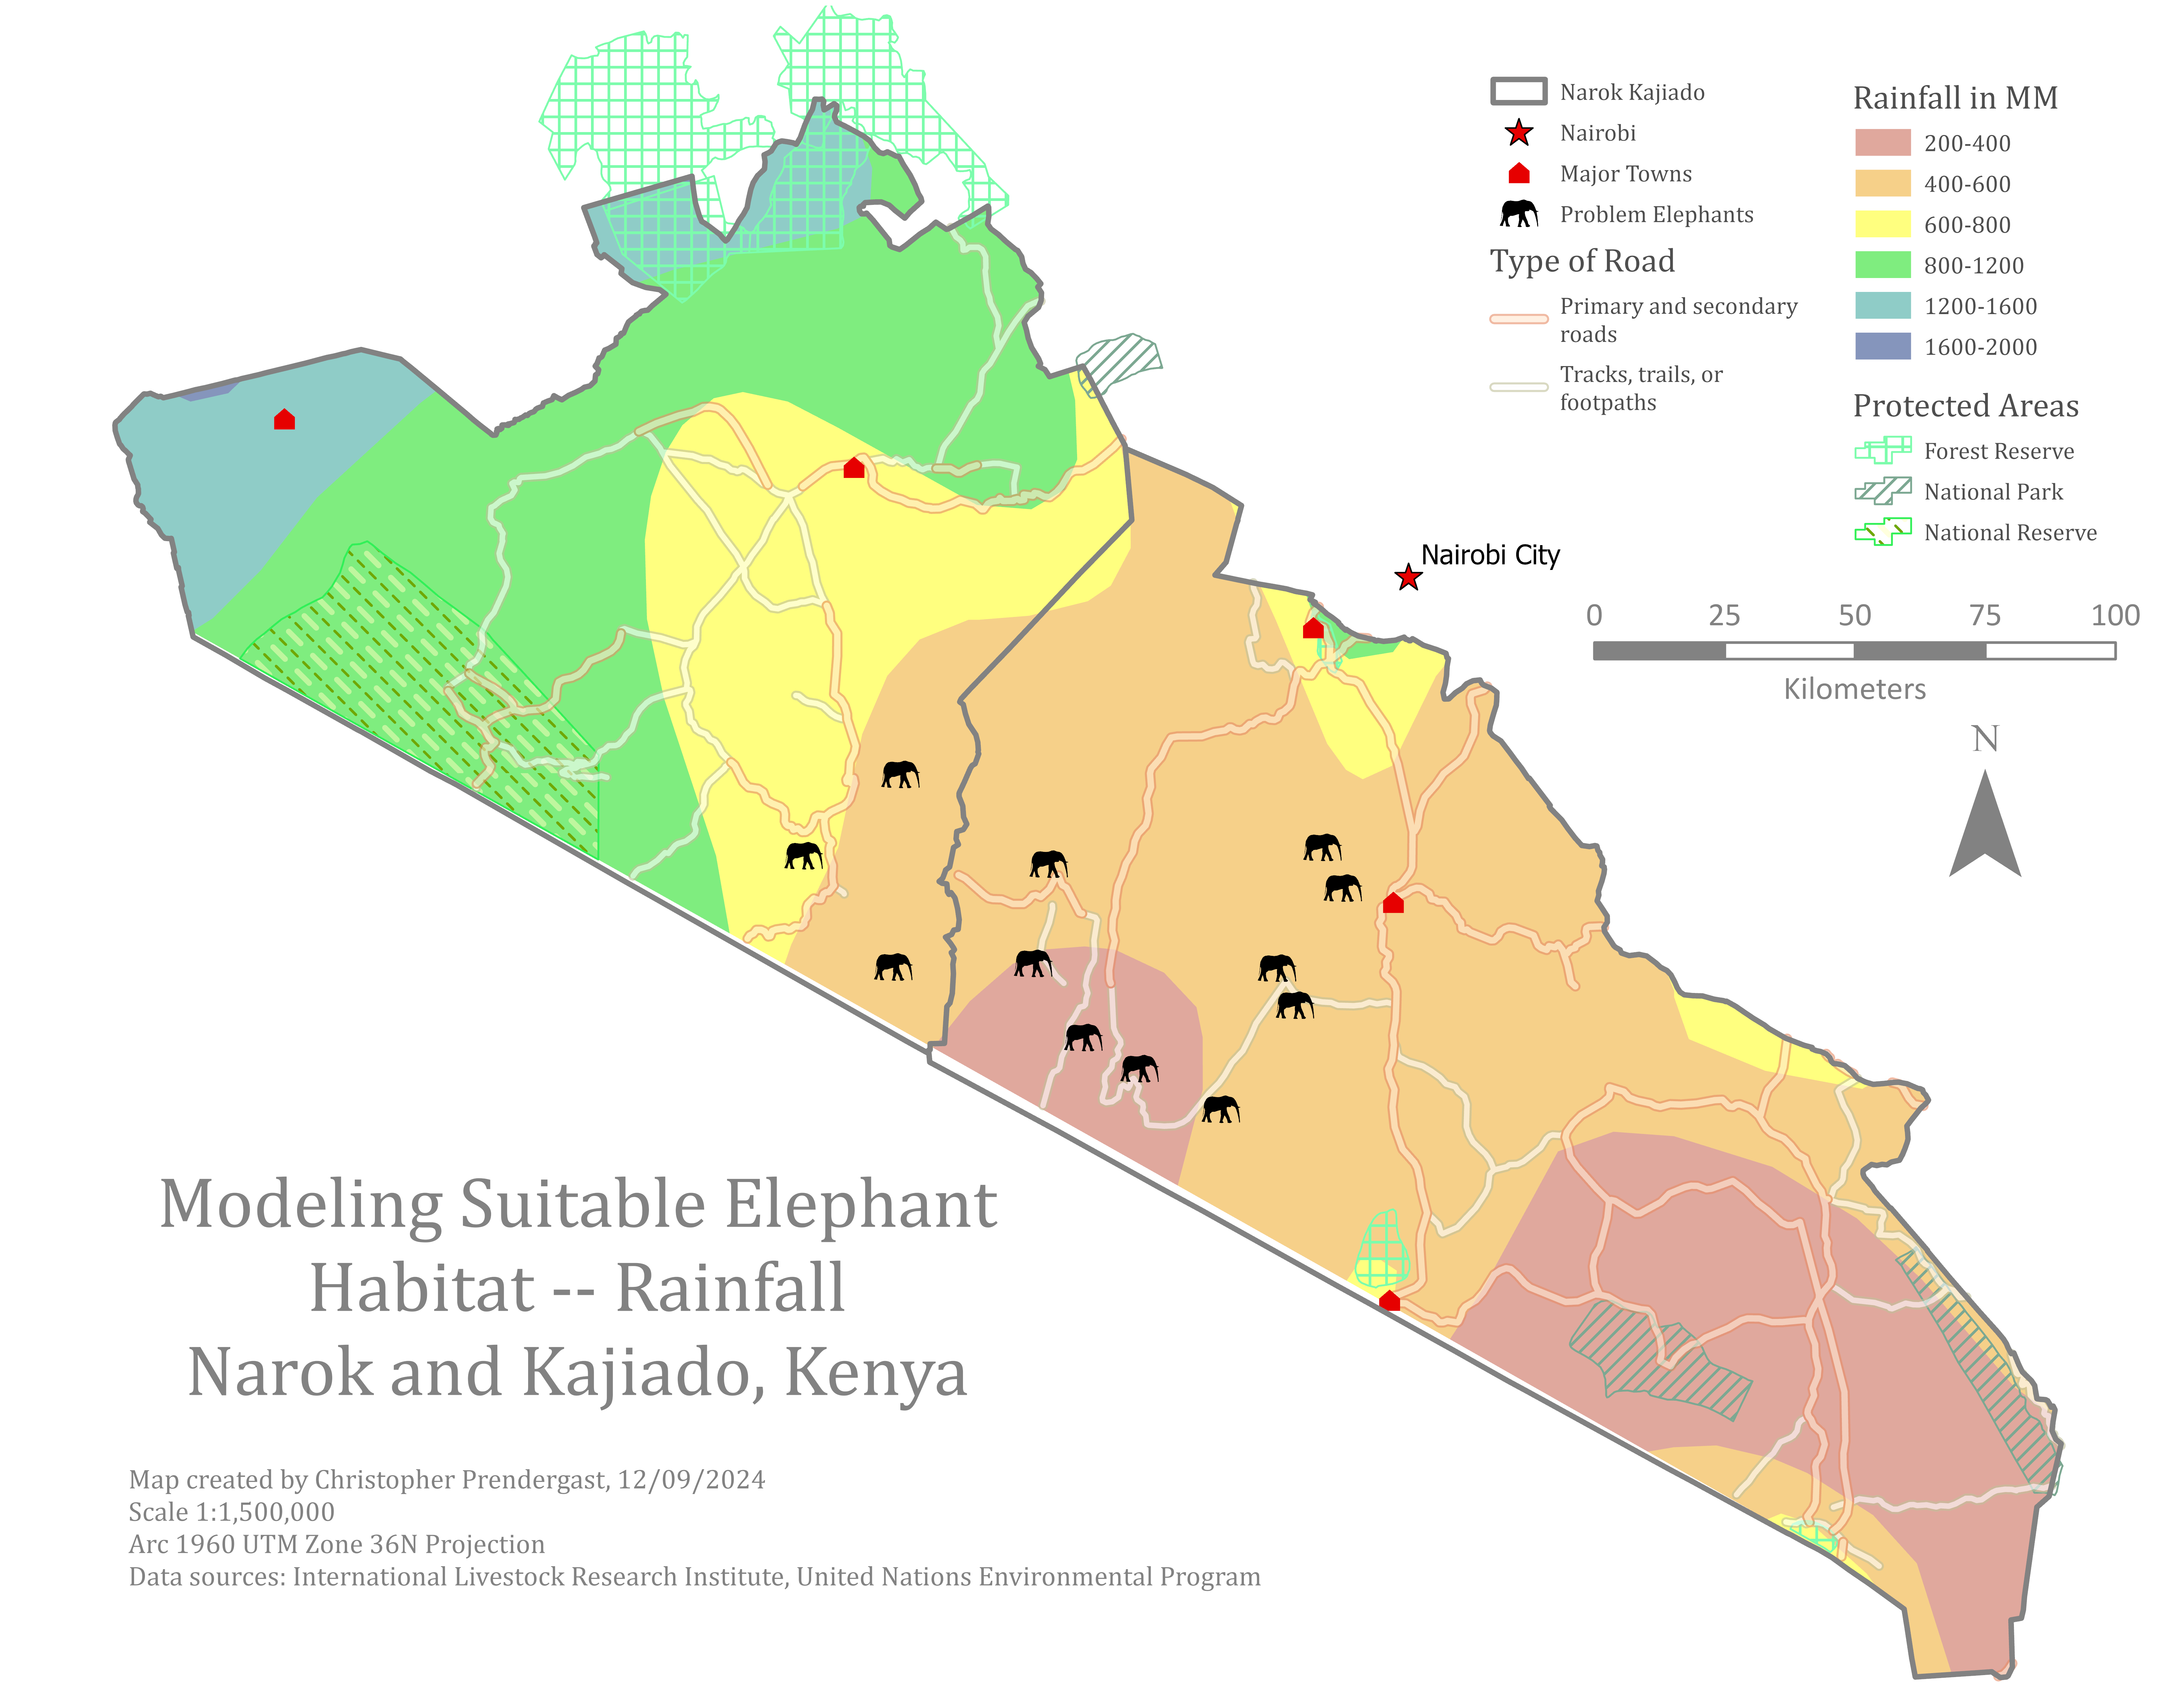
The Rainfall Map emphasizes the spatial distribution of rainfall as a key environmental factor in identifying suitable elephant habitat. The map integrates categorized precipitation data to highlight variations in annual rainfall, which can significantly influence vegetation patterns, water availability, and overall habitat quality for elephants.
The Rainfall layer is displayed using a precipitation-themed color ramp and categorized by ranges such as “200–400 mm” to “1600–2000 mm.” Although the data values are stored as text, the unique value symbology method is used to visually differentiate rainfall zones. The categories are arranged in ascending order to clearly show the transition from low to high rainfall areas. To ensure the rainfall patterns remain prominent while still allowing visibility of other features, the layer is set to 50% transparency and positioned below key thematic layers.
In addition to rainfall, the map includes layers for ProtectedAreas, Narok_Kajiado boundaries, Roads_WFP, Major_Towns, Nairobi, and ProblemElephantsFC. Each of these layers is symbolized to maintain visual clarity while supporting the map’s central focus on rainfall. By combining environmental and human-related data with rainfall distribution, the map provides a comprehensive view of the region's spatial dynamics, forming a strong foundation for subsequent habitat suitability analysis.
Breakout from Mara River
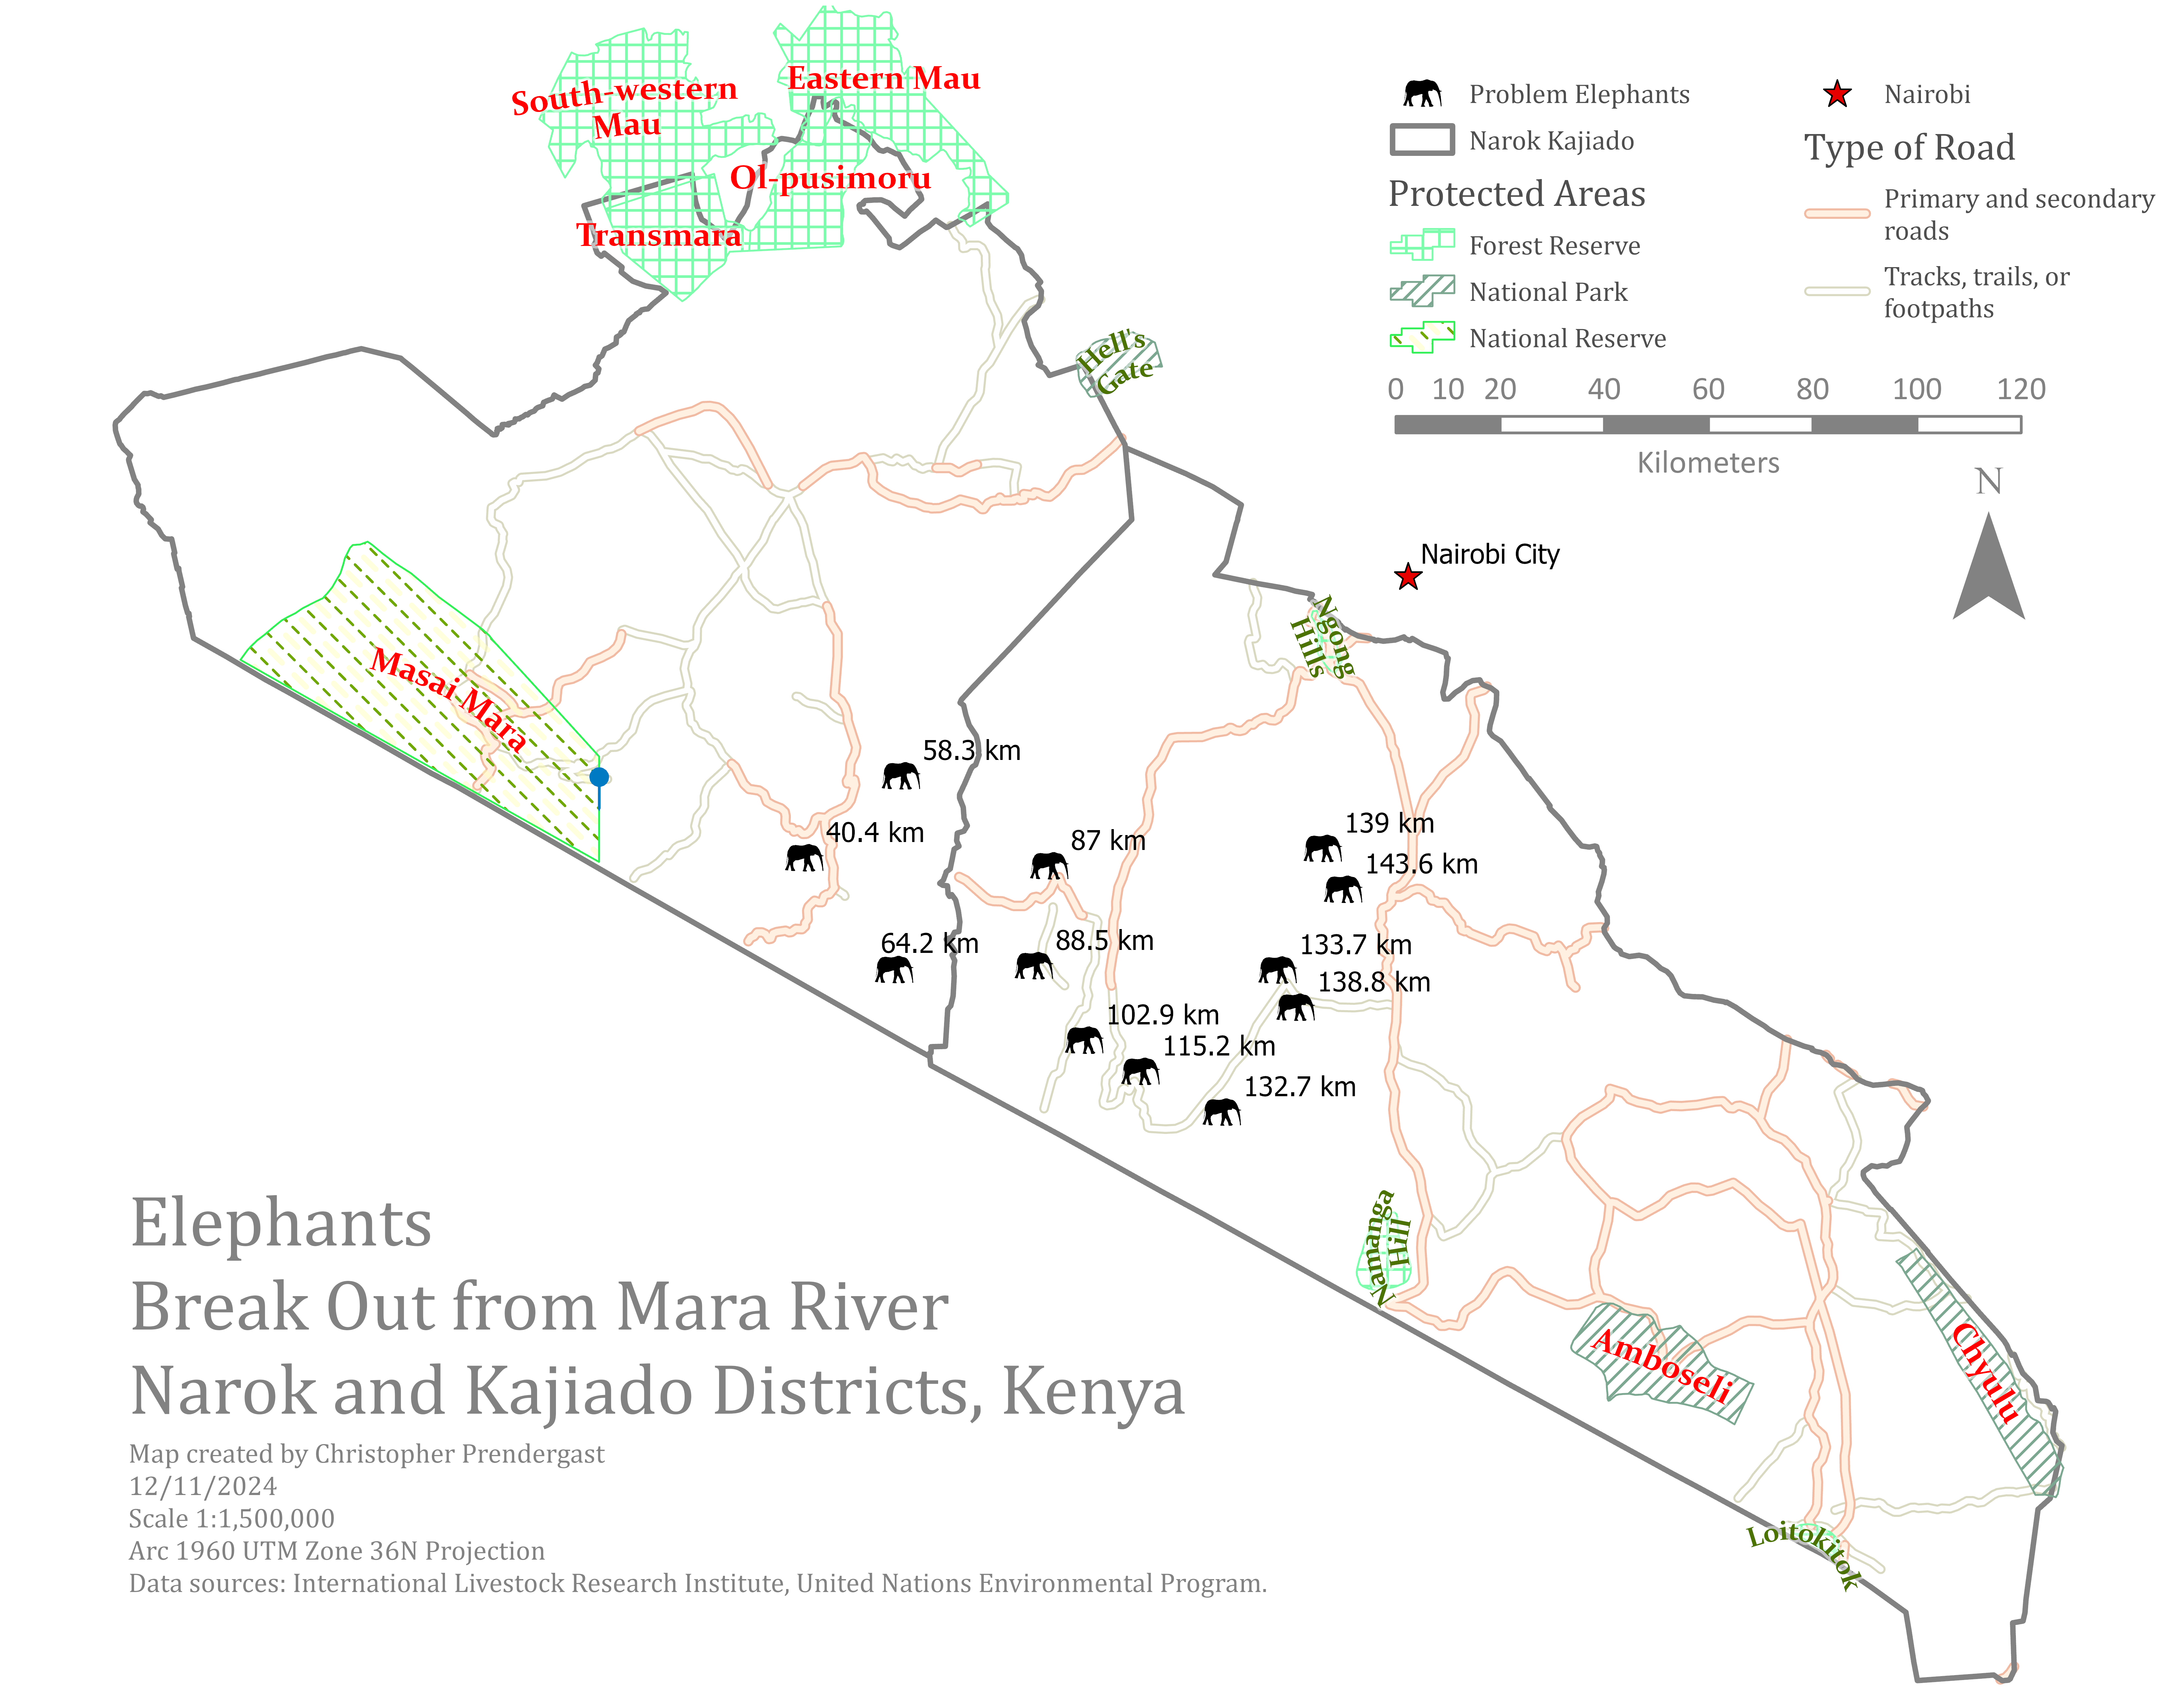
The Breakout from Mara River Map highlights the Mara region within Narok District, with a specific focus on areas where elephants are likely to move outside the Maasai Mara National Reserve—a phenomenon referred to as the “Mara breakout.” The map is designed to support analysis of elephant movement patterns beyond protected boundaries and into surrounding landscapes, where human-elephant conflict is more likely to occur.
At the center of the map is the Maasai Mara National Reserve, prominently located in southwestern Narok. This protected area is symbolized to distinguish it from adjacent reserves and land uses. Surrounding the reserve are several key spatial layers that contextualize the breakout dynamics:
-
ProblemElephantsFC shows recorded locations of human-elephant conflict, many of which appear clustered outside the reserve’s formal boundaries, indicating zones where elephants are leaving protected lands.
-
Roads_WFP and Nairobi layers provide infrastructure and settlement context, illustrating potential barriers or corridors to elephant movement.
-
Narok_Kajiado district boundaries and the ProtectedAreas layer help frame jurisdictional and conservation zones.
Labels are applied to key features—including protected area names, major towns, and the Maasai Mara itself—to aid interpretation. The focus on the Mara breakout area transforms this map from a general regional overview into a targeted analytical tool for identifying high-risk zones where conservation planning and human-wildlife conflict mitigation efforts may be needed most.
Human Elephant Conflicts
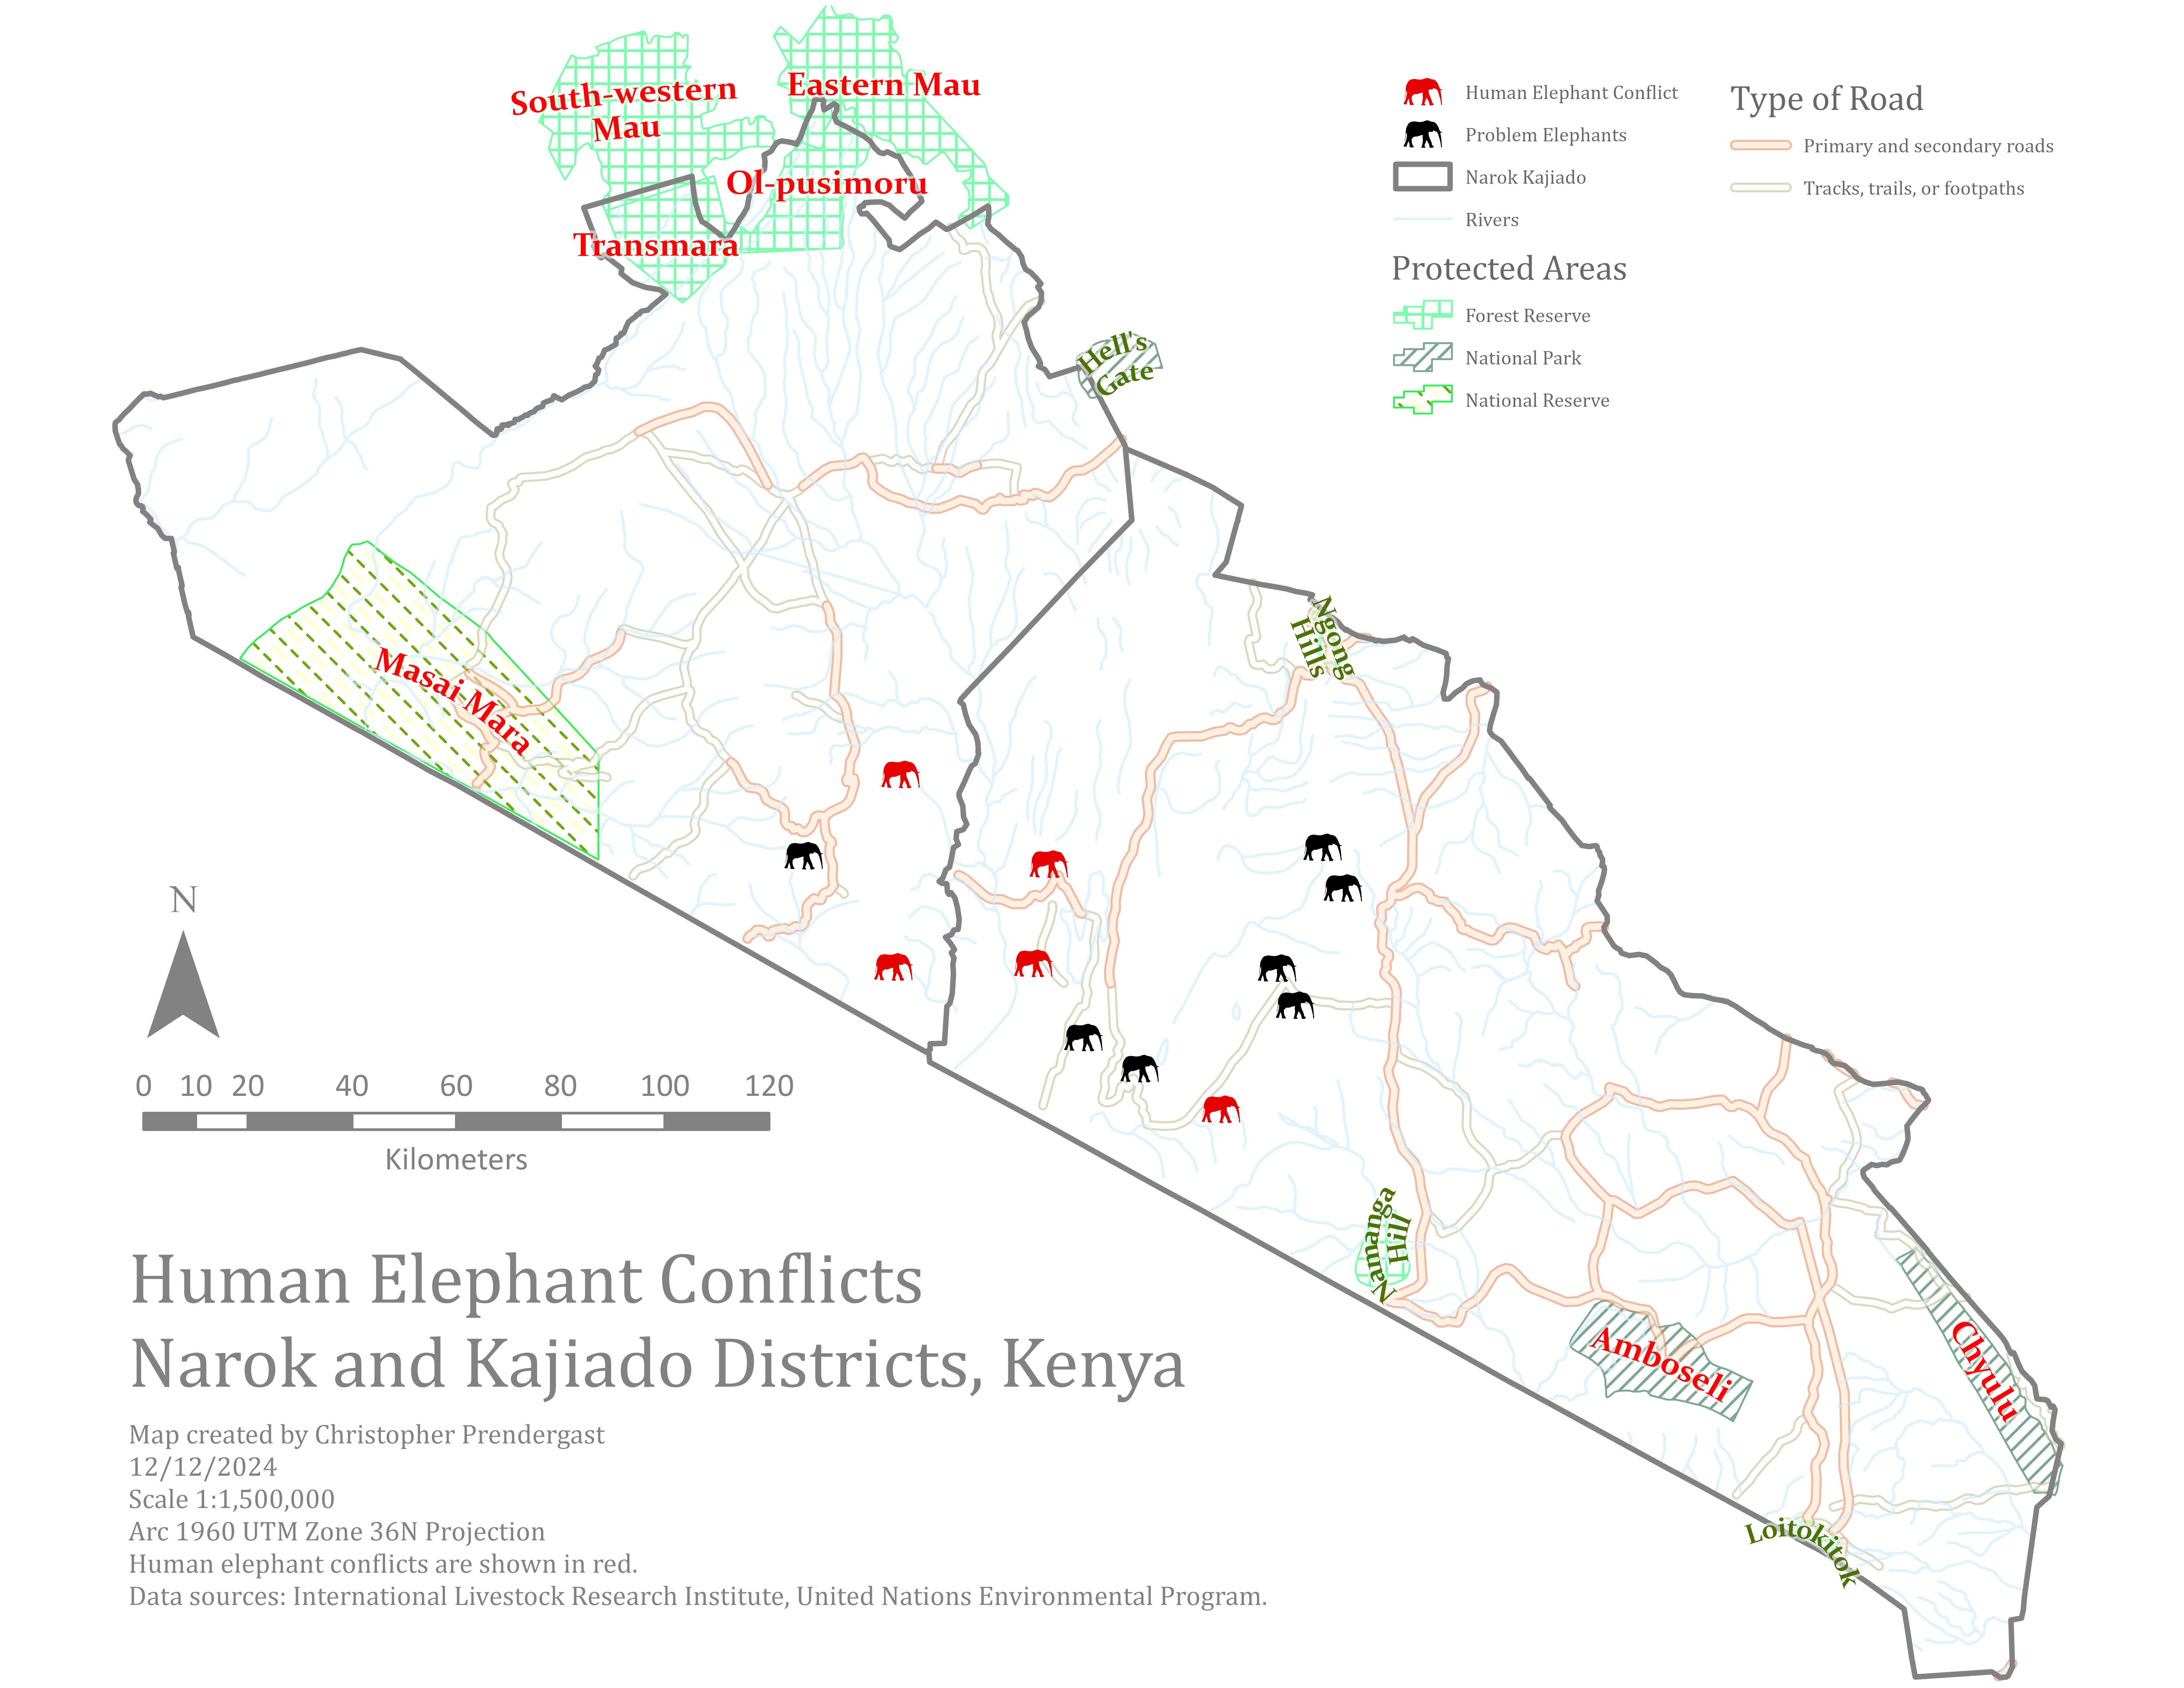
The Human Elephant Conflicts Map centers on visualizing human-elephant conflict (HEC) locations in relation to key environmental and infrastructure features. The primary focus is to organize and prepare the map for future analytical work by saving symbology and layout configurations that clearly highlight areas of conflict between human settlements and elephant movements.
At the heart of the map is the ProblemElephantsFC layer, which displays geolocated incidents of human-elephant conflict. These points represent events such as crop raiding, fence destruction, and other forms of human-wildlife interaction. The spatial distribution of these incidents—particularly those occurring outside protected areas like the Masai Mara National Reserve—offers critical insights into where elephants are leaving conservation zones and entering human-dominated landscapes.
Supporting layers include ProtectedAreas, Roads_WFP, and Narok_Kajiado. These features provide essential context: roads and rivers suggest potential barriers or corridors; administrative boundaries help define jurisdiction; and protected areas indicate zones where conflict is expected to be lower.
Problem Elephants with Land Cover
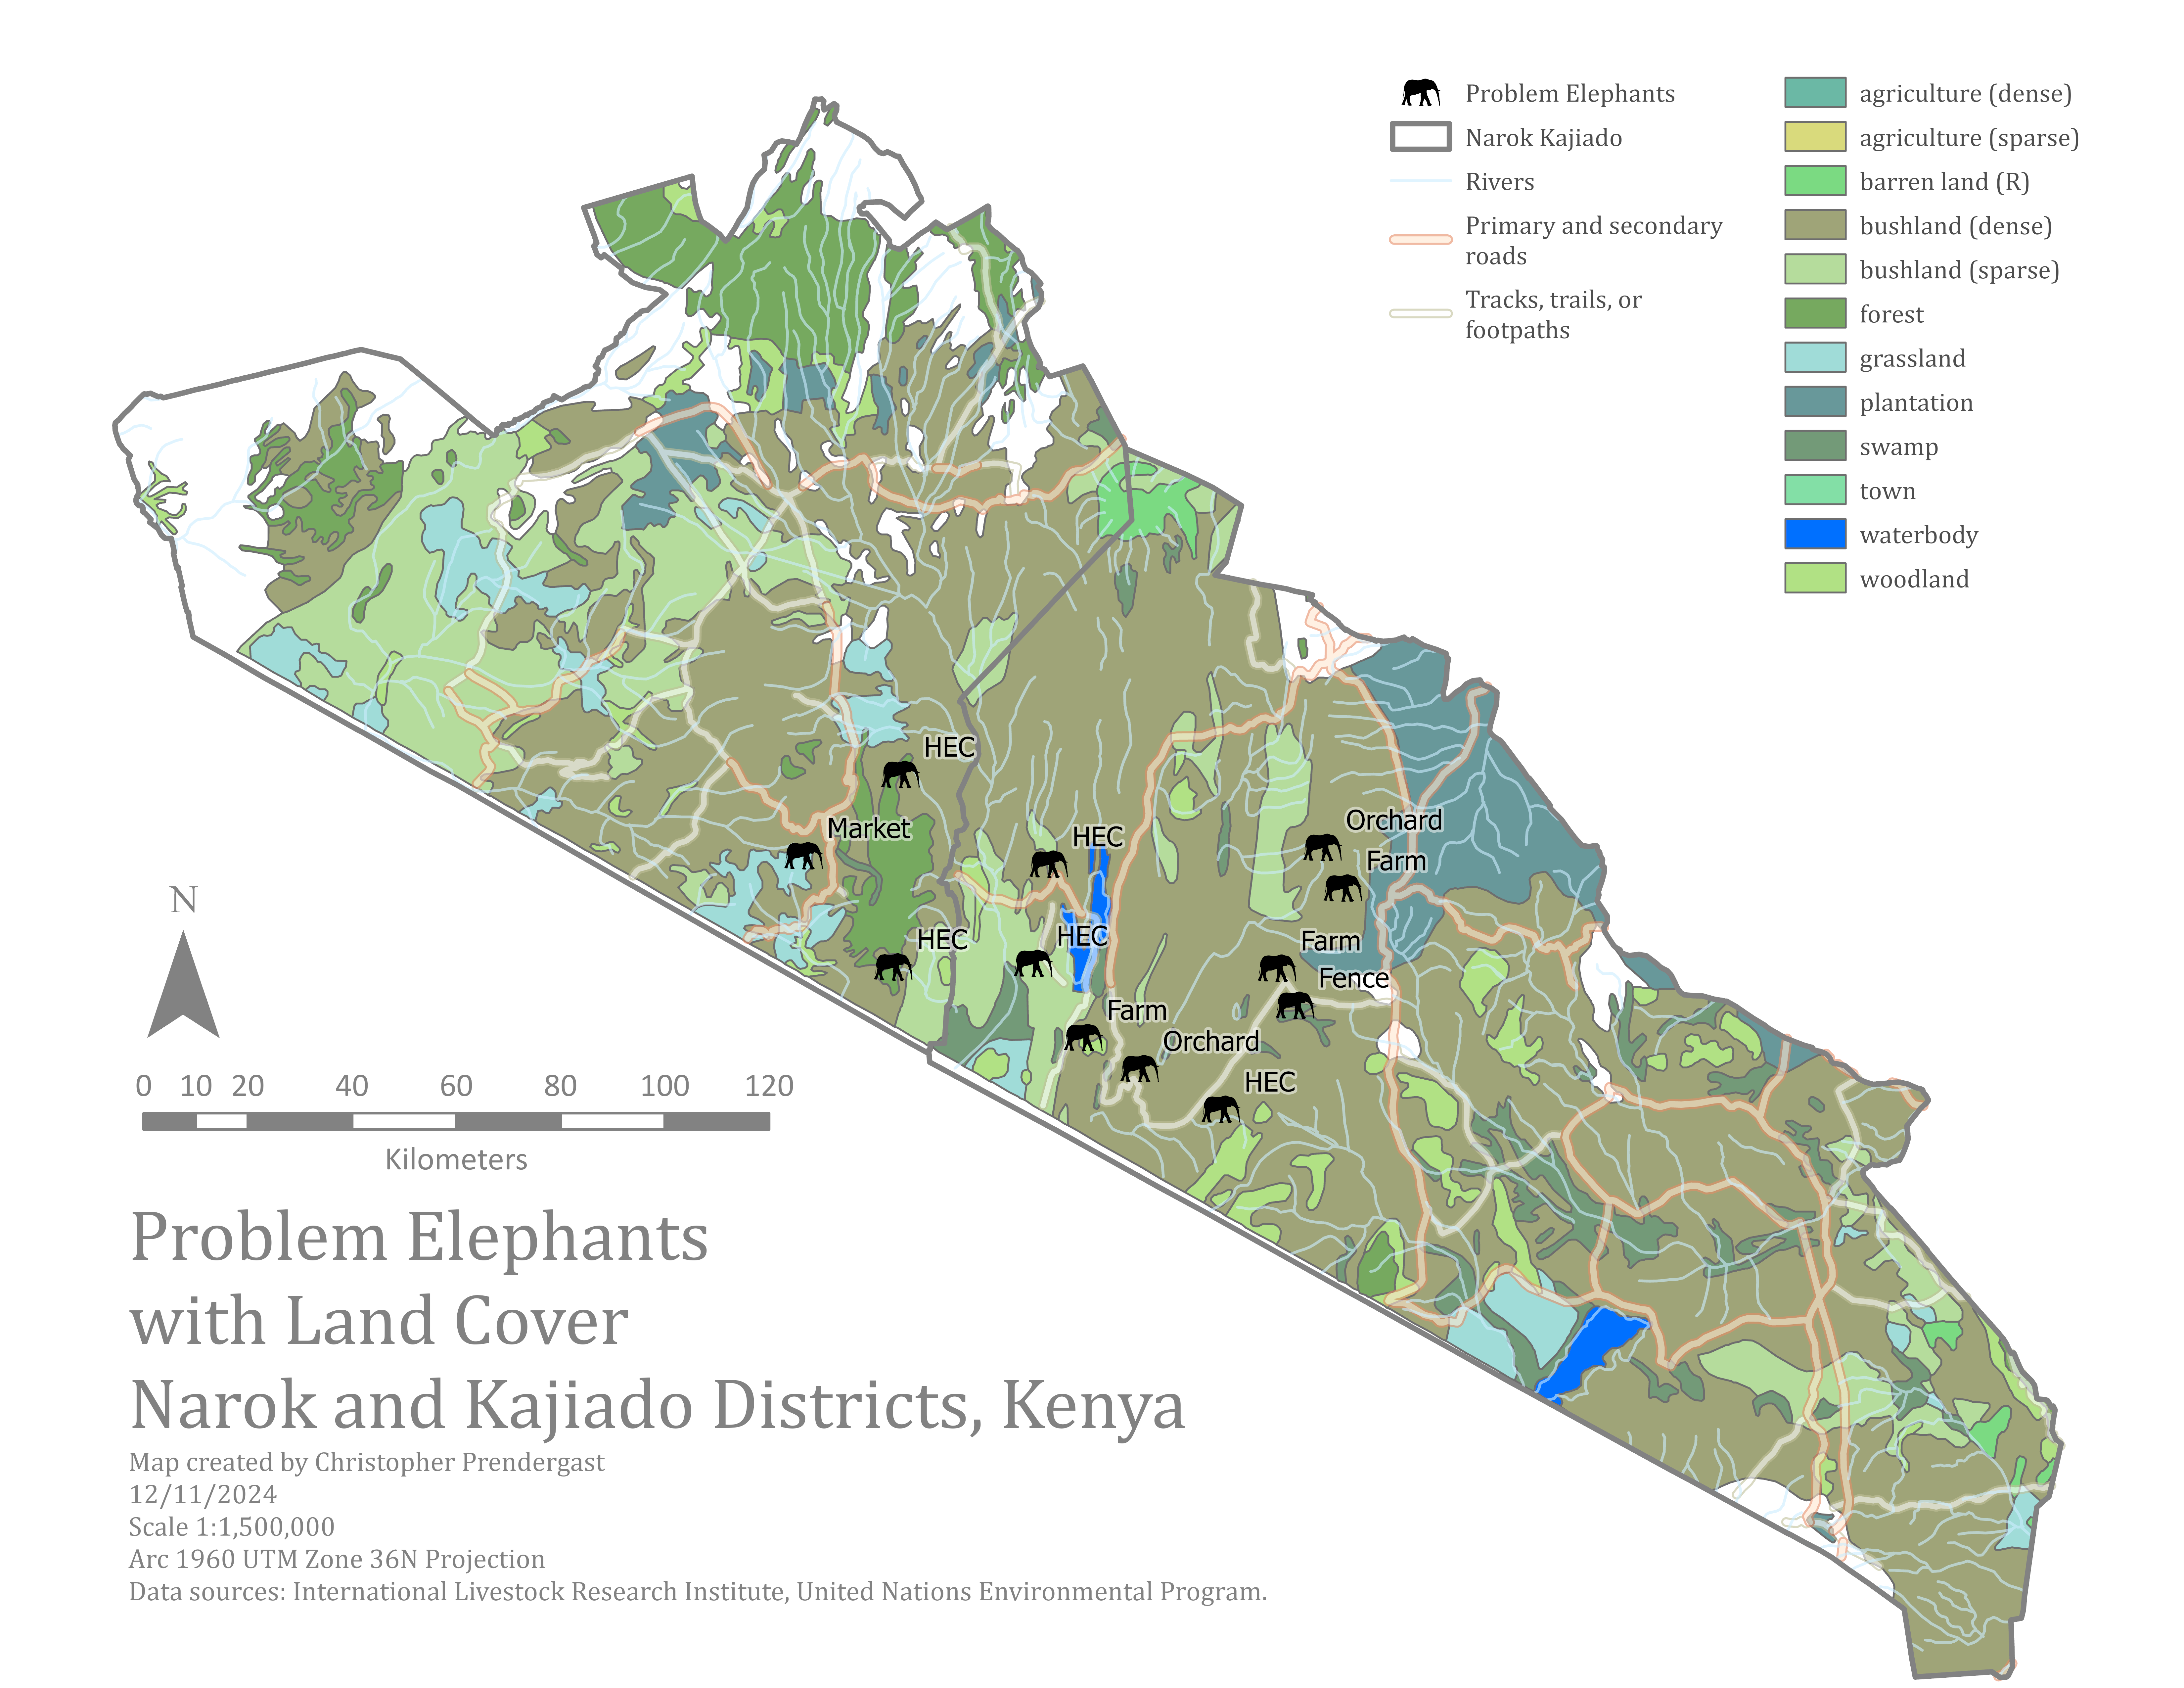
The Problem Elephants with Land Cover Map explores the relationship between land use patterns and different types of human-elephant conflict (HEC). It is designed to visually and analytically link where conflicts occur with the kind of land they affect—providing valuable insight into how land cover and human activity influence elephant movement and conflict zones.
Central to the map is the ProblemElephantsFC layer, a set of point features representing recorded elephant conflict incidents. Each point contains attribute data describing the type of conflict, such as:
- HEC (general human-elephant conflict),
- Farm (crop damage or field intrusion),
- Fence (infrastructure destruction),
- and other site-specific issues.
These incidents are labeled by type, making it easier to distinguish the nature of conflicts across the landscape. For example, farming-related conflicts may cluster near agricultural zones, while fence-related incidents might occur at park boundaries or near settlement edges.
Overlaying this layer is the LandUse data, which provides detailed classification of the landscape (e.g., forest, bushland, grassland, agriculture). This layer enables spatial comparison between land cover types and conflict locations, revealing how elephants interact with different human-altered environments. In particular, the map helps identify whether agricultural areas are more prone to conflict, and whether certain land use categories appear to attract or deter elephant activity.
Additional contextual layers—such as Roads_WFP and Narok_Kajiado boundaries—support interpretation by providing infrastructure and jurisdictional context.
This map serves as a foundational tool for understanding how land use influences the type and frequency of human-elephant conflict, and it informs more targeted recommendations for land management and conflict mitigation in affected communities.
Suitable Elephant Habitat
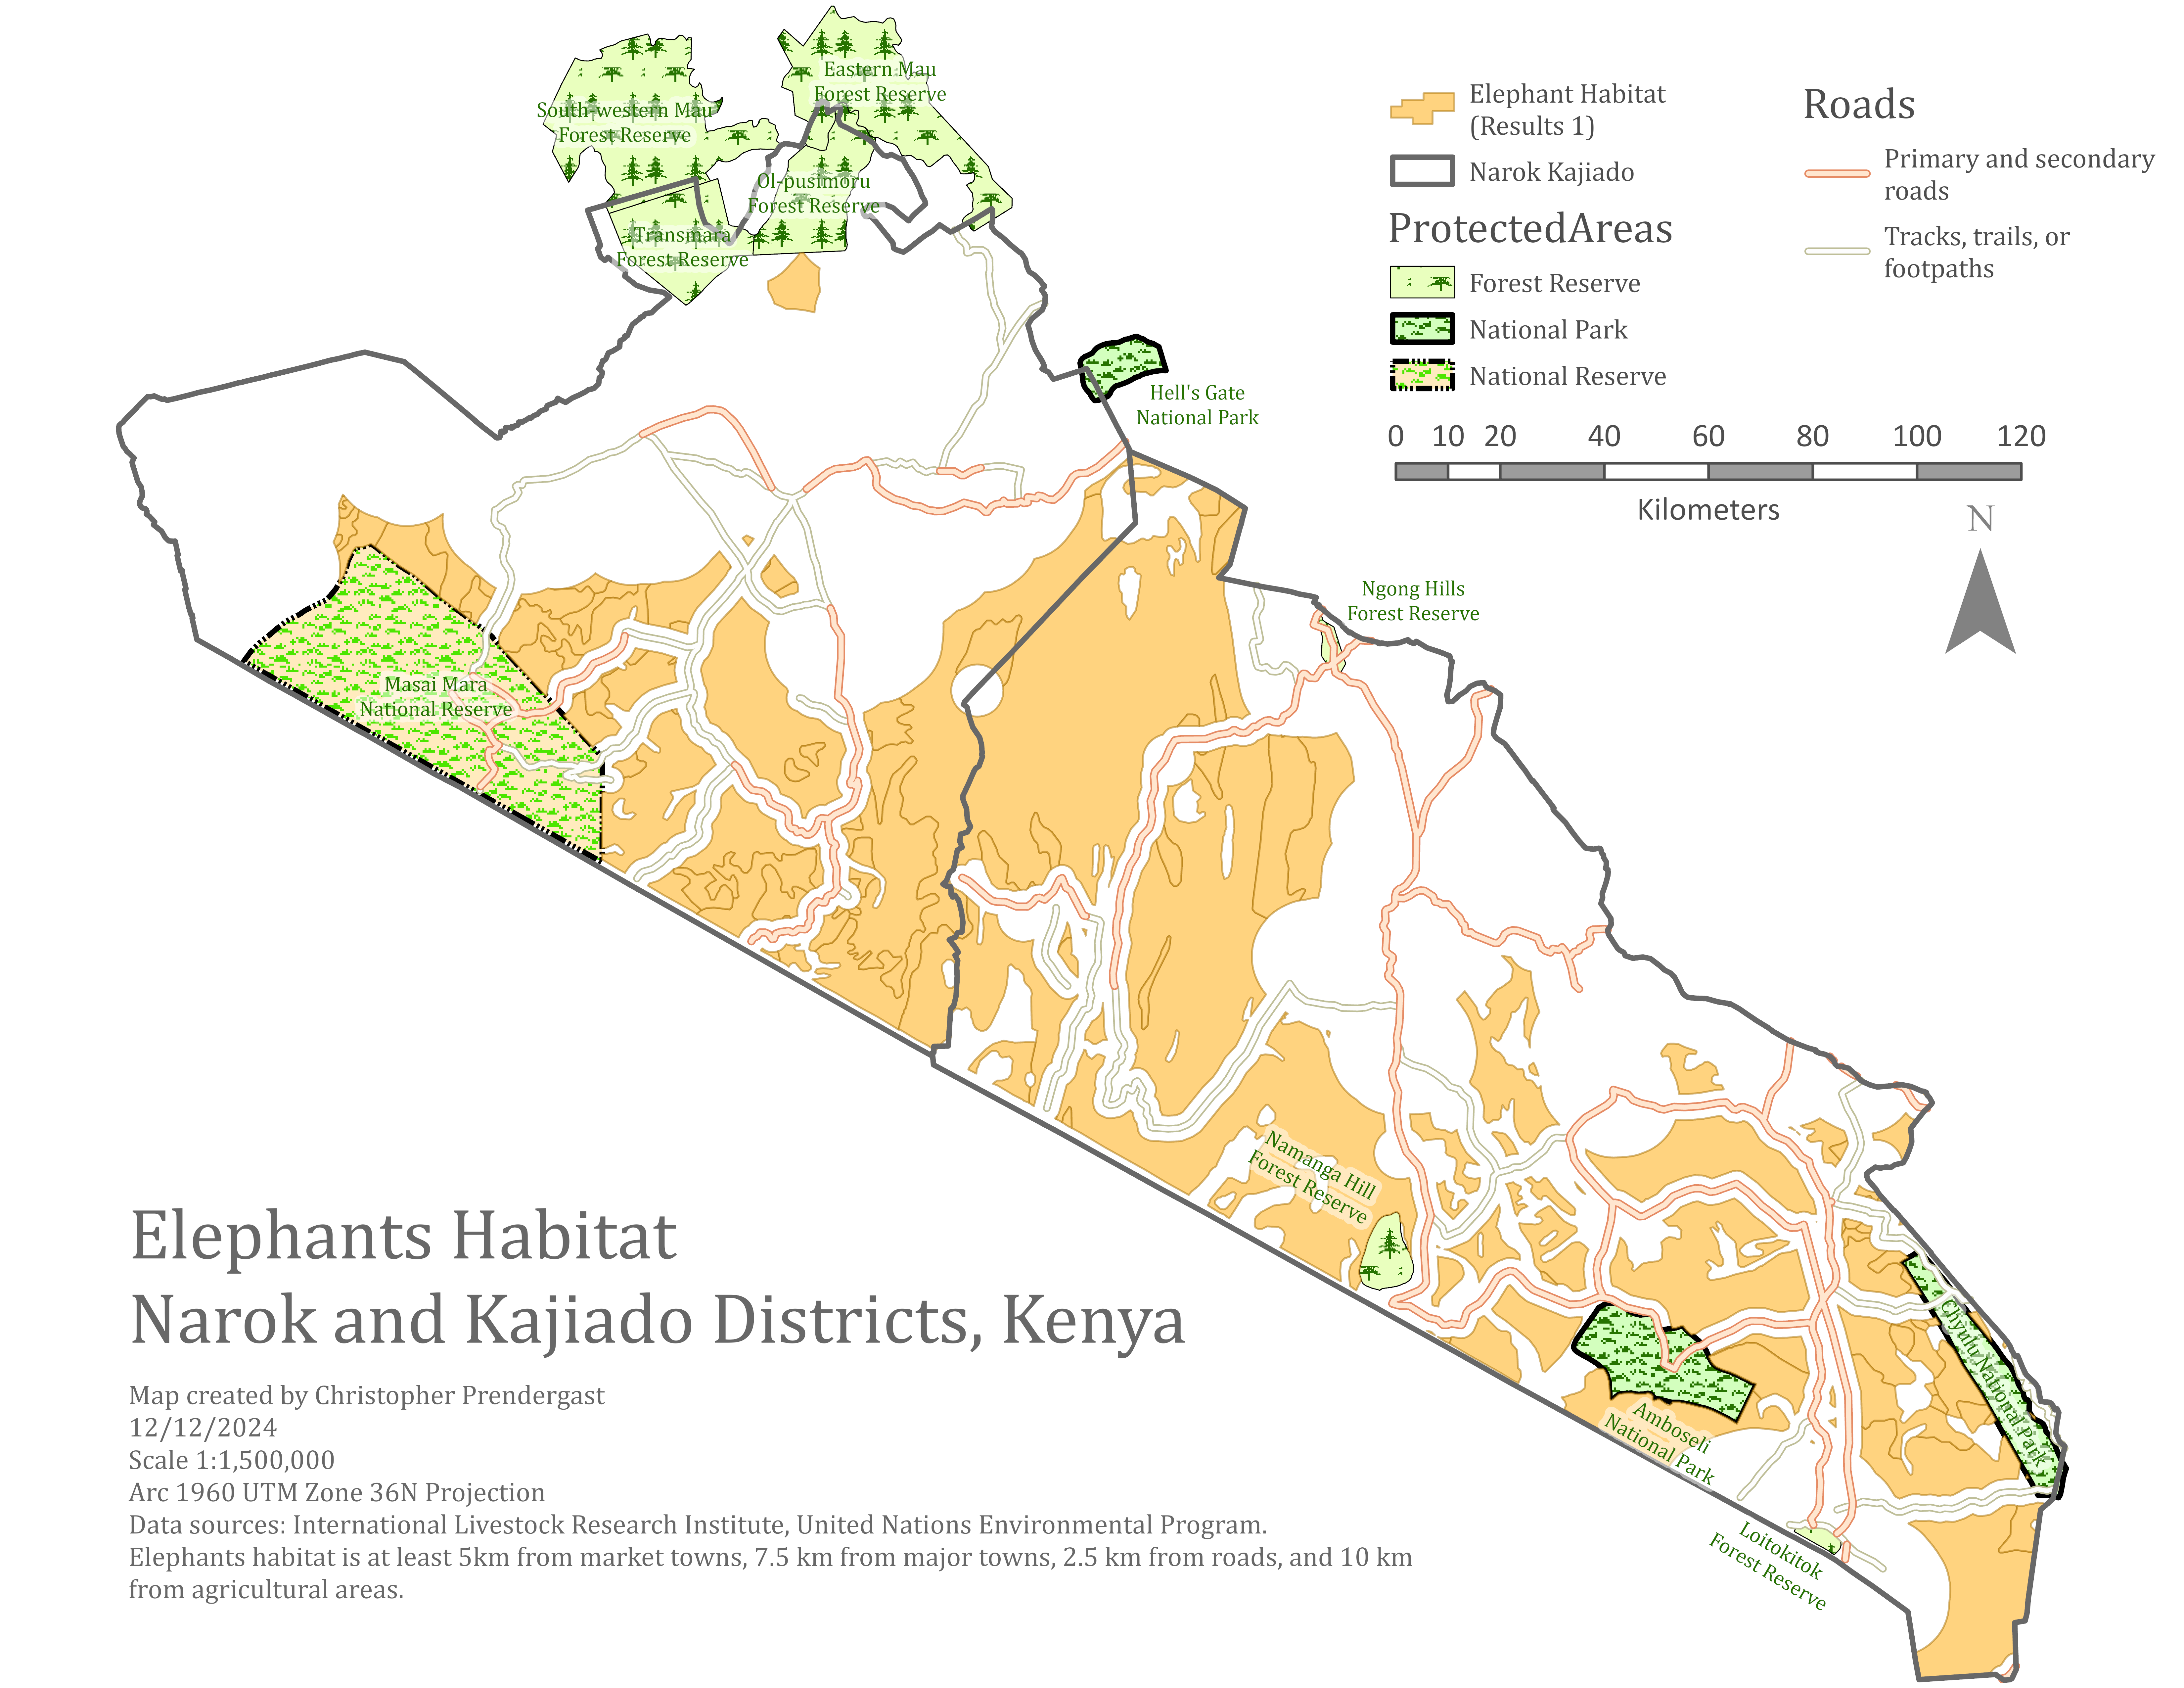
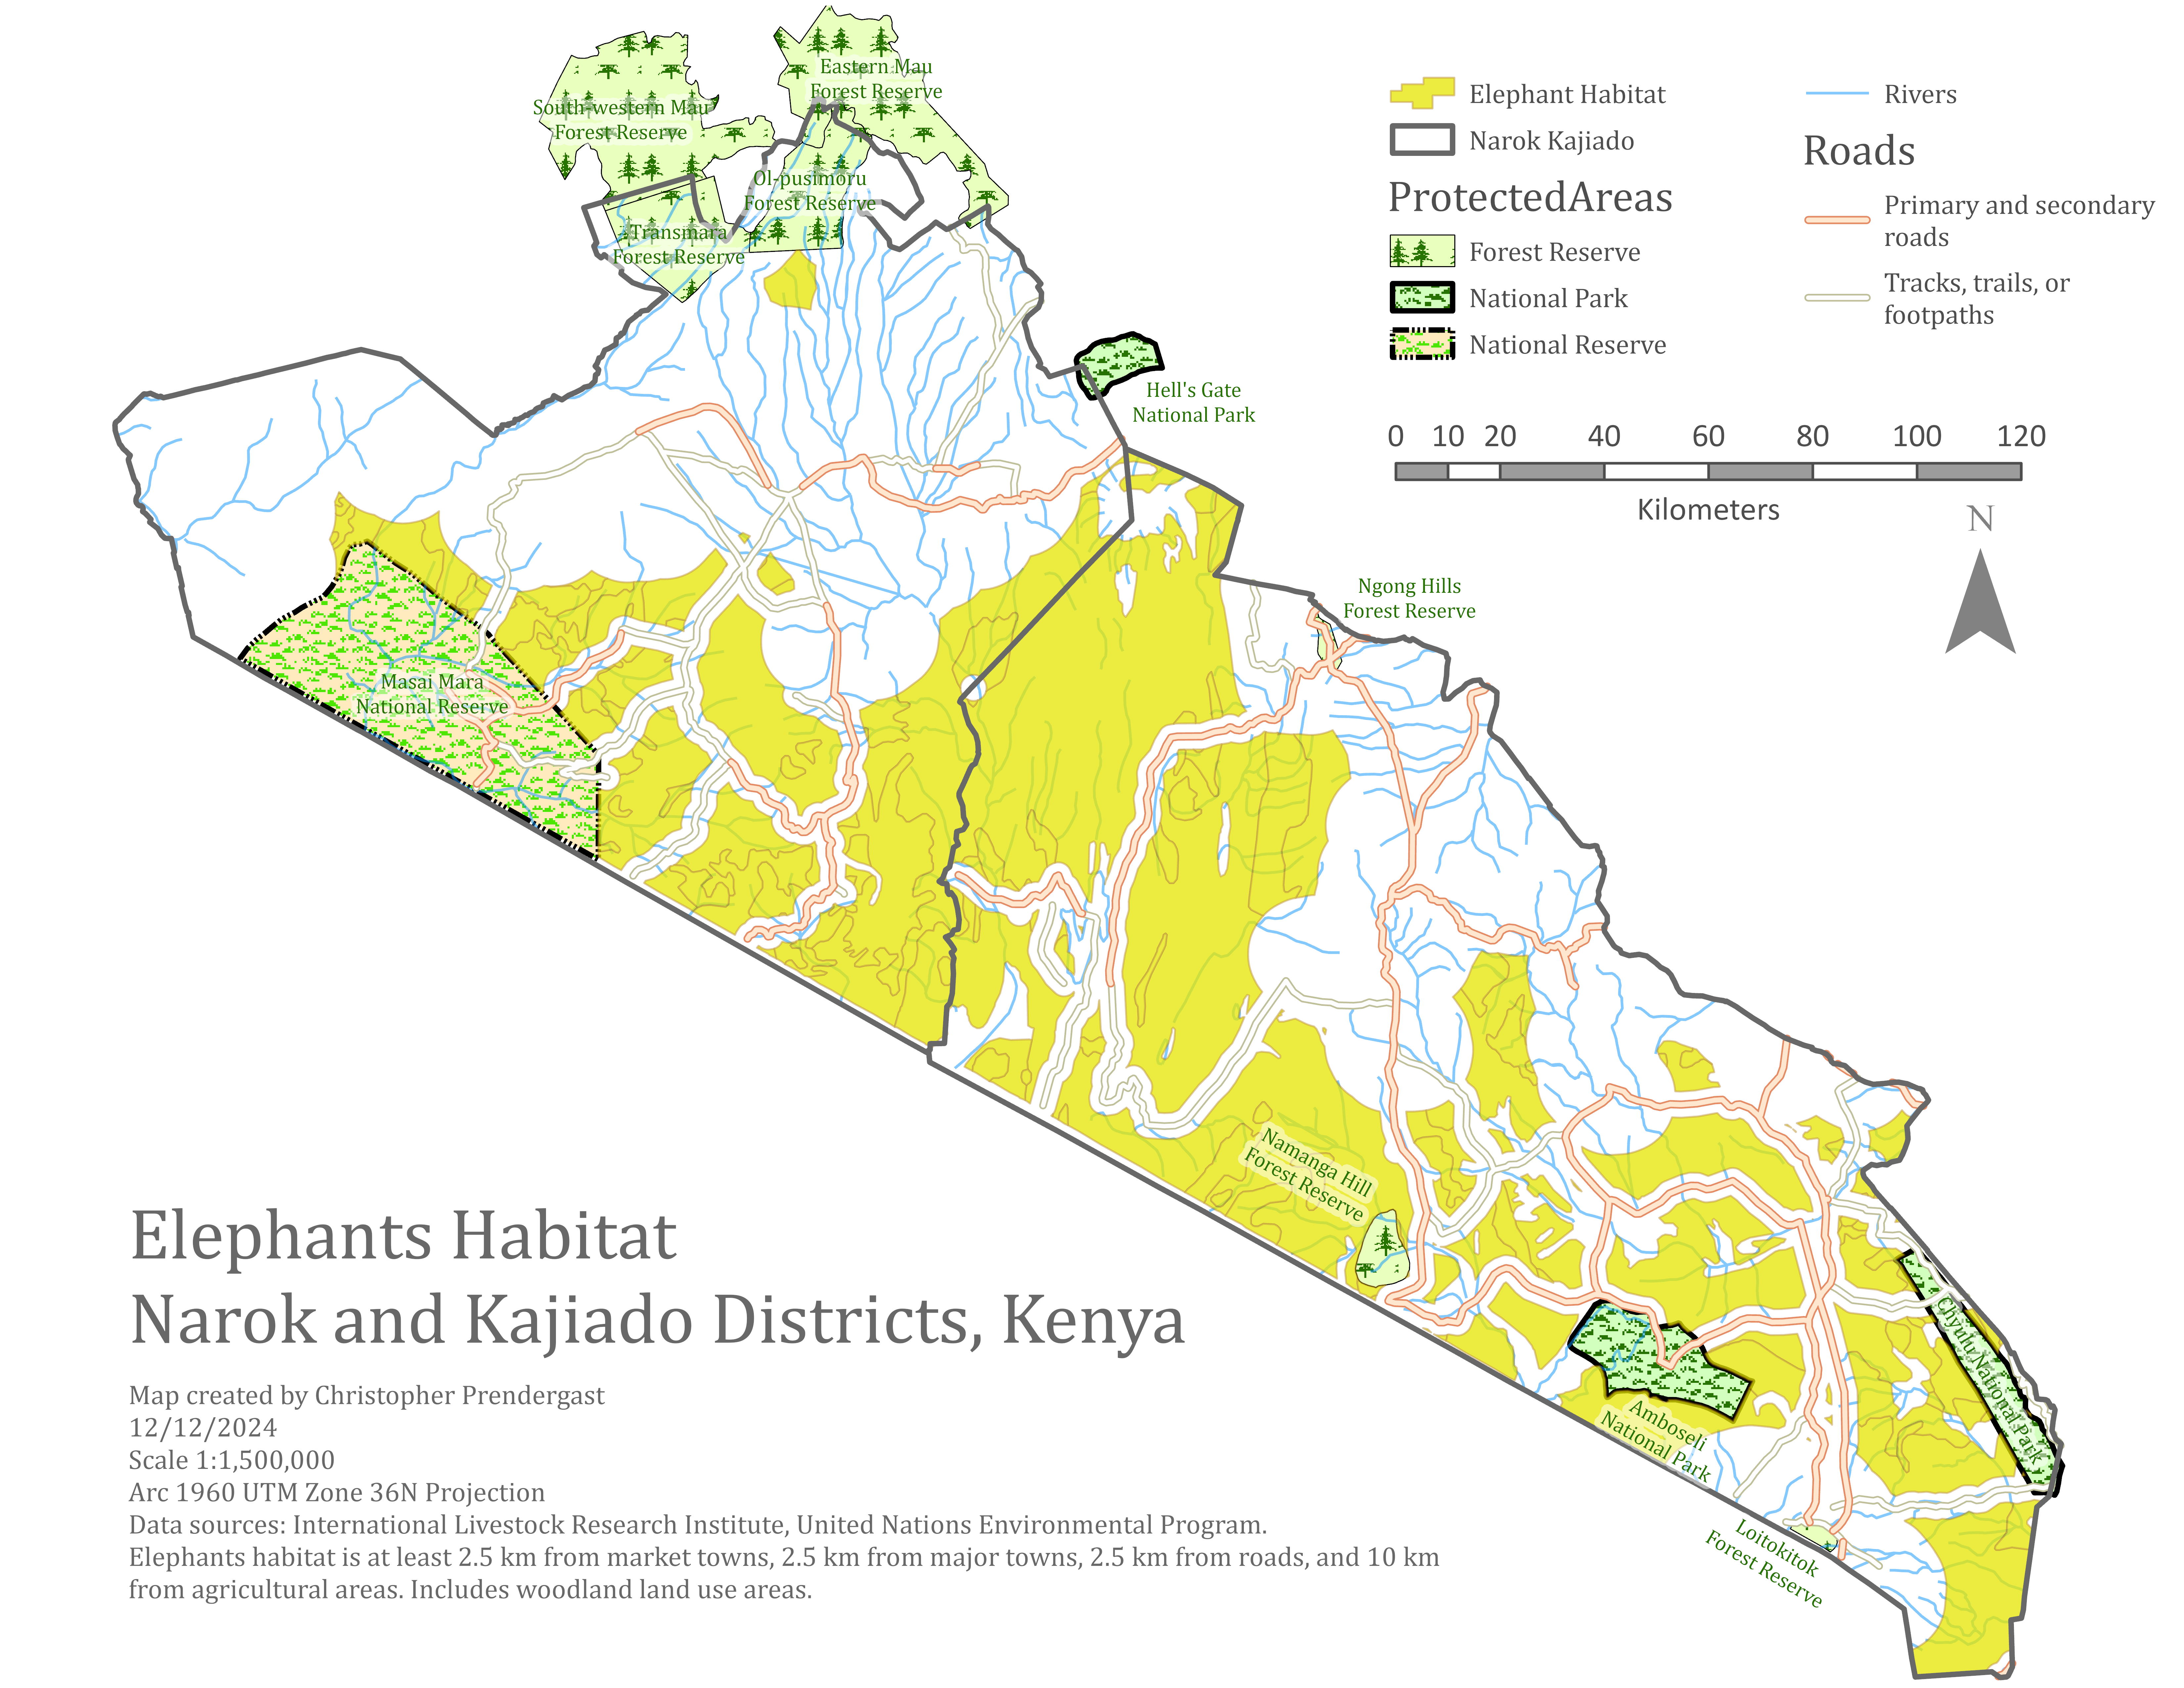
The Suitable Elephant Habitat Map represents a critical step in the elephant habitat conservation project by visualizing suitable habitat areas based on a combination of environmental and human-related criteria. The central focus of the map is to highlight areas within Narok and Kajiado where elephants are most likely to thrive, using a multi-criteria suitability model.
The core layer featured on this map is the Suitability layer, which results from merging several input factors through a vector overlay analysis. Inputs include:
-
Rainfall: as a proxy for vegetation and water availability,
-
Distance from roads: to reduce the likelihood of human disturbance or conflict,
-
Distance from towns: to avoid high human population density,
-
Land use: to prioritize natural vegetation and exclude urban or agricultural areas.
The resulting suitability layer provides a visual summary of where conservation zones could be extended or reinforced based on spatial patterns of environmental favorability.
Supporting layers such as ProtectedAreas, Narok_Kajiado, ProblemElephantsFC, Major_Towns, and Roads_WFP are included to contextualize the model output. These layers help assess how well existing protected areas align with suitable zones and where potential conflicts or gaps may occur.
This map marks the transition from exploratory spatial analysis to a decision-support product, capable of guiding conservation strategies, land-use planning, or policy recommendations related to elephant habitat protection.
Protected Areas and Elephant Habitat
The Protected Areas and Elephant Habitat Map focuses on analyzing the spatial relationship between protected areas and surrounding elephant habitat, with the goal of identifying regions where conservation efforts can be reinforced or expanded. Using geoprocessing tools such as buffers, intersect, and clip, the map models zones of potential habitat suitability and assesses their connectivity to existing protected areas.
At the core of this analysis is the ProtectedAreas layer, which includes national parks, forest reserves, and other conservation zones. The map uses buffer zones around these areas to identify surrounding landscapes that may serve as ecological transition zones or dispersal corridors for elephants. These buffers help visualize areas that are not formally protected but may play a critical role in habitat connectivity and wildlife movement.
Supporting layers include Narok_Kajiado district boundaries and Roads_WFP, which provide administrative and infrastructure context.
The map effectively highlights regions where protected areas are either fragmented or insufficiently connected, offering spatial insight into where new conservation efforts could be most impactful. This is a key step toward building a more resilient elephant habitat network that reduces conflict and promotes long-term ecological viability.
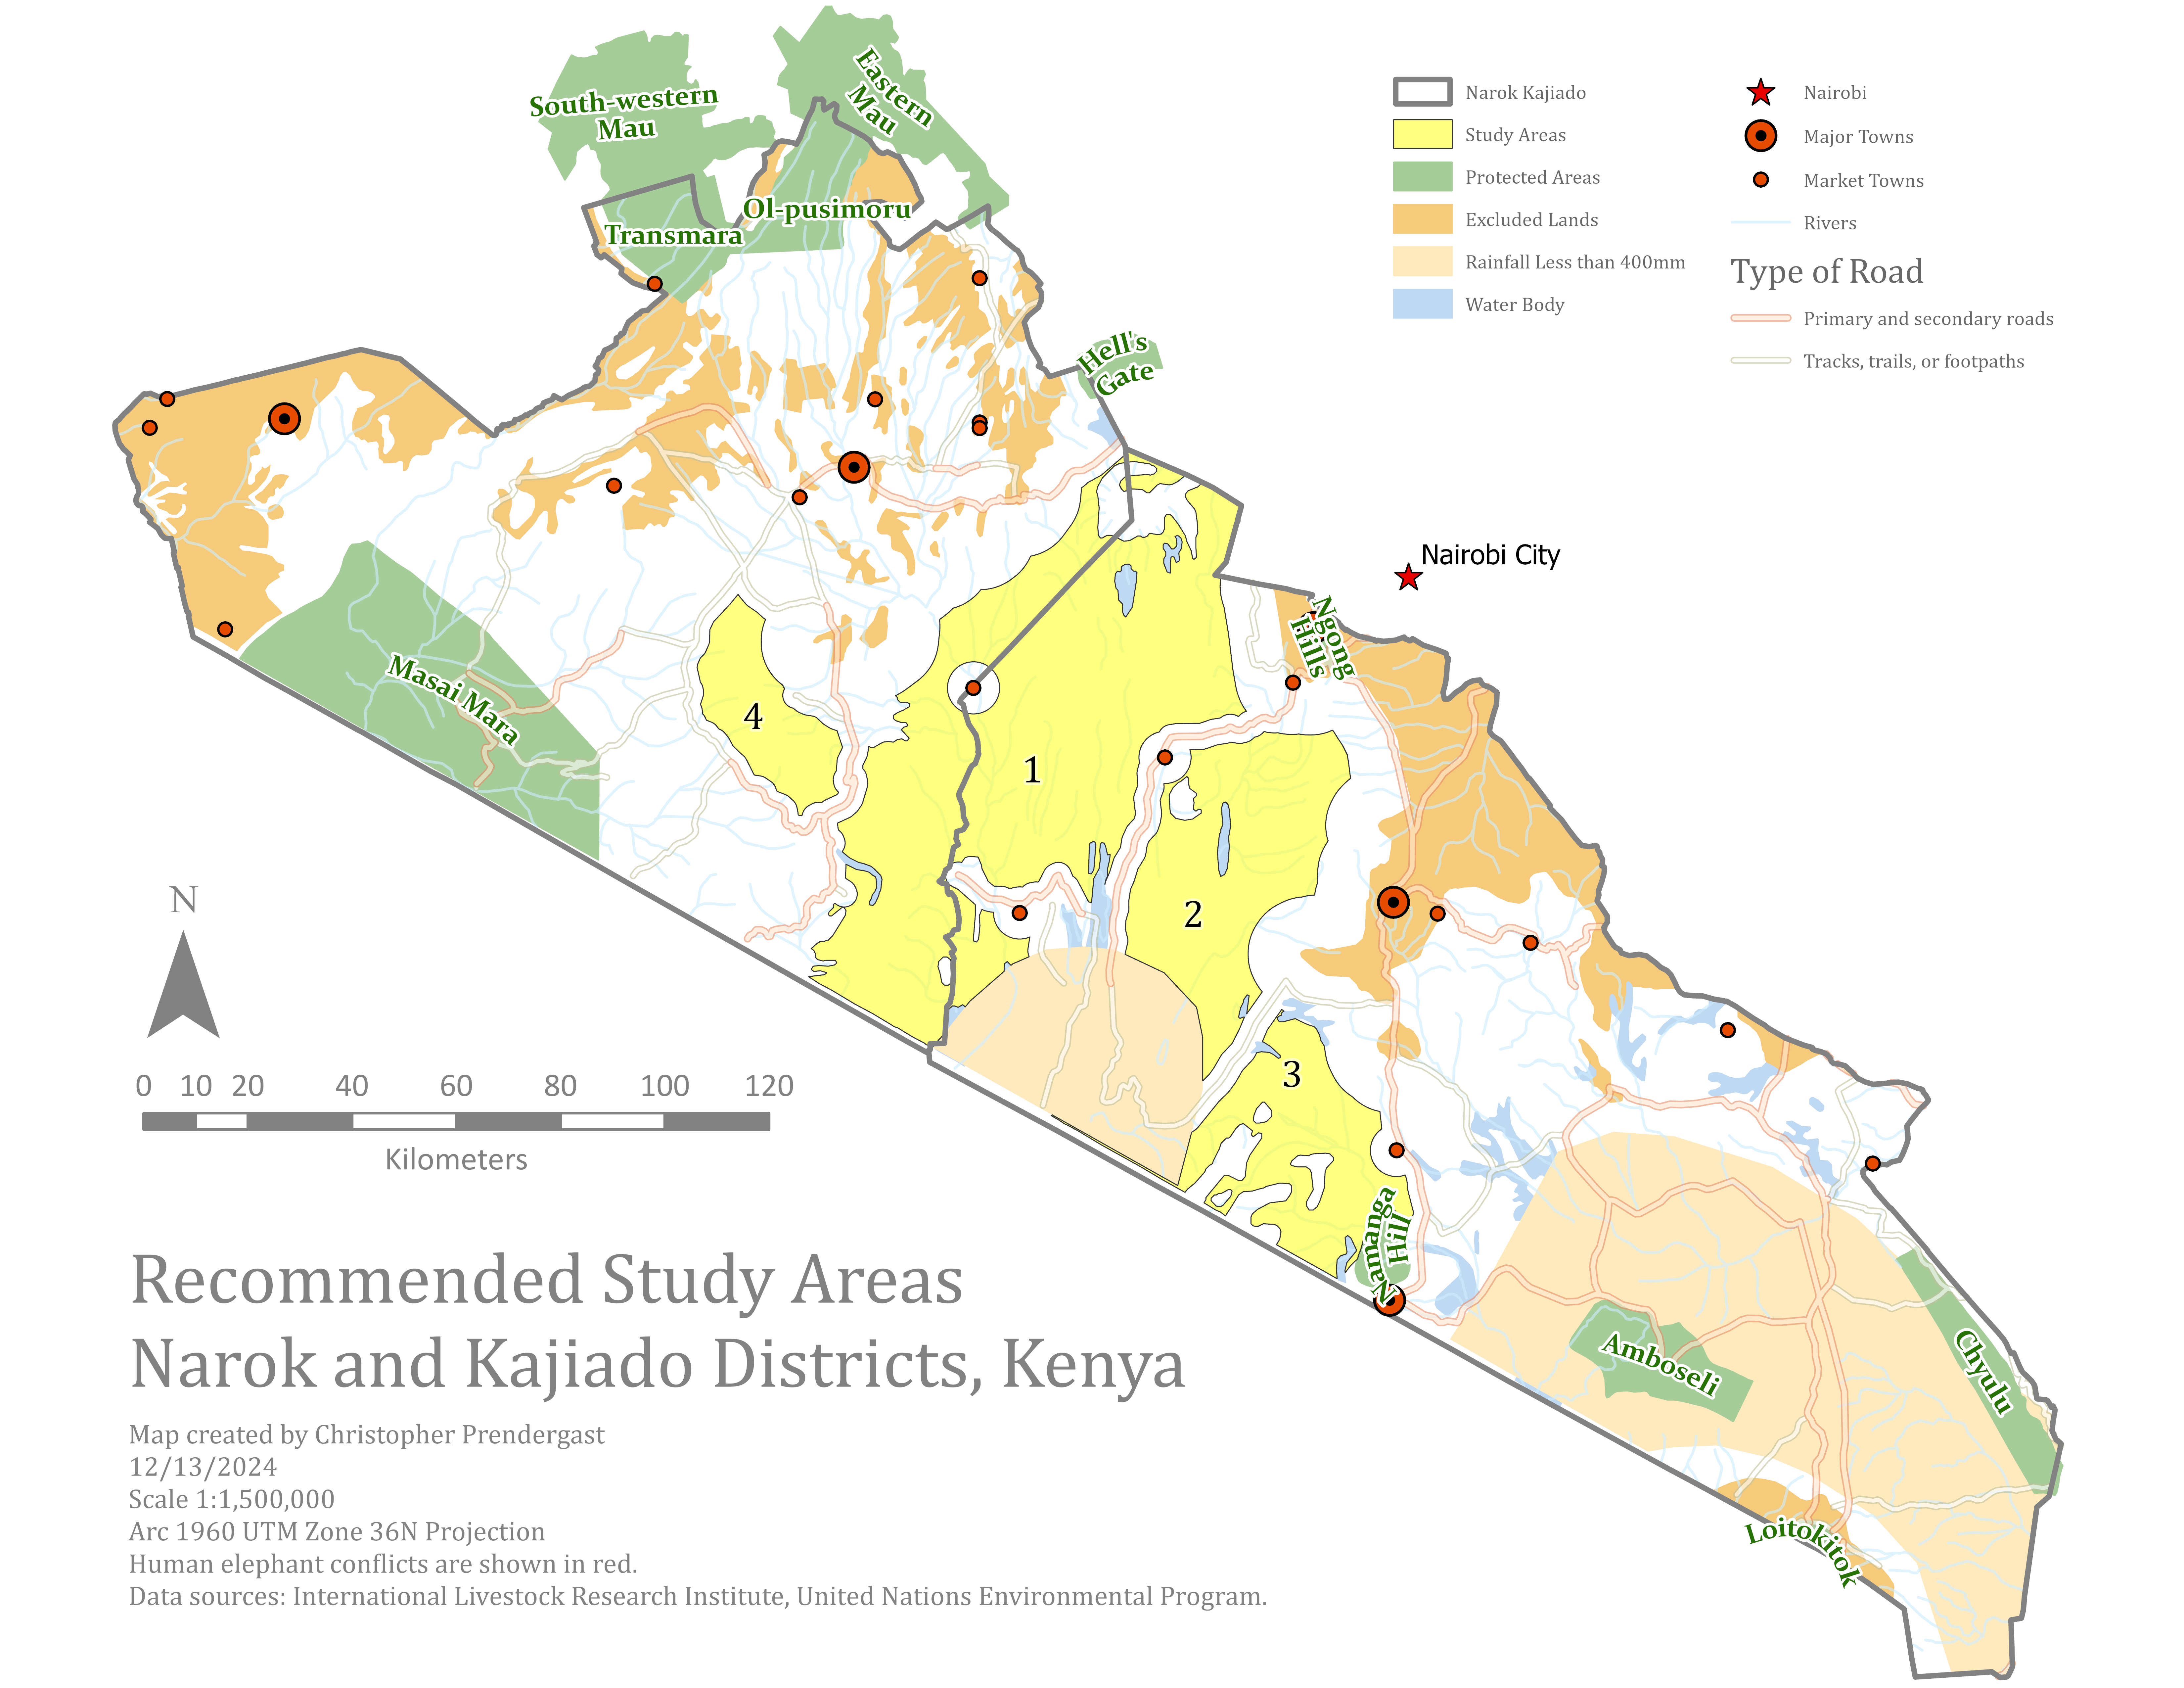
Recommended Study Areas
The final map Study Areas Map centers on the recommended study areas within the Narok and Kajiado districts, providing a comprehensive and automated spatial analysis of potential elephant habitat using ModelBuilder. The map visualizes results from a model that integrates multiple environmental and human impact variables to evaluate habitat suitability specifically within these two key districts in southwestern Kenya.
At the core of the map are the Narok_Kajiado boundaries, which define the project’s geographic focus. The ProtectedAreaswithin these districts—such as the Maasai Mara National Reserve and adjacent forest reserves—serve as critical anchors for elephant populations. The analysis evaluates how suitable habitat extends beyond these formally protected zones, identifying connected or fragmented patches of land that could serve as corridors or priority conservation areas.
Using ModelBuilder, the map displays output from a weighted overlay model that includes:
-
Proximity to protected areas,
-
Natural land use classes within Narok and Kajiado,
-
Buffer zones around roads, towns, and conflict points,
-
Rainfall distribution relevant to forage and water access.
The map overlays infrastructure layers including Roads_WFP and Major_Towns to highlight the tension between habitat and human settlement.
The map delivers district-specific insights into where elephants are most likely to find safe and suitable habitat, and where human-elephant interactions are most likely to occur. It supports localized decision-making by identifying opportunities for habitat expansion, conservation prioritization, and conflict mitigation directly within the designated study areas.
ModelBuilder
The ModelBuilder model developed for this project automates the process of identifying suitable elephant habitat by integrating multiple spatial criteria. Built in ArcGIS Pro, the model streamlines complex geoprocessing tasks into a clear, repeatable workflow that ensures analytical consistency and allows for efficient scenario testing and refinement.
The model incorporates several important input layers. The land use data is reclassified to highlight natural vegetation types such as forests, bushland, and grasslands, while minimizing the suitability of human-modified landscapes like urban areas and agricultural fields. The ProtectedAreas layer is used to identify existing conservation zones and adjacent lands that may serve as viable extensions of elephant habitat. Rainfall data is included to emphasize areas with favorable environmental conditions, particularly those that support vegetation and water resources.
To account for human pressures, the model includes buffer zones around roads and towns, representing areas where human activity may interfere with elephant movement or increase the risk of conflict. These buffer areas help define exclusion zones, directing attention to regions with lower human influence. The ProblemElephantsFC layer, which contains mapped locations of past human-elephant conflict incidents, supports the analysis by identifying areas of concern and providing a real-world reference for evaluating model outputs.
Throughout the model, tools such as Buffer, Select by Location, Intersect, and Erase are used to define suitable and unsuitable areas based on proximity and spatial relationships. The final output is a vector-based feature layer showing geographic zones within Narok and Kajiado that meet all criteria for potential elephant habitat. These areas can be further analyzed, mapped, or used for decision-making regarding conservation planning, land use policy, or conflict mitigation.
By encapsulating all geoprocessing steps into a single, modular design, the ModelBuilder model allows users to quickly adjust parameters, update inputs, or replicate the analysis in other regions. It provides a transparent and flexible framework for habitat suitability assessment, making it a powerful tool for supporting long-term elephant conservation efforts within the defined study areas.

Conclusion
This project demonstrates the effective use of GIS tools and spatial analysis techniques to support elephant habitat conservation planning within the Narok and Kajiado districts of Kenya. By integrating environmental variables such as land use and rainfall with human-related factors like roads, towns, and conflict locations, the analysis provides a data-driven approach to identifying suitable habitat areas and potential conflict zones.
Through the use of ModelBuilder, the workflow becomes not only efficient and repeatable but also transparent—allowing conservation practitioners to adjust inputs, re-run scenarios, and expand the model to new regions or species. The layers, tools, and maps developed throughout the project work together to visualize where elephants are most likely to thrive and where human-elephant conflict risks are greatest.
The final products—including a suitability map, well-organized spatial data layers, and a reusable geoprocessing model —offer a solid foundation for evidence-based decision-making. These outputs can support land-use planning, conflict mitigation strategies, and targeted conservation interventions. Ultimately, the project highlights the power of GIS in balancing ecological needs with human development pressures, providing practical tools to help ensure the long-term survival of elephants in shared landscapes.
Appendicies
Appendix I -- Geoprocessing Tools Used
The ModelBuilder workflow relies on a series of vector-based geoprocessing tools in ArcGIS Pro to automate the identification of suitable elephant habitat within the Narok and Kajiado districts. These tools are used to evaluate spatial relationships between features—such as proximity, overlap, and land classification—and to construct a logical, step-by-step analysis framework that can be repeated or adapted for future studies.
Table: Geoprocessing Tools Used in the Habitat Suitability Model
| Tool Name | Function | Purpose in Model |
|---|---|---|
| Buffer | Creates buffer zones around features (e.g., roads, towns, protected areas). | Defines influence or exclusion zones based on proximity. |
| Select Layer By Location | Selects features based on their spatial relationship to another layer. | Identifies features within or intersecting buffers or study area boundaries. |
| Clip | Extracts features within a specified boundary. | Restricts outputs to the Narok and Kajiado study area. |
| Erase | Removes portions of features that overlap another feature class. | Excludes unsuitable areas (e.g., near roads or towns) from habitat zones. |
| Intersect | Identifies overlapping areas between multiple input layers. | Finds locations that meet multiple suitability criteria simultaneously. |
| Merge | Combines multiple feature classes into one. | Used when consolidating similar outputs or buffers into a single layer. |
| Union | Combines geometry and attributes of input layers. | Integrates multiple datasets while preserving their spatial extents. |
One of the core tools used in the model is Buffer, which creates distance zones around features such as roads, towns, and protected areas. Buffers help define areas of influence—either to avoid (e.g., buffers around towns where human disturbance is high) or to prioritize (e.g., areas near existing protected zones). These buffer zones form the basis for further spatial analysis.
The Select Layer By Location tool is used to identify features that spatially intersect, are within a certain distance of, or are contained within other features. This is especially useful for filtering land use categories or conflict points that fall within buffer zones or protected areas.
The Clip tool is used to restrict datasets to the defined study area—namely, the Narok_Kajiado district boundary—ensuring that the analysis focuses only on relevant geographic areas. Similarly, Erase is used to remove features from specific zones, such as excluding unsuitable land uses or areas too close to towns or roads.
Intersect is employed to identify areas where multiple suitable conditions overlap, such as natural land cover types that also fall within proximity to protected areas and outside zones of human conflict. This tool helps refine the output to only those areas that meet all necessary criteria.
Additionally, the Merge and Union tools may be used to combine multiple compatible features into a single layer, particularly when inputs from various sources are prepared separately but must be considered together in the final analysis.
These tools are sequenced within ModelBuilder to run automatically, eliminating the need for manual repetition and reducing the chance of error. By combining spatial logic with automation, the model delivers a robust, scalable approach to habitat suitability analysis that aligns with conservation goals and supports decision-making at the local level.
Appendix II -- Key Layers
The habitat suitability model incorporates a set of well-defined vector data layers, each playing a distinct role in analyzing and identifying appropriate zones for elephant conservation. These layers represent both environmental features that support elephant movement and survival, and human-related elements that influence conflict and habitat fragmentation. Below is a description of each key layer used in the analysis:
Table: Description of Layers Used in Elephant Habitat Suitability Model
| Layer Name | Type | Description | Role in Analysis |
|---|---|---|---|
| ProtectedAreas | Polygon | National parks, reserves, and forest conservation zones. | Used to identify existing habitat; proximity is a key factor for suitability. |
| LandUse | Polygon | Categorized land cover types: forest, bushland, grassland, agriculture, urban areas. | Natural land uses are favored; developed/agricultural zones are excluded. |
| Roads_WFP | Line | National and regional roads, tracks, and trails sourced from the World Food Programme. | Buffers applied to reduce suitability near high human activity corridors. |
| Major_Towns | Point | Locations of primary towns within Narok and Kajiado. | Buffer zones used to eliminate high-density human areas from suitable habitat zones. |
| Nairobi | Point | Kenya’s capital city, located east of the study area. | Included for reference and geographic context only. |
| Narok_Kajiado | Polygon | Administrative boundaries of the study area (Narok and Kajiado districts). | Used to clip analysis outputs to the defined study area. |
| ProblemElephantsFC | Point | Conflict locations involving elephants: “Farm”, “Fence”, “HEC” types. | Used to identify conflict-prone zones and validate habitat suitability areas. |
ProtectedAreas
This polygon layer includes formal conservation zones such as national parks, national reserves, and forest reserves. These areas represent known elephant habitats and are prioritized in the model for their ecological integrity and legal protection status. Proximity to protected areas is used as a positive factor in identifying nearby land with high habitat value.
LandUse
This layer classifies the landscape into various land cover types, such as forest, bushland, grassland, agricultural areas, and urban zones. Natural land use categories are favored in the model as suitable elephant habitat, while developed or cultivated lands are considered unsuitable due to potential for conflict and limited forage availability.
Roads_WFP
Provided by the World Food Programme, this line feature layer includes primary, secondary, and tertiary roads, as well as tracks and trails. Roads are associated with human activity and disturbance, so the model creates buffer zones around them to reduce habitat suitability in these areas.
Major_Towns
This point feature layer includes significant urban centers within and near the Narok and Kajiado districts. Towns are used to define areas of high human density and infrastructure, which elephants tend to avoid. Buffer zones around towns are excluded from potential habitat areas to reduce overlap between elephants and human settlements.
Nairobi
The capital city is included as a reference point in the map for orientation and scale. Although not directly part of the suitability analysis, Nairobi is labeled and symbolized to provide context within the broader study region.
Narok_Kajiado
This polygon layer defines the administrative boundaries of the two focus districts—Narok and Kajiado. It serves as the study area mask, ensuring that all spatial analysis and outputs are limited to the target region.
ProblemElephantsFC
This point feature class was created from tabular data recording human-elephant conflict incidents, including types such as “Farm,” “Fence,” and general “HEC.” These points are used to identify conflict hotspots and assess the overlap between high-suitability areas and real-world elephant activity outside protected areas.
Appendix III -- Data Sources
International Livestock Research Institute (ILRI):
- https://www.ilri.org
- Provided foundational GIS datasets for Kenya.
- Key datasets from ILRI include:
- District boundaries (1998)
- Villages (point coverage)
- Annual rainfall
- Population census data (1989)
- Rivers and lakes
- Water points
- Land use (derived from 1980 Landsat images)
United Nations Environment Programme (UNEP)
- Additional countrywide data, similar to ILRI’s.
- Used to supplement environmental variables like rainfall and land cover.
Japan International Cooperation Agency (JICA)
- Contributed datasets related to:
- Annual rainfall
- River networks
- Land use classification
World Food Programme (WFP)
- Supplied Kenya’s national road network data (excluding western Kenya).
- Includes metadata on:
- Road types (e.g., primary, secondary, trails)
- Road conditions (e.g., functioning, schematic)
World Conservation Monitoring Centre (WCMC)
- Provided data for Protected Areas, a subset from the Africa-wide protected areas database.
- Includes info such as:
- Area name
- IUCN category
- Year of designation
- Area size in hectares
Food and Agriculture Organization (FAO)
- Source of forest data for Kenya.
- Forests classified using a land-use code.
International Union for Conservation of Nature (IUCN)
- Source of wetland data.
- Includes wetlands such as marshes, mangroves, and saline lakes.