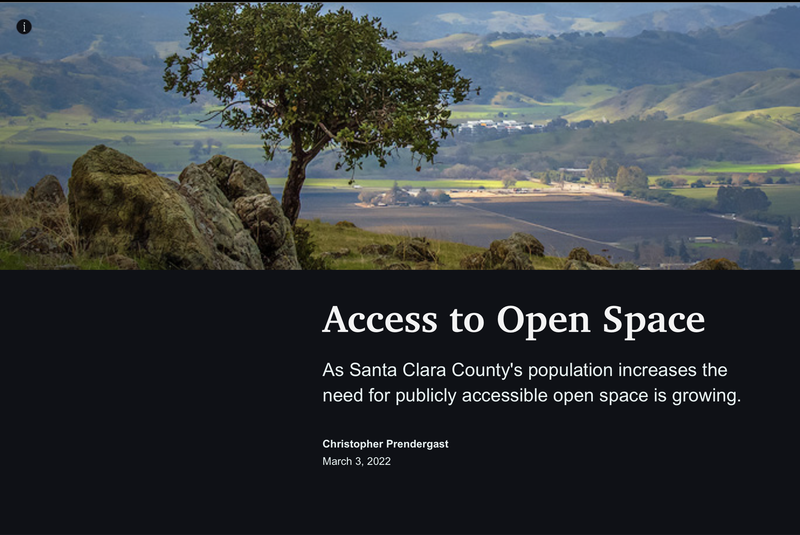
Overview
As Santa Clara County's population increases the need for publicly accessible open space is growing. This series of maps presents an analysis of the accessibility of open space in Santa Clara County, California. Individual maps examine the current extent of urban, agricultural, and open space areas, the potentail risk of development, population distribution and density, and the spatial distribution of various measures of accessibility. Measures of accessibility include park and open space half-mile service areas, distance to closest open space, open space coverage, density, and area per person.
StoryMap #1
Click here to view StoryMap #1 on ArcGIS.com.
StoryMap #2
Click here to view StoryMap #2 on ArcGIS.com.
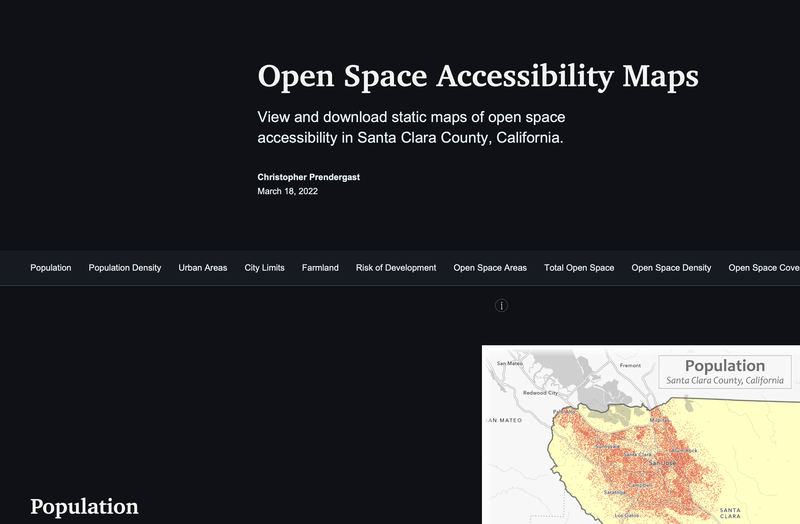
Individual Maps
The individual maps contained in the StoryMaps above are included below.
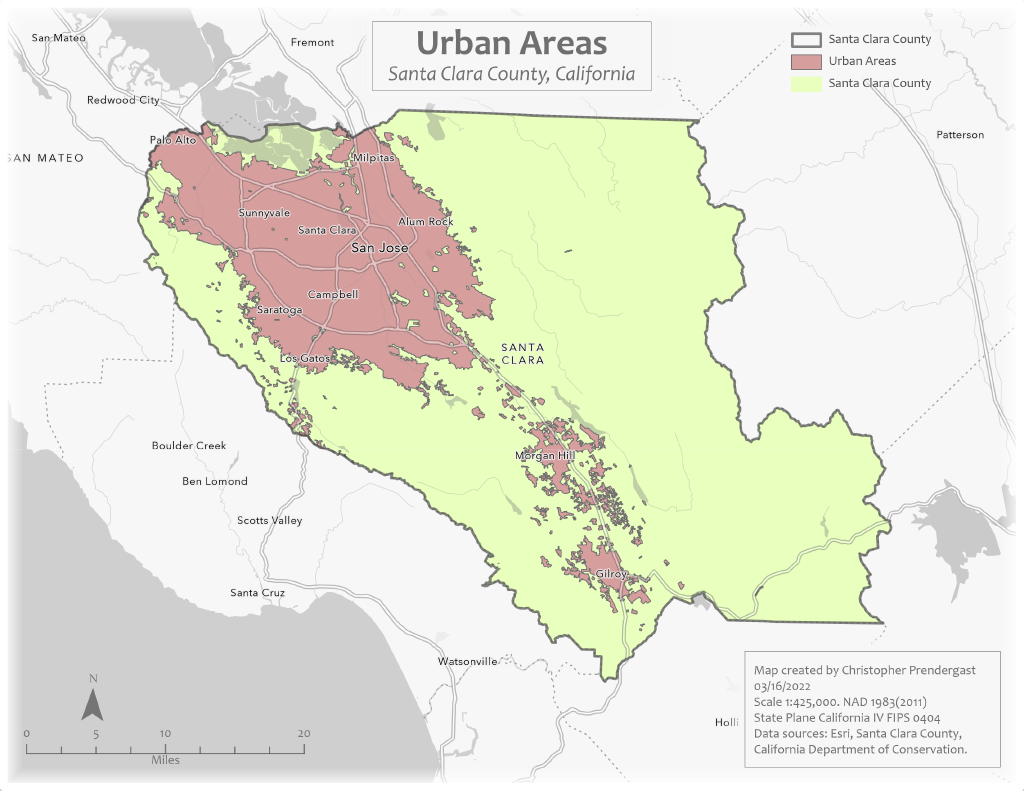
Urban Areas
Today, the bulk of Santa Clara County’s population is concentrated in urban areas. In fact, 95% of the county's population lives in cities. The growing urban population has only increased the need for more publicly accessible open space.
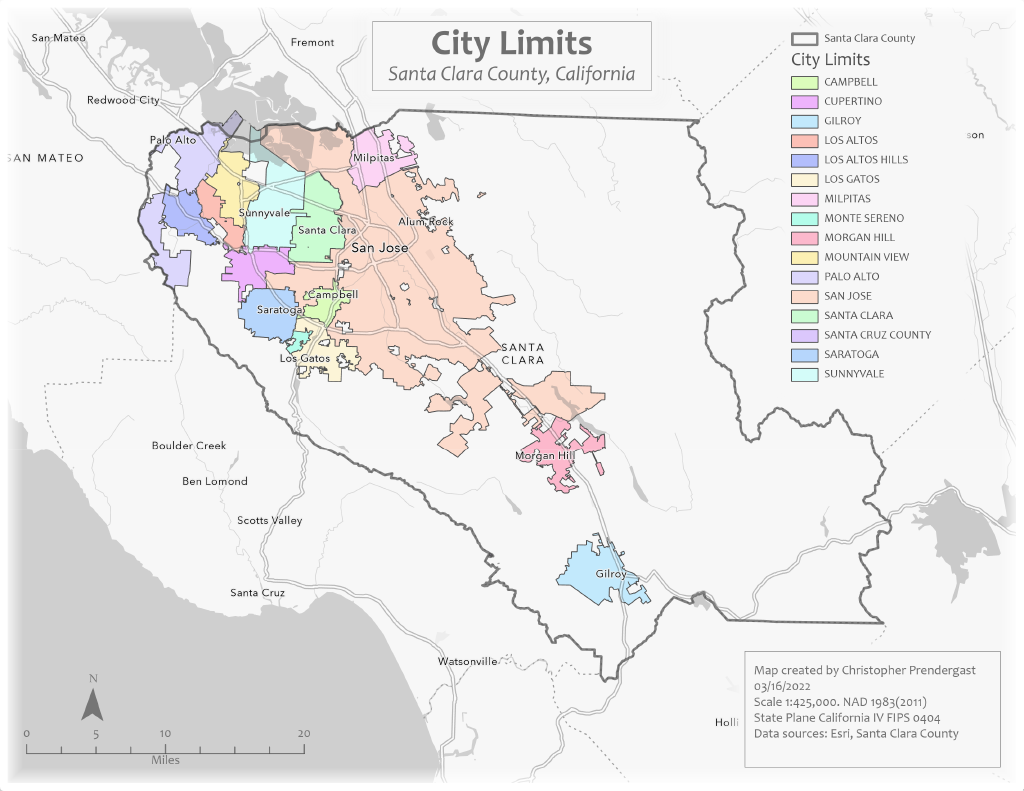
City Limits
Most of the the Bay Area's population is concentrated in urban areas which lie within city limits. However, as you explore the data, you will see that although the urban areas fall mostly within city limits, they do not correspond exactly with the boundaries established by the city limits.
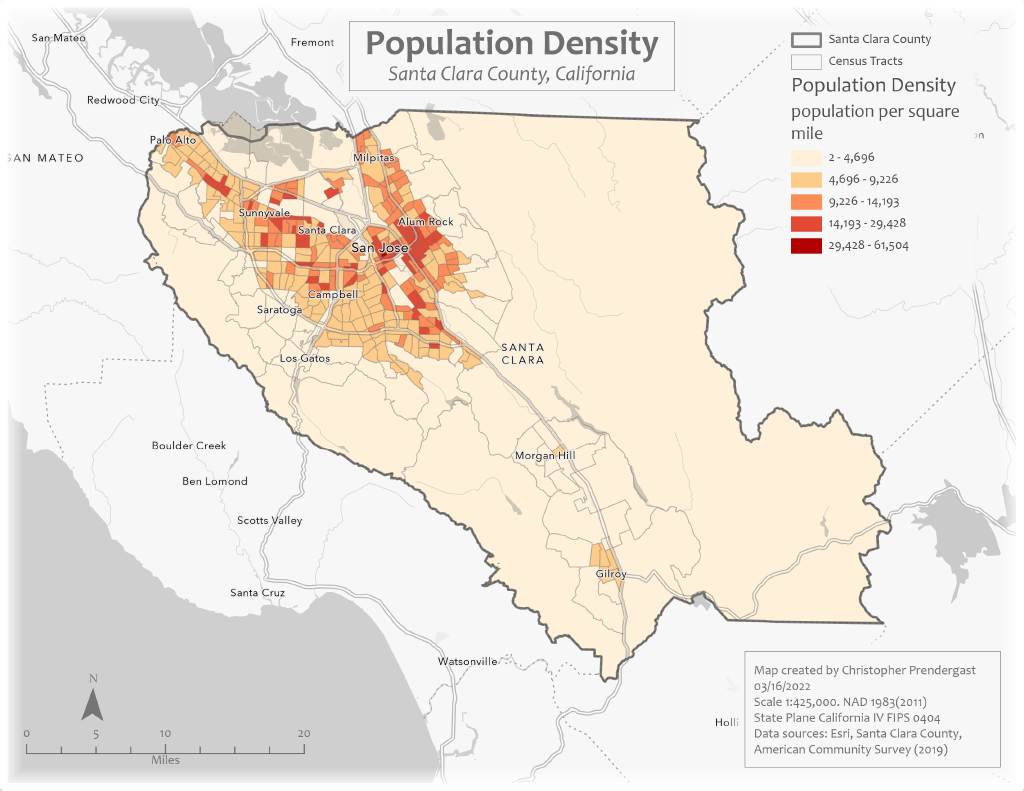
Population Density
Santa Clara County is a densely populated area. According to the 2020 census, Santa Clara County is the 6th most populous county in California. With a total area of 1,304 square miles, the county has a population of 1,936,259 people.
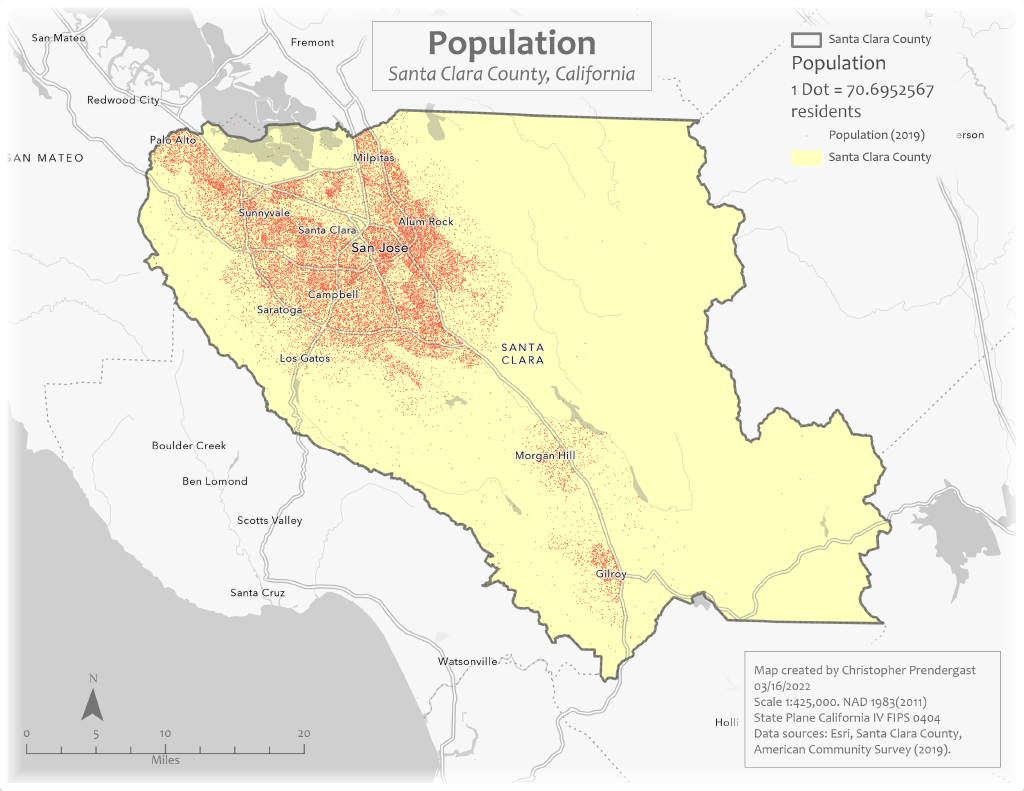
Population
Importantly, this population is not evenly distributed in space across the county; the main population centers, including the City of San Jose, are clustered around the southern end of the San Francisco Bay. There are two smaller population clusters in the south of the county centered around the cities of Morgan Hill and Gilroy.
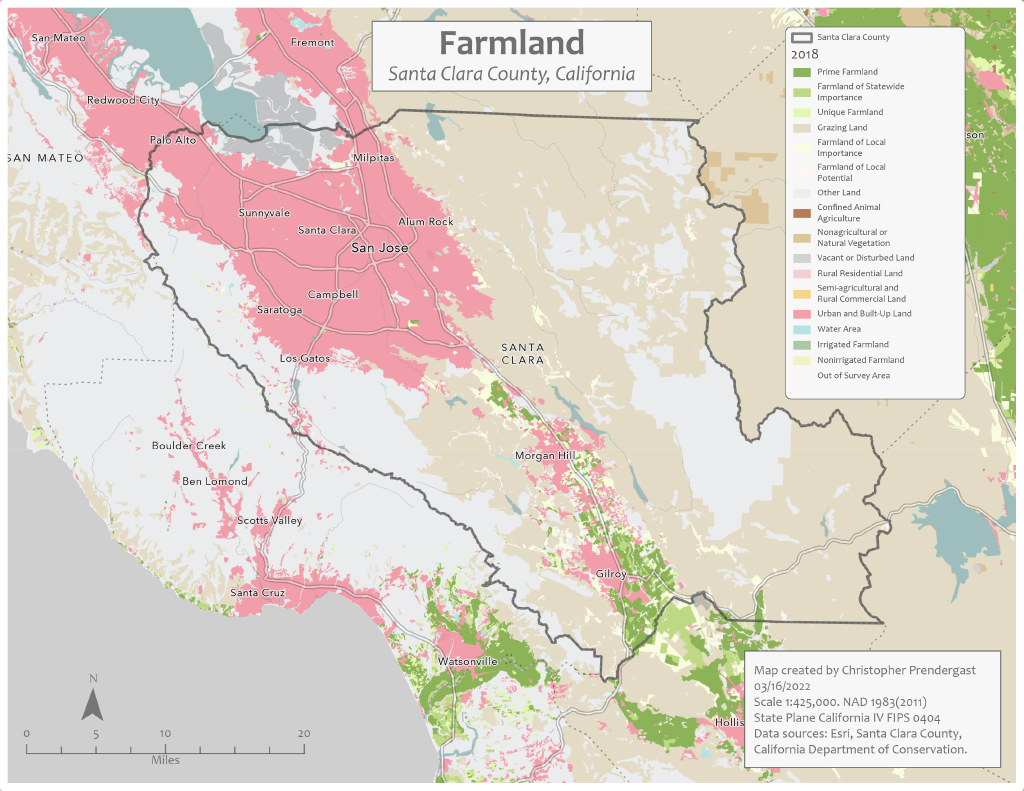
Farmland
Historically the Santa Clara Valley was known as "The Valley of Heart's Delight." In the Spring the valley used to be filled with many thousands of acres of blooming fruit trees. Today, rapid development and growing urbanization has consumed much of this formally agricultural and rural land. However, small areas of the county are still classified as "prime farmland" and "farmland of local importance."
This map illustrates the extent of the urban areas and shows the remaining farmland within the county. Sadly, increasing pressure for development threatens many of the remaining rural areas and farmland.
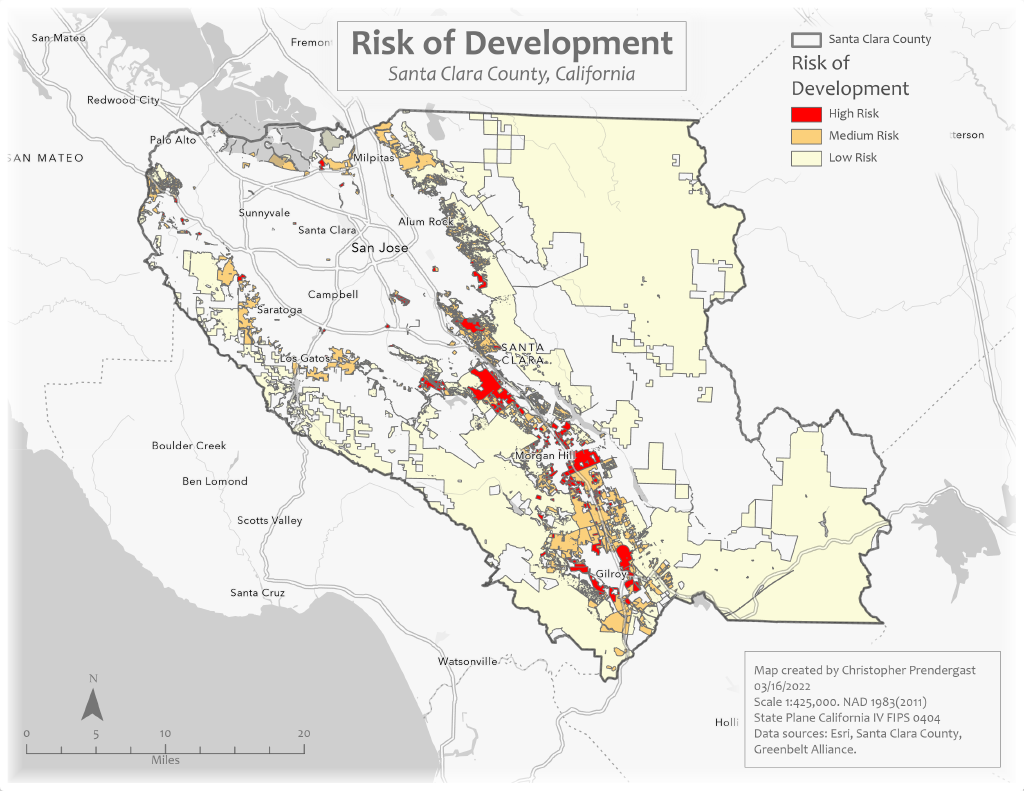
Land at Risk of Development
Much of the land in the county is either already urbanized or permanently protected from development. However, some of the few remaining rural and farmland areas are threatened with a high risk of development.
This map highlights those areas facing the greatest risk of development.
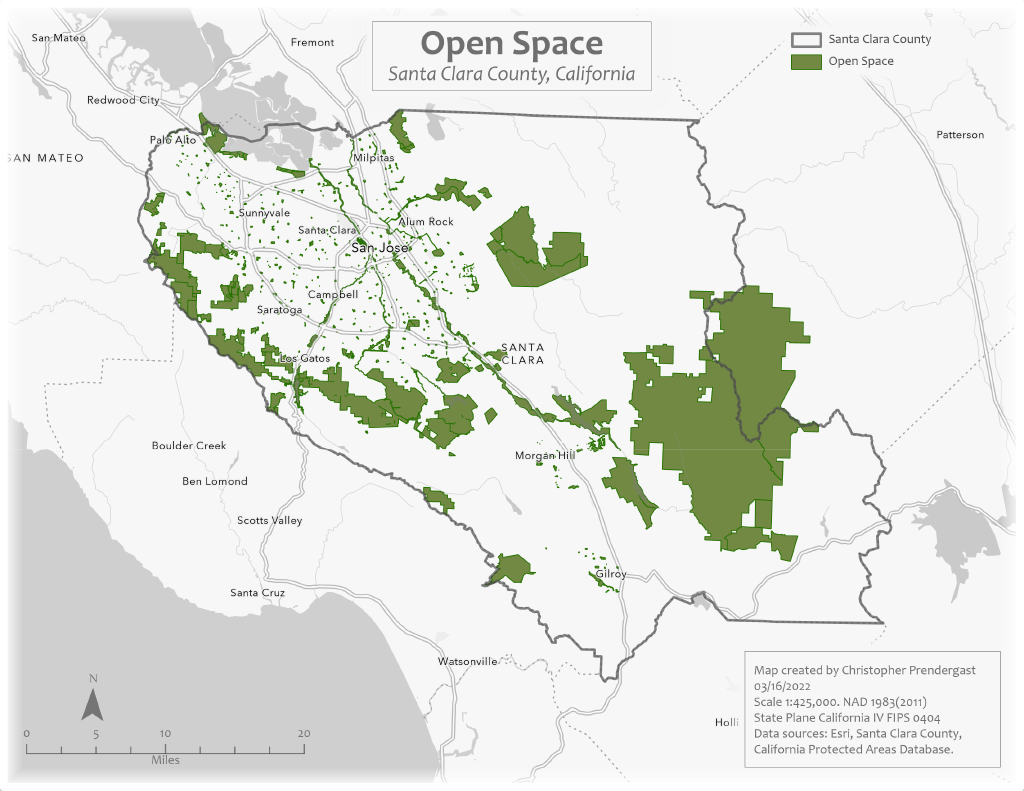
Open Space Areas
Fortunately, Santa Clara County already enjoys a wide range of publicly accessible open space preserved, owned, and managed by a variety of public agencies.
Open Space Density
This map shows variabtion in density of open space areas across different census tracts.
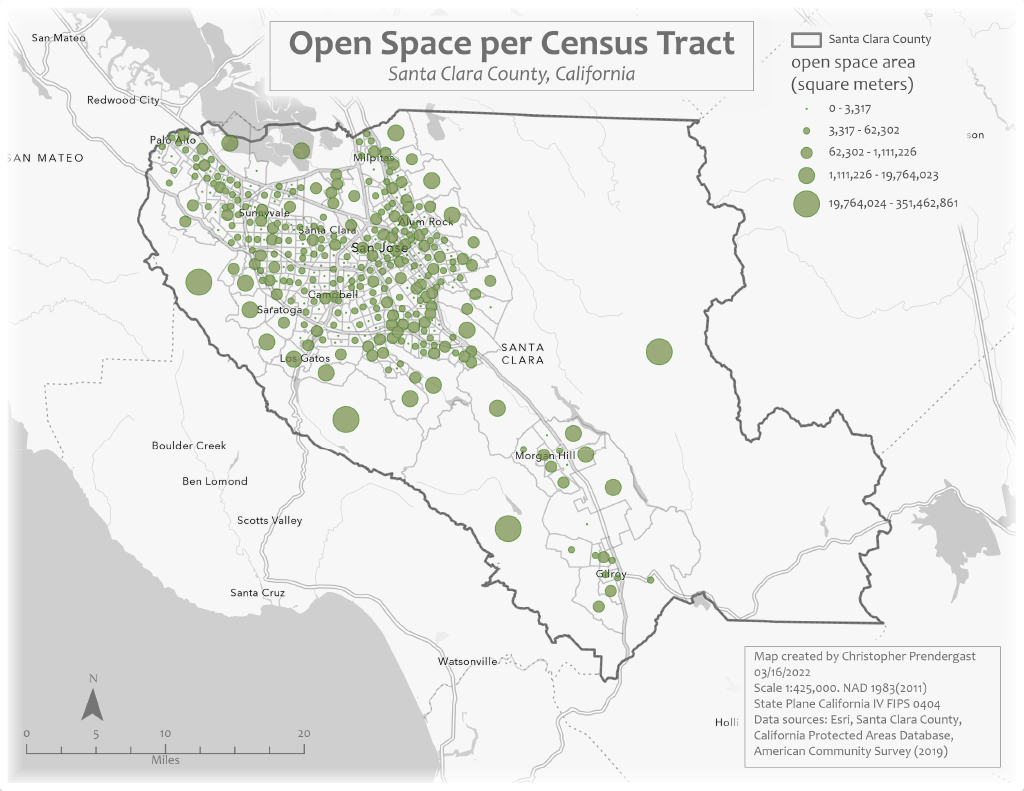
Open Space per Census Tract
Publicly accessible open space areas are not evenly distributed in space across the county. While residents of urban areas have access to many smaller open spaces, larger open space areas are typically located in more rural areas further outside the city limits.
This map shows the total open space area for each census tract.
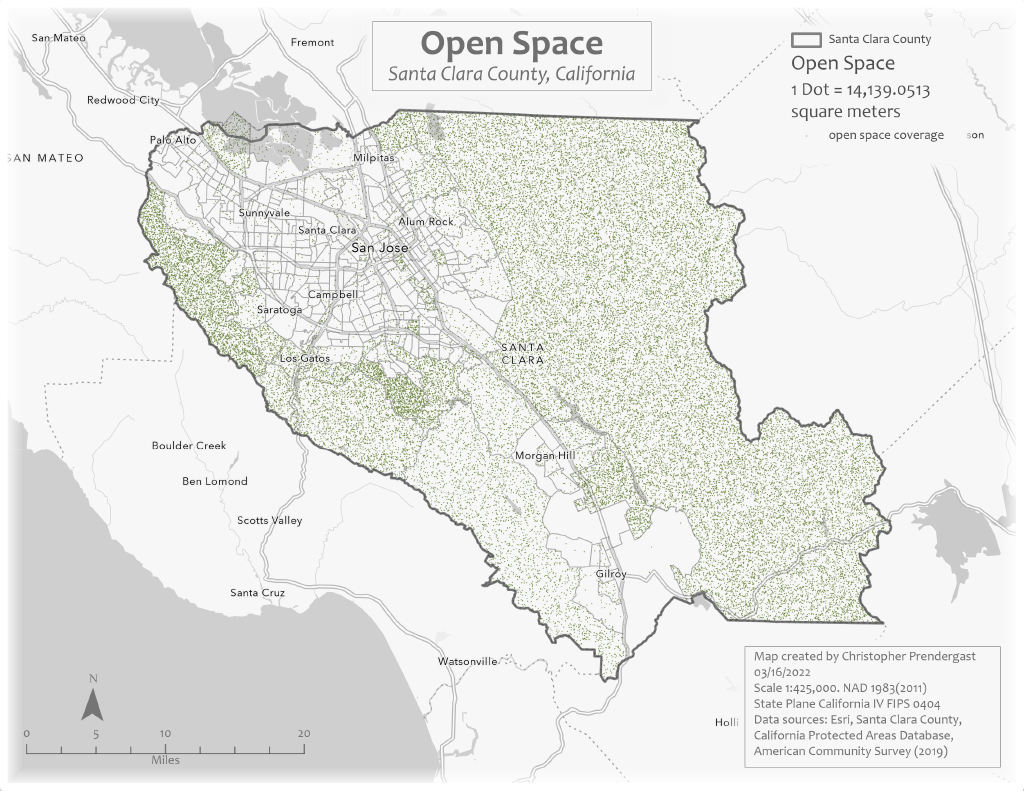
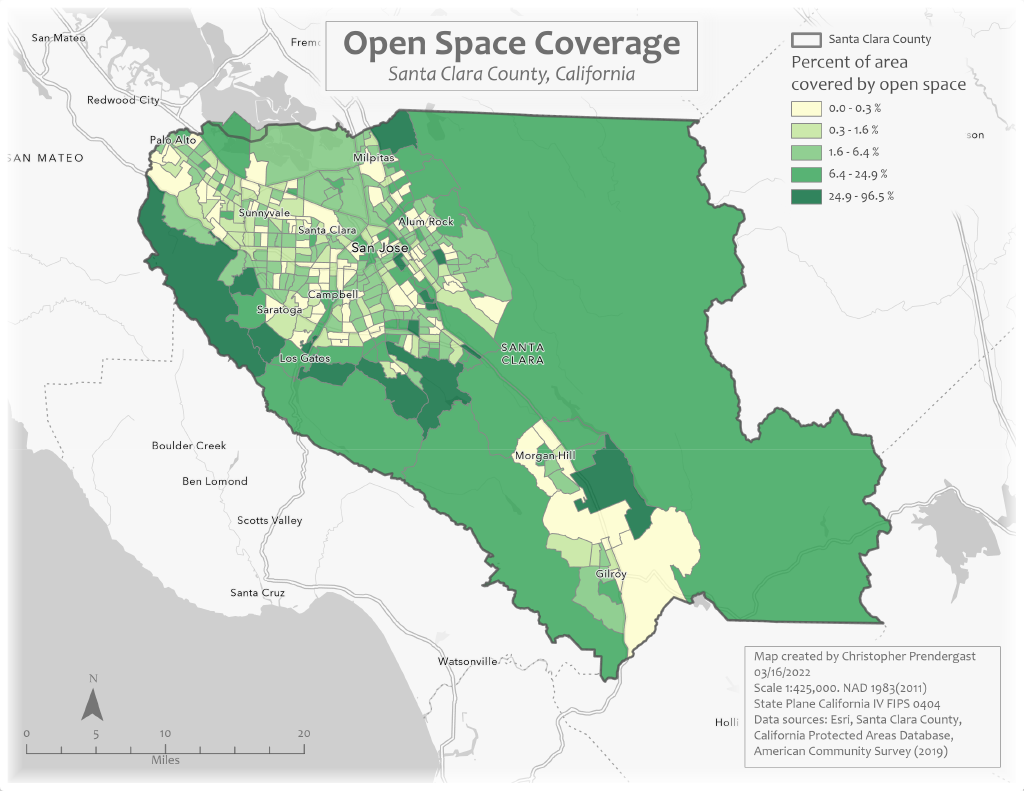
Open Space Coverage
Open space coverage offers one measure of the accessibility of open space areas. Coverage is the ratio of the area of land dedicated to open space divided by the total land area calculated for each census tract.
In general, as this map illustrates, open space coverage tends to be lower in urban census tracts and higher in non-urban census tracts.
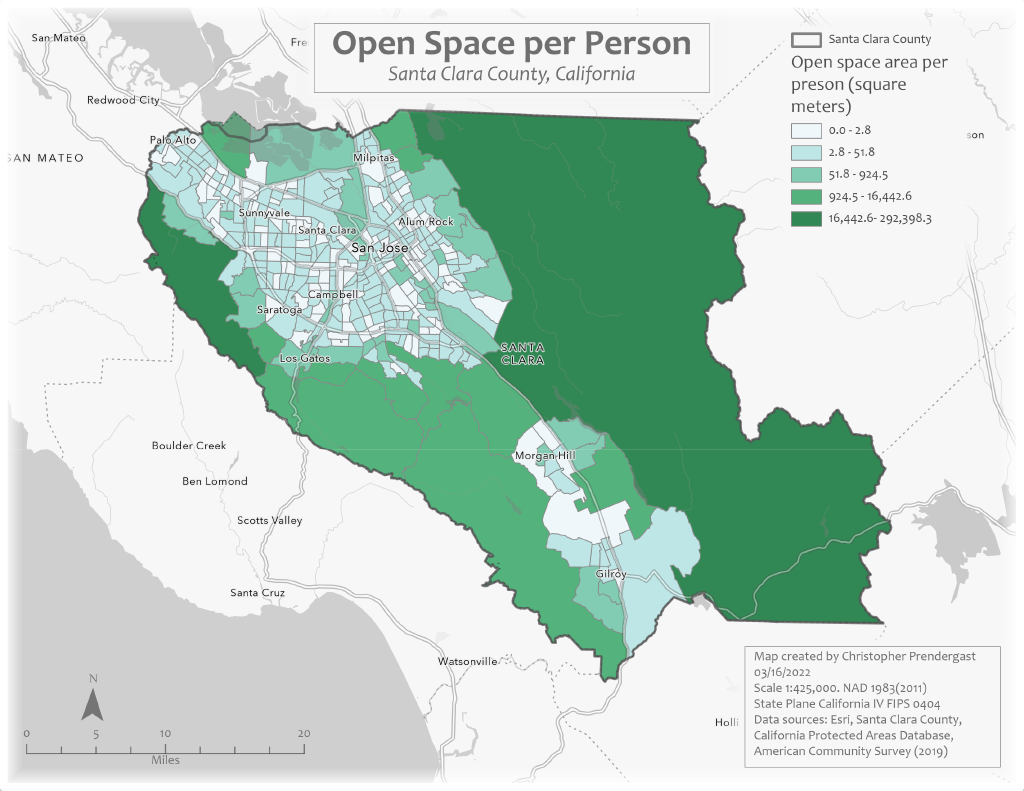
Open Space Area per Person
A second measure of accessibility is the area of open space per person calculated for each census tract.
This map shows that, in general, the open space per person is lower in urban census tracts and higher in non-urban census tracts. This pattern occurs because large open space areas are often located in non-urban census tracts which typically have lower population densities.
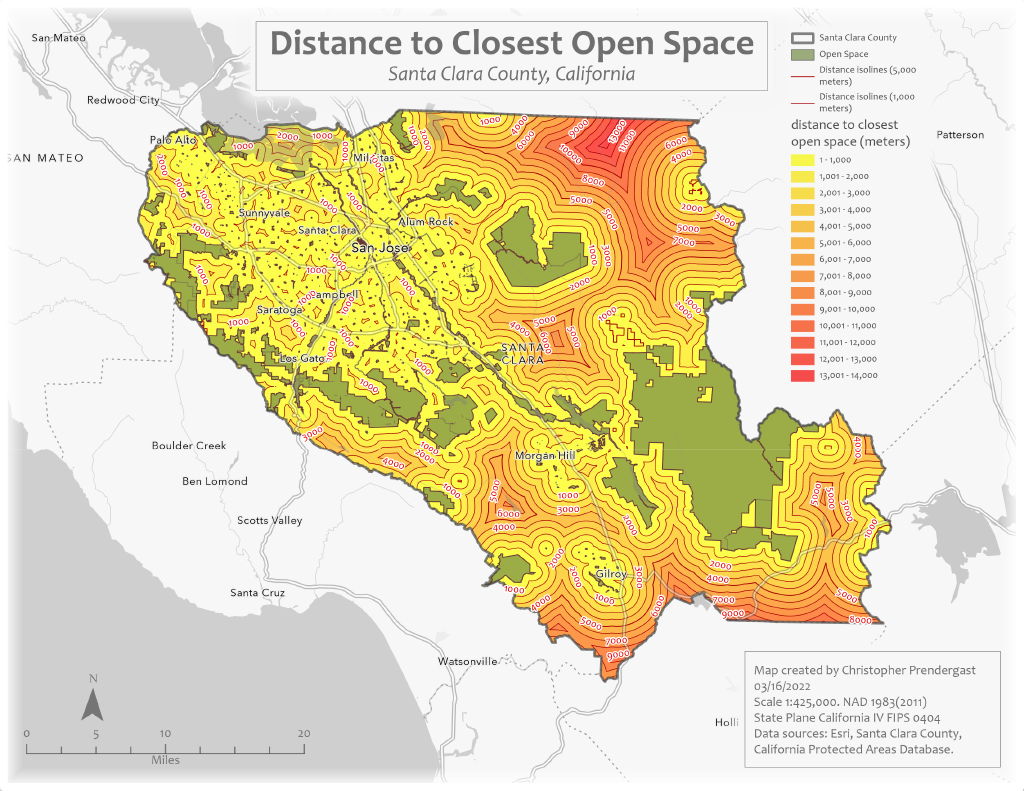
Distance to Closest Open Space
A third measure of accessibility is the distance from any point in the county to its corresponding closest open space area.
This map shows the distance to the closest open space area across the county. You will see that residents in the northeast corner of the county must travel the furthest to reach publicly accessible open space.
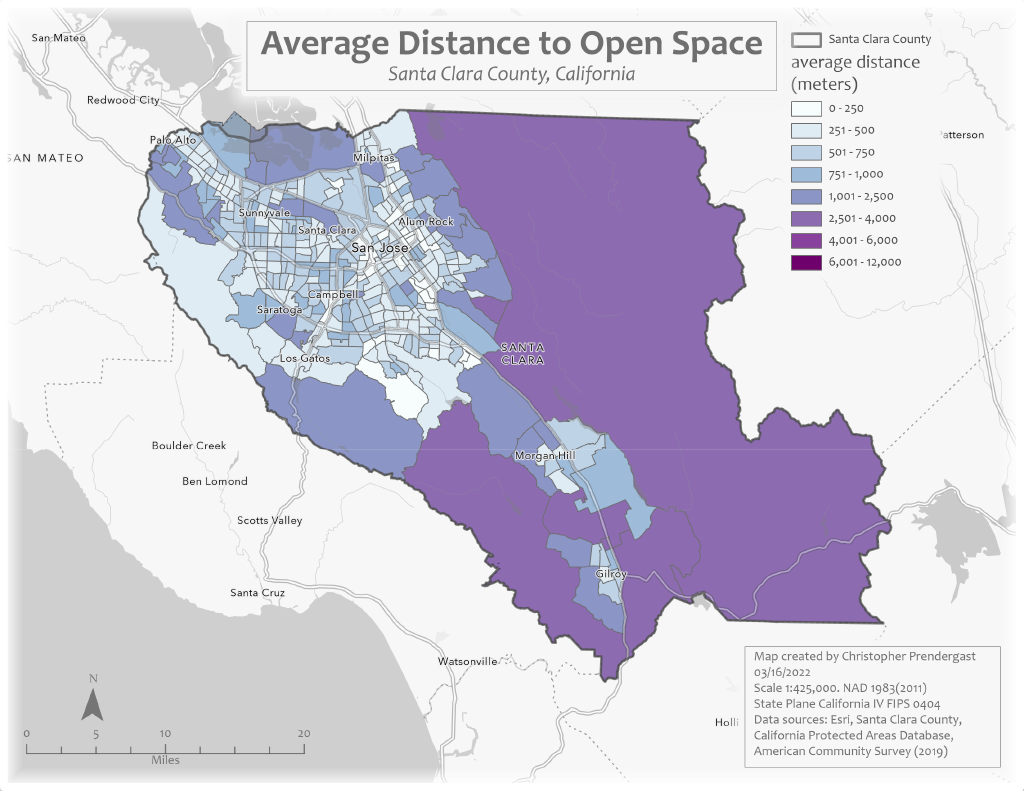
Average Distance to Open Space
A fourth measure of accessibility is the average distance to the closest open space area calculated across all points within each census tract.
This measure is more useful for urban areas where each census tract typically covers a smaller area and open space areas are often smaller and more numerous. For more rural areas, particularly large non-urban census tracts, this average measure can hide significant variation in accessibility within each census tract.
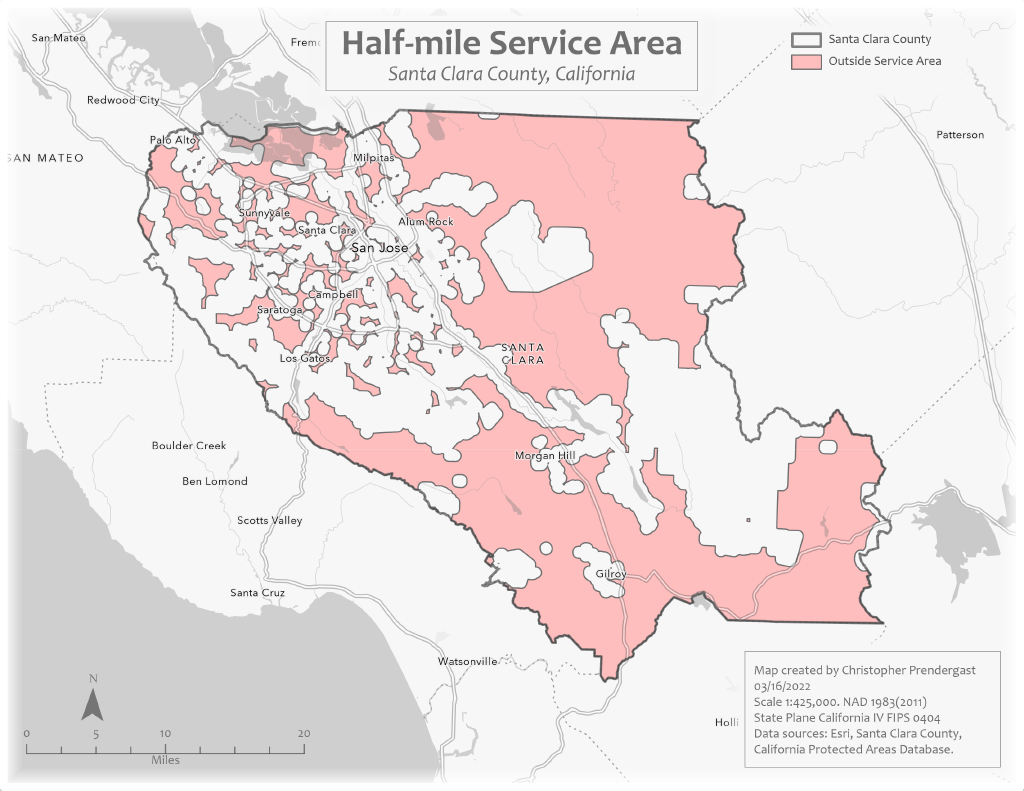
Half-mile Service Areas
A final way to measure the accessibility of open space is to calculate half-mile service areas around each open spaces. One half mile corresponds to the distance an average person can cover on foot in 10 minutes. This map highlights those areas that lie outside the combined half-mile service areas of all open space and, therefore, are not considered to be within a walkable distance from any open space area.