Overview
Access to open space is vital to human health, fitness, and well-being. In addition, open spaces also provide essential habitat for plants and animals. The Midpeninsula Regional Open Space District (MROSD) manages more than 70,000 acres of open space in the San Francisco Bay Area. The majority of these regional open spaces are located in the Santa Cruz mountains which lie to the west of the San Francisco Bay. Equitable access to these valuable resources is a significant issue.
This study examines the accessibility of MROSD's open spaces by looking for spatial relationships between three factors, the distance to closest open space preserve, income level, and population density. A series of maps illustrate the spatial distribution of these three factors.
The series includes the following maps:
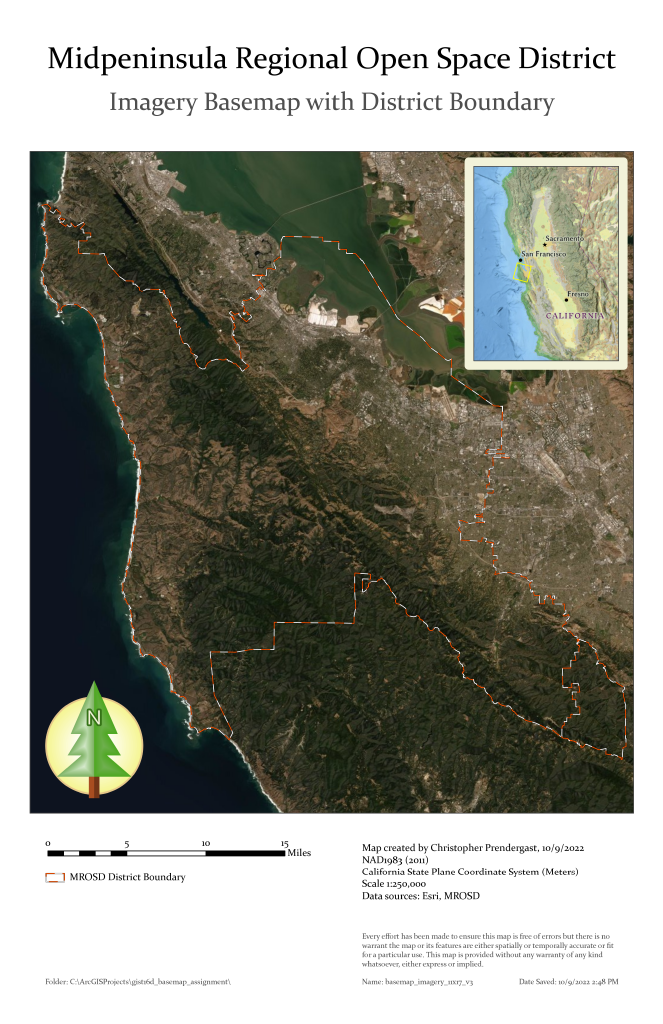
- Raster imagery basemap showing MROSD boundary
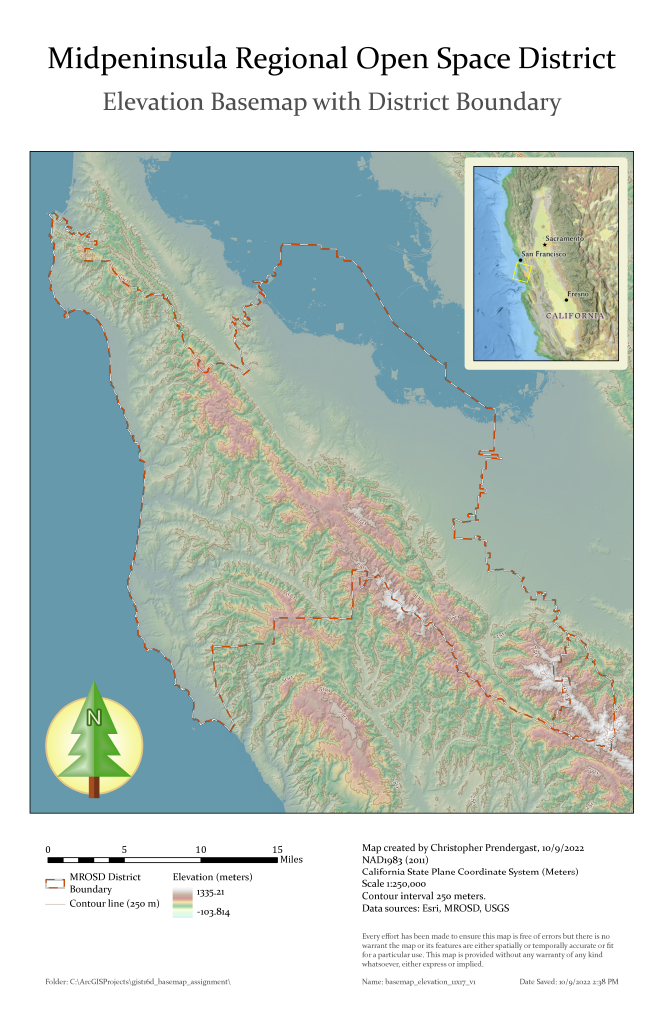
- Raster elevation basemap showing classified digital elevation data
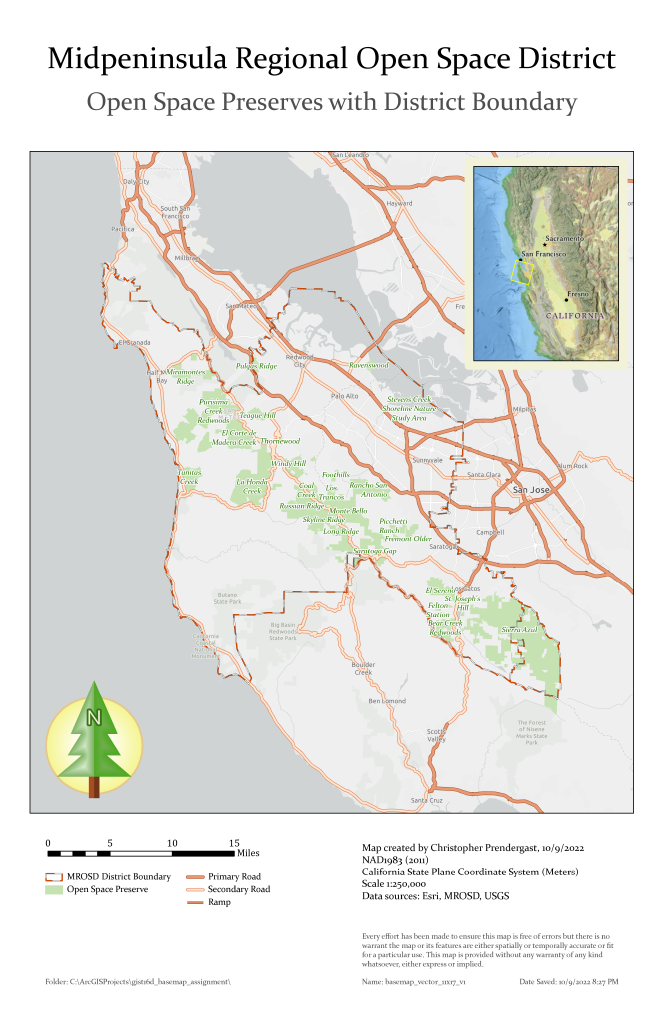
- Vector basemap show location of MROSD preserves and district boundary
- Proportional symbol map showing population by census tract
- Choropleth map showing median household income by census block group
- Thematic map showing both population by census tract and median household income by census tract block group
- Multivariate map illustrating population by census tract and median household income by census tract block group
- Isopleth map and chart of median household income by census block group vs distance to closest MROSD preserve.
Imagery Basemap
The imagery basemap provides context overlaying MROSD's boundary on top of raster satellite imagery of the region.
Elevation Basemap
The raster elevation basemap provides further context showing classified digital elevation data for the region.
Vector Basemap
The vector basemap displays the locations of MROSD's preserves and the district's boundary.
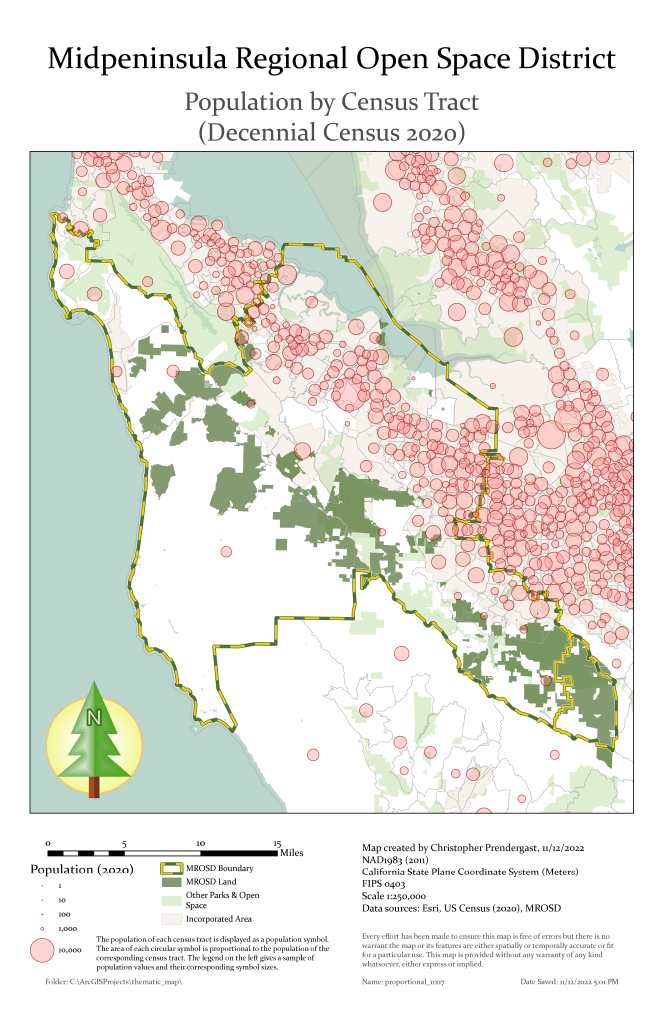
Proportional Symbol Map
The Bay Area is a densely populated area. However, the population is not evenly distributed across the region. The most densely populated areas are concentrated in the urban area which cluster around the shores of the San Francisco Bay. The Santa Cruz mountains to the west are less densely populated. The coastal areas west of the Santa Cruz mountains are much less densely populated.
This map explores the spatial relationship between the location of the MROSD open space preserves and the distribution of population. Obviously, larger regional open spaces are located in less densely populated locations. The map uses proportional symbols to show the population for each census tract.
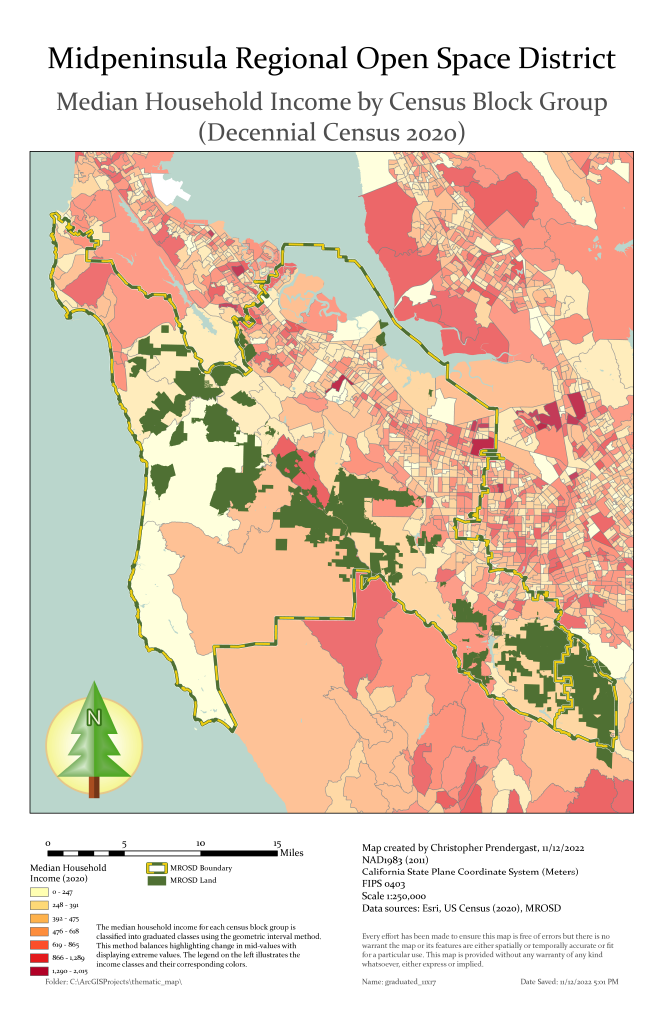
Choropleth Map
This map illustrates the spatial distribution median household income. Income data was taken from from the US Census Bureau's American Community Survey (ACS).
The color and transparency of each area symbolizes the median household income for that census block. The darker the color the higher the income. Note that the ACS records all incomes above $200,000 as $200,001.
The choropleth map shows the spatial distribution of median household income by census block group.
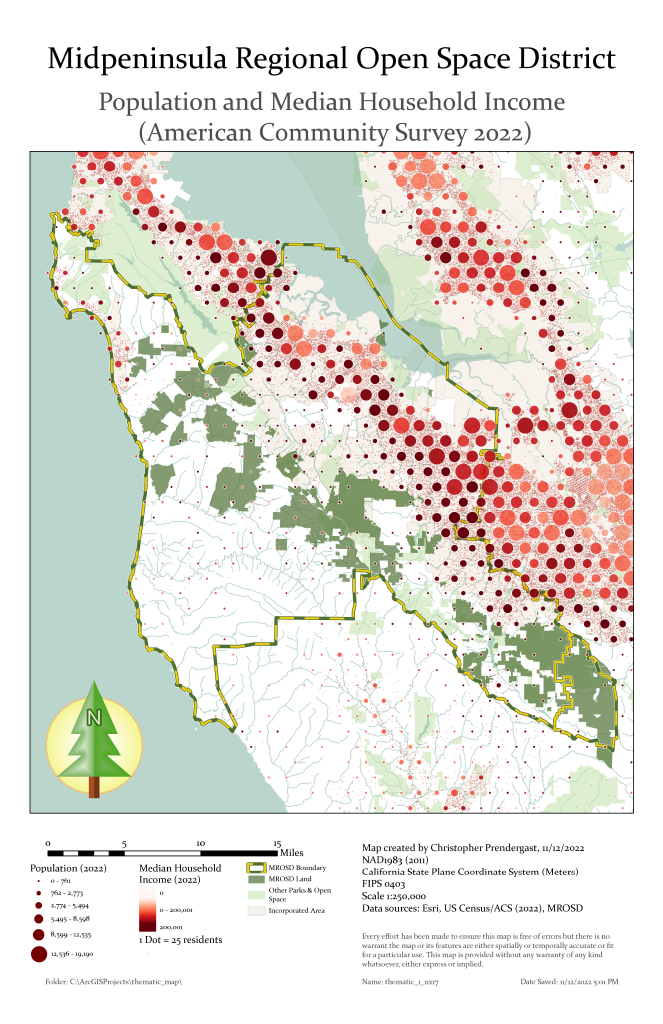
Thematic Map
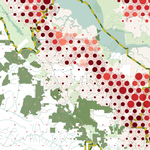
This map illustrates the spatial relationship between population density and median household income. Population and income data from the US Census Bureau's American Community Survey (ACS) was reallocated to equal sized hexagonal cells in a regular grid pattern using Esri's ArcGIS GeoEnrichment service.
The color and transparency of each circular symbol corresponds to the median household income interpolated for the corresponding grid cell. The darker the color the higher the income. The size of each symbol corresponds to the total interpolated population for the corresponding grid cell. Because the grid cells are all equal in area, the symbol size also indicates the population density for the cells. Note that the ACS records all incomes above $200,000 as $200,001.
The thematic map illustrates the spatial relationship between population by census tract and median household income by census block group together with proximity to MROSD open space preserves.
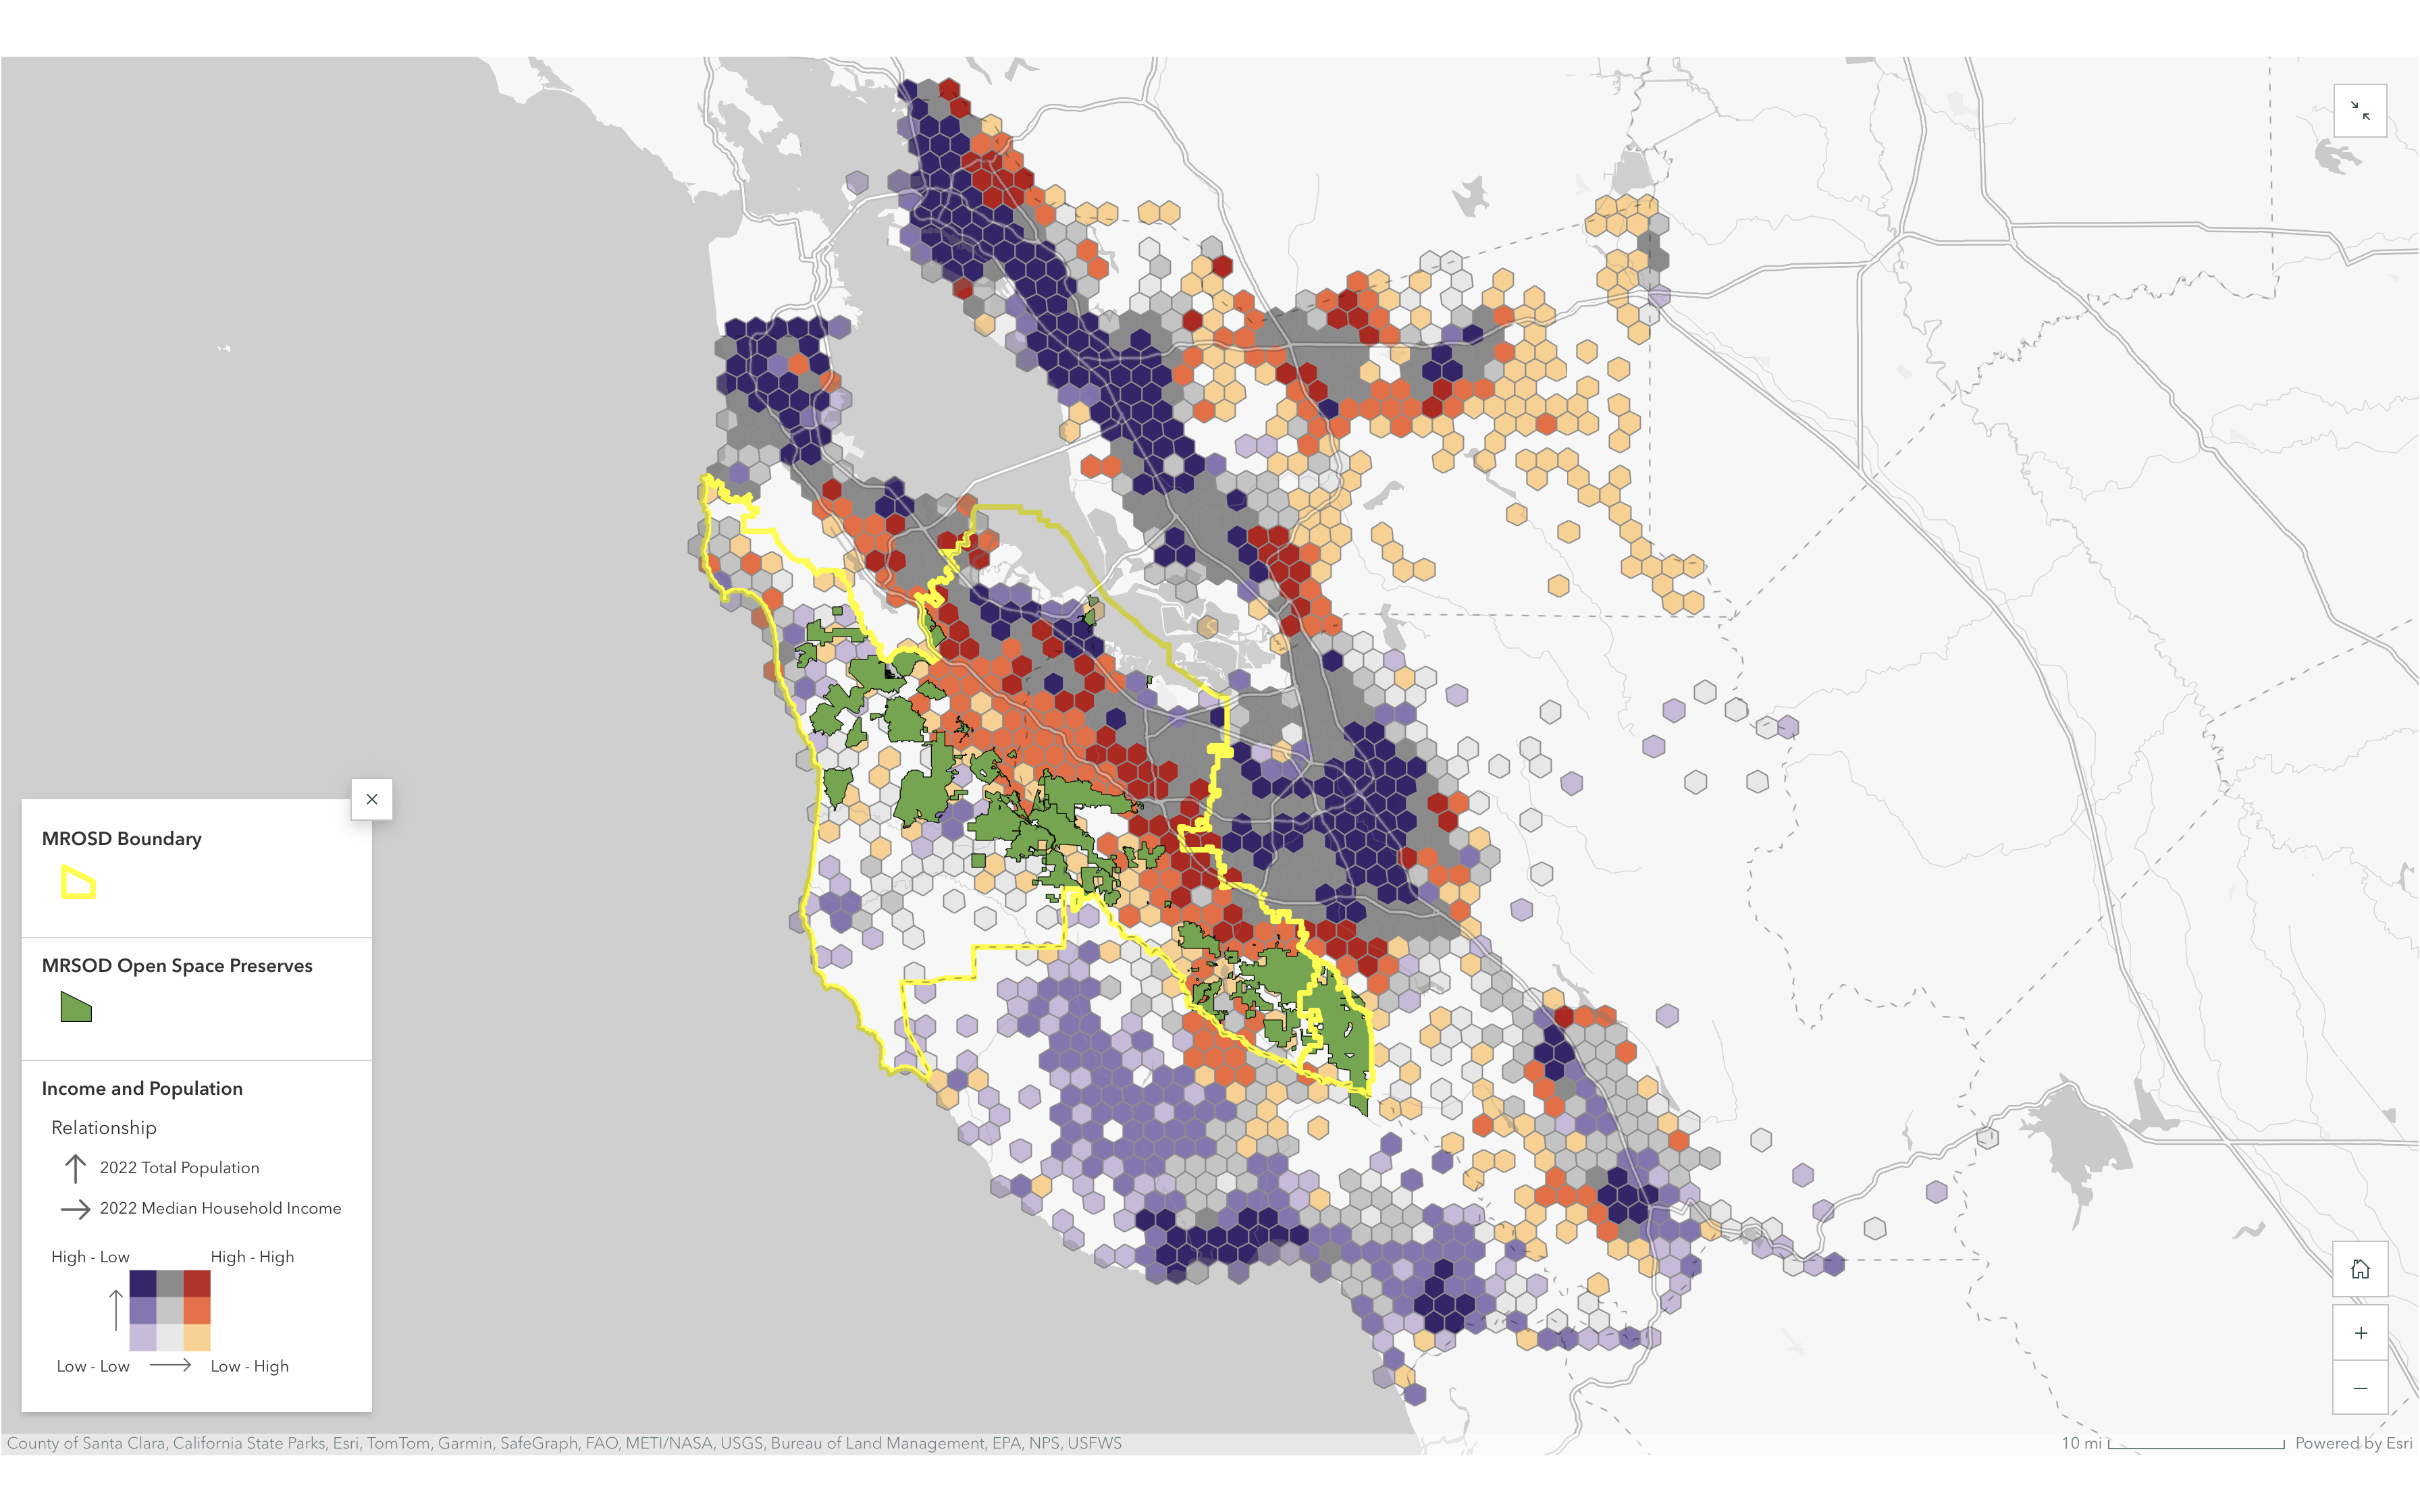
Multivariate Map
In the StoryMap included below the spatial relationship between population by census tract and median household income by census block group together with proximity to MROSD open space preserves is presented as a multivariate map.
This map presents a multivariate view of the income and population density data. The darker colors indicate higher population densities. Red indicates higher median household income. Blue indicates lower median household income.
Isopleth Map and Chart
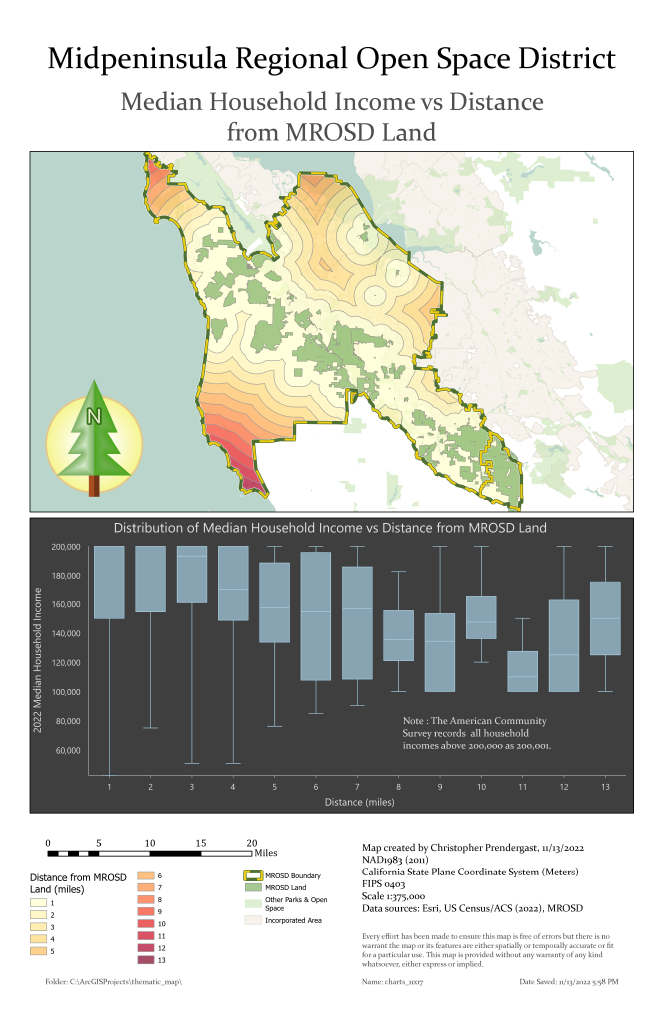
The map below show the distance to the closest MROSD open space preserve for points within the four-county study area. These concentric ring buffers were used to aggregate the income data from the individual data points to generate the box plot presented below. In this study, the distance to the closest MROSD open space preserve is used as an imperfect proxy for the accessibility of open space.
The chart illustrates the relationship between income level and distance to closest MROSD open space preserve. The box plot shows the distribution of median household income by distance from the closest MROSD open space preserve.
The data was compiled from census block and tract data for the four counties within the study area: Alameda, Santa Clara, Santa Cruz, and San Mateo counties. Of course, MROSD is not the only open space district managing regional open space preserves within this large area. At the further distances from MROSD preserves it is likely that residents may have the option of visiting other closer open space preserves managed by various different agencies.
Map and chart showing median household income by census block group and distance to closest MROSD preserve.
StoryMap
The analysis is also presented as an interactive StoryMap. A login is required to access this StoryMap.

Click here to view the StoryMap on ArcGIS.com (login required).
Conclusions
In general, larger regional open space preserves are located in less densely populated areas with higher income levels. For the Midpeninsula Regional Open Space District, this means that most of the open space preserves it manages are located in the Santa Cruz mountains and their foothills.
The communities of Los Gatos, Saratoga, Los Altos Hills, and Portola Valley are located on the western periphery of the urbanized Bay Area, between the densely populated urban areas which surround the San Francisco Bay and the Santa Cruz mountains. This location positions these communities as key access gateways to MROSD open space preserves for residents of more urban areas. In contrast to the urban areas, these gateway communities generally enjoy higher income levels and lower population densities. Consequently, most urban dwellers must take a car trip to access the majority of MROSD open space preserves.
Equitable access could be improved by providing safe walking, running, and cycling corridors that link the densely populated urban areas to the MROSD open space preserves. These corridors would naturally pass through the gateway communities. Creeks offer an obvious connection between the upland open space preserves and the urban community around the San Francisco Bay. Additional trails running along these creeks could provide enhanced access to the MROSD open space preserves. Public transit routes or regular shuttle service between urban areas and key access points to the MROSD open space preserves would also help to provide more equitable access to MROSD open space preserves for all.
Data Sources and Credits
- Preserve descriptions & photos: MROSD
- Open space GIS data: MROSD
- County and urban boundaries: Alameda, Santa Clara, Santa Cruz, & San Mateo Counties
- Population and income data: US Census Bureau / American Community Survey
- ArcGIS GeoEnrichment Service: Esri