GIS Meetup & Educational Seminar Summary #7
Presented on: June 21st, 2019.
Presenters:
- Shannon Kalisky – Product Manager, Analytics and Data Science, Esri
- Orhun Aydi – Spatial Statistics researcher/Product Engineer, Esri
- Yongyao Jiang – Software Engineer, Machine Learning, Esri
Overview
Spatial data science is the use of spatial methods and algorithms to analyze data, find patterns, make predictions, and build better models. This webinar introduces ESRI’s Python-based tools for spatial data science including machine learning and deep learning. The presentation included several demonstrations of machine learning, and deep learning applied to spatial data.
ArcGIS Integrations
ArcGIS integrates with many open-source frameworks including scikit-learn, TensorFlow, PyTorch, and Jupyter notebooks through the ArcGIS API for Python. In addition, ArcGIS contains many tools and algorithms optimized to solve spatial problems which are available via ArcPy. Moreover, the R language can be integrated via the R ArcGIS bridge. ArcGIS also integrates with platforms such as Microsoft AI and IBM Watson.
Feature/Data Engineering
In the GIS field, the term “feature” refers to sets of point, lines, polygons, or more complex geometries. Therefore, because this term already has a specific meaning in the GIS field, the term “Data Engineering” is used for what data scientists would normally call “feature engineering.” The data engineering process transforms raw data into datasets which are suitable for further analysis. Data engineering can include tasks such as:
-
Wrangling and cleaning data
-
Geocoding
-
Feature engineering
-
Geo-enrichment
Feature engineering is the process of refining data attributes and can include field calculations and adding dummy values, overlay analysis, and filling missing values. Geo-enrichment adds new attributes to the dataset by incorporating spatiotemporal content.
Data Engineering Notebook
An ArcGIS notebook was used to demonstrate a typical data engineering workflow. The raw data was loaded into a Pandas dataframe and various transformations were used to replace missing, not applicable, unknown, and blank values. A computed field was then calculated, and the results were displayed on a fully interactive map embedded within the notebook.
Data Cleaning
A second demonstration employed spatial tools to clean a raw dataset consisting of gun crime data. Overlay analysis was used to drop some data points outside the study area. The next step in the workflow was to visualize and explore the data using maps, charts, and animations to uncover spatial patterns, trends, outliers, and anomalies. The demonstration continued with using various ArcGIS analysis tools to find clusters in the data.
Spatial Analysis with ArcPy and ArcGIS API for Python
Spatial analysis allows the exploration of connections between datasets in both space and time. Spatial analysis tools available through ArcPy and the ArcGIS API for Python include:
-
Pattern detection
-
Spatially constrained multivariate clustering
-
Multivariate clustering
-
Density-based clustering
-
Image segmentation
-
Hot-spot analysis
-
Cluster and outlier analysis
-
Space-time pattern mining
-
Space-time analytics
-
Simultaneously analyze the spatial and temporal distribution of data
-
Space-time cubes
-
Prediction
- Regression and prediction analysis
- Empirical Bayesian kriging (EBK)
- Areal interpolation
- EBK regression prediction
- Ordinary least squares regression
- Exploratory regression
- Geographic weighted regression
- Random forest classification/regression
-
Classification
- Maximum likelihood classification
- Random trees
- Support vector machines
-
Suitability analysis and location optimization
-
Routing and logistics
-
Terrain analysis
Machine Learning
Machine learning (ML) encompasses data-driven algorithms and techniques that are used to automate prediction, classification, and clustering tasks.
Two types of ML, traditional and spatial, can be distinguished. On one hand, in traditional ML, geography often acts as the “key” to join disparate datasets. Traditional ML is useful to solve a wide range of spatial problems. On the other hand, spatial ML incorporates geography in the computations themselves, considering such factors as shape, density, contiguity, spatial distribution, and proximity.
Regression
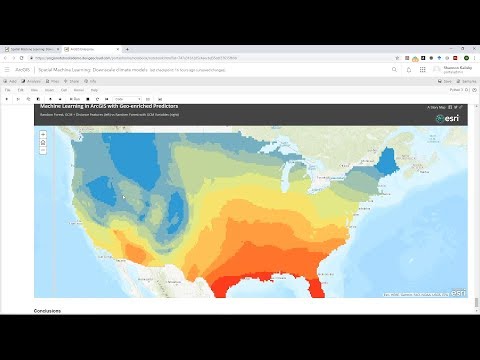
In a third demonstration a regression workflow involving the downscaling of climate data was shown. In this demonstration observed meteorological data were used as the input features to the algorithm which predicted local climate variable such as temperature as the output labels.
The input features consisted of 19 climate variables as predictors. The demonstration compared the results of three non-spatial ML algorithms, namely, support vector machine, rigid regression, and random forest, with the performance of two spatial regressors: geographically weighted regression (GWR) and EBK regression.
The ArcGIS Python API enables access to the analysis and mapping capabilities of ArcGIS. The ArcPy libraries provide spatial analysis and spatial machine learning. These tools were used to perform the data engineering tasks required to create a spatial dataframe ready for analysis.
A spatial data wrangling function was used to fill in missing values in the data from their nearest neighbors. A continuous surface was then created using EBK to allow the interpolation of data points which were then extracted using the “extract multi-value to point” tool. The result was a complete dataset ready to train the regression models.
Next the seaborn statistical visualization library was used to create a correlation matrix and explore the relationships between the variables.
Finally, the results of running the various algorithms were compared using the swipe tool on a story map embedded within the notebook. Overall, the comparison showed that incorporating spatial features in the analysis can make a big difference in the results.
Deep Learning
A fourth demonstration applied spatial deep learning to a land cover classification problem using satellite imagery via the ArcGIS Python API. The goal was to predict the land classification class for each pixel in the imagery. The inputs were 1-meter resolution color-infrared NAIP imagery and a labeled training image containing class labels for each pixel. First the imagery was divided into chips and then chips were divided into batches. Individual chips were also flipped and rotated to create a larger set of training data. A deep learning model was defined using the U-net convolutional neural network. The Python API provides a learning rate finder to identify the optimal learning rate. After the model was trained, the classification results were viewed to compare the predictions to the ground truth for validation. When you are happy with your model it can be deployed by uploading it to your enterprise portal as a deep learning package. The model can then be used to classify new images and view the results.
StoryMap
The webinar concluded with a demonstration that presented the analysis results as a StoryMap. This makes the results more interesting and engaging to non-technical decision makers who may be intimidated by Jupyter and ArcGIS notebooks.
Reaction
Although I do not yet understand all the details of the technology, I found this webinar presented a clear and compelling case for using spatial deep learning in ArcGIS to solve certain types of problems. I find this an interesting, powerful, and exciting technology and would love to learn more.