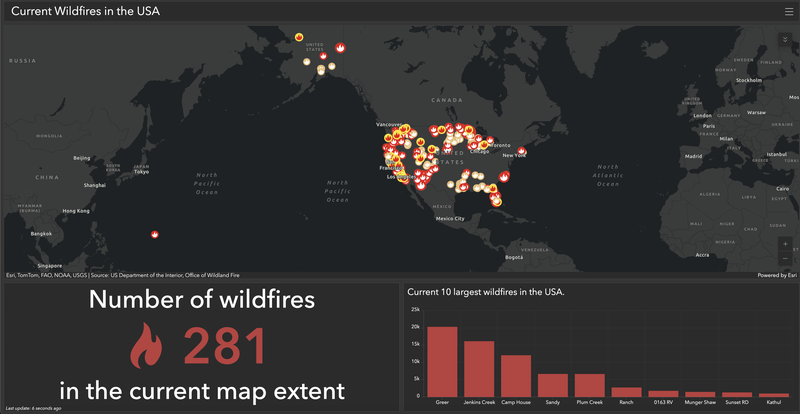
An interactive ArcGIS Dashboard for monitoring wildfires. The dashboard integrates a live feed layer on a web map with visual elements such as indicators and charts to provide real-time insights. Users can track the number of active wildfires, identify the largest fires by location, and explore spatial patterns and trends. By combining maps, charts, and indicators in a single interface, the dashboard facilitates informed decision-making, event monitoring, and efficient information sharing.
Click here to view the wildfire dashboard on ArcGIS.com (login required).